
Kai Xin Tai

Yair Cohen
Google Kubernetes Engine (GKE) is the preferred way to run Kubernetes on Google Cloud as it removes the operational overhead of managing the control plane. Earlier today, Google Cloud announced the general availability of GKE Autopilot, which manages your cluster’s entire infrastructure—both the control plane and worker nodes—so that you can spend more time building your applications. Datadog is proud to partner with Google Cloud for this launch to give you deep visibility into your dynamic, containerized workloads on Autopilot.
In this post, we’ll show you how to deploy Datadog on your Autopilot cluster and leverage Datadog’s entire feature set, including out-of-the-box dashboards and Live Containers, to comprehensively monitor all of your telemetry data.
Fully managed, but fully capable
If you’re an existing GKE user, you might notice a few differences with Autopilot. First, Google Cloud is now responsible for managing your nodes and autoscaling them according to the needs of your workloads. This enables you to monitor your nodes at a distance, without worrying about capacity or routine maintenance concerns. Second, Autopilot takes care of pod scheduling so you can freely run your workloads—you no longer need to spend time bin packing to optimize resource usage and costs. In some cases, Autopilot might even reserve more resources than you request in order to optimize performance, but you only pay for what your pods actually request while they’re running. And third, Autopilot is built with opinionated best practice patterns (e.g., workload identity for security) to ensure your deployments are production-ready.
Even though Autopilot handles all of your infrastructure needs, the underlying nodes running your workloads are not completely abstracted away. This means you can still keep tabs on node activity and perform certain operational tasks that you’re used to. For instance, you can use commands like kubectl get nodes and kubectl describe nodes to inspect your nodes, and use workload scheduling constraints like pod affinity and anti-affinity to co-locate pods on the same node, or prevent such co-location. Additionally, you can use node selectors and node affinity for zonal topologies (e.g., to group all pods in a certain zone), but not to assign pods to specific nodes. Autopilot also supports DaemonSets so you can run background processes in a resource-efficient manner (compared to using a sidecar pattern, for instance).
Get a high-level view of your containerized applications running on GKE Autopilot
Datadog gives you comprehensive visibility into your applications on GKE Autopilot by collecting metrics, traces, and logs from Kubernetes, Docker, and any of our 1,000+ integrations that you’re running. You can immediately visualize node-, container-, and pod-level data on our out-of-the-box dashboards, or create custom dashboards for seamless data correlation across your entire stack.
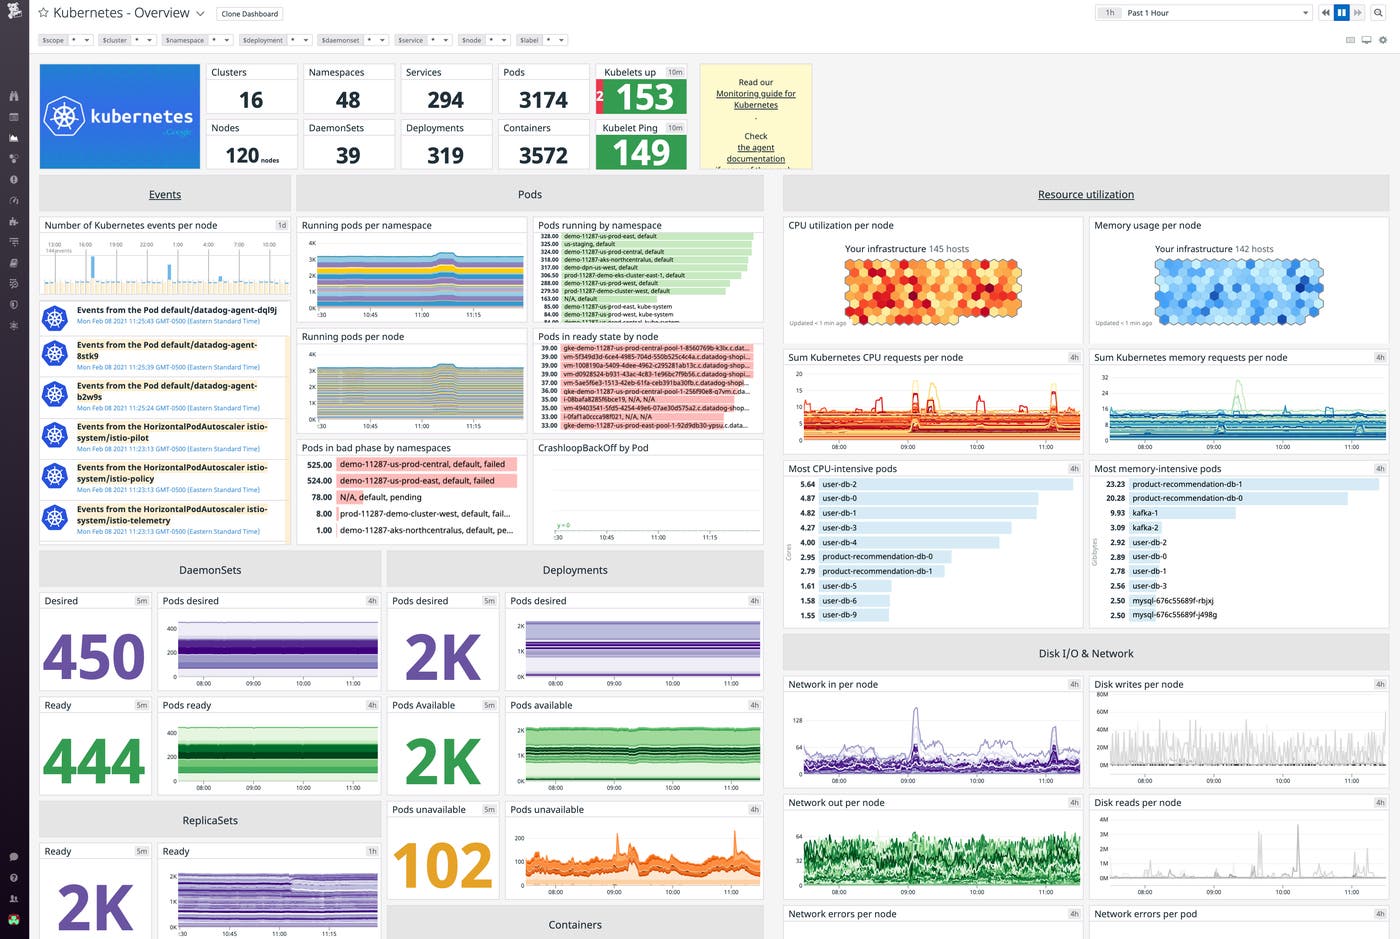
For instance, you’ll want to keep an eye on the number of available and unavailable pods in your Autopilot cluster. While brief disruptions in availability can be expected during pod startup or rolling updates, an anomalous spike in the number of unavailable pods can indicate an issue with the configuration of their readiness probes. If this occurs, you can easily pivot to the pod’s logs to gather more context around the issue.
View real-time information on every Kubernetes resource
Even as your Autopilot environment grows increasingly complex, Datadog can help you surface performance issues and provide the context you need to effectively troubleshoot them. Live Containers delivers real-time insight into every layer of your Kubernetes clusters—from Deployments and Services down to individual pods. Datadog automatically imports metadata from Kubernetes, Docker, and Google Cloud services, and turns it into standardized tags (e.g., kube_cluster_name, pod_name, image_name) that you can use to drill down to specific resources.
Monitor the status of Deployment rollouts
During the rollout of a Deployment, Kubernetes creates or updates ReplicaSets to reach the state you have specified in your Deployment manifest. Live Containers makes it easy for you to track the status of rollouts and ensure that they’re successful. In the example below, we can see that the Deployment has created eight replicas, which are all up to date and available. We can also see the state of each ReplicaSet and verify that they are running as expected.
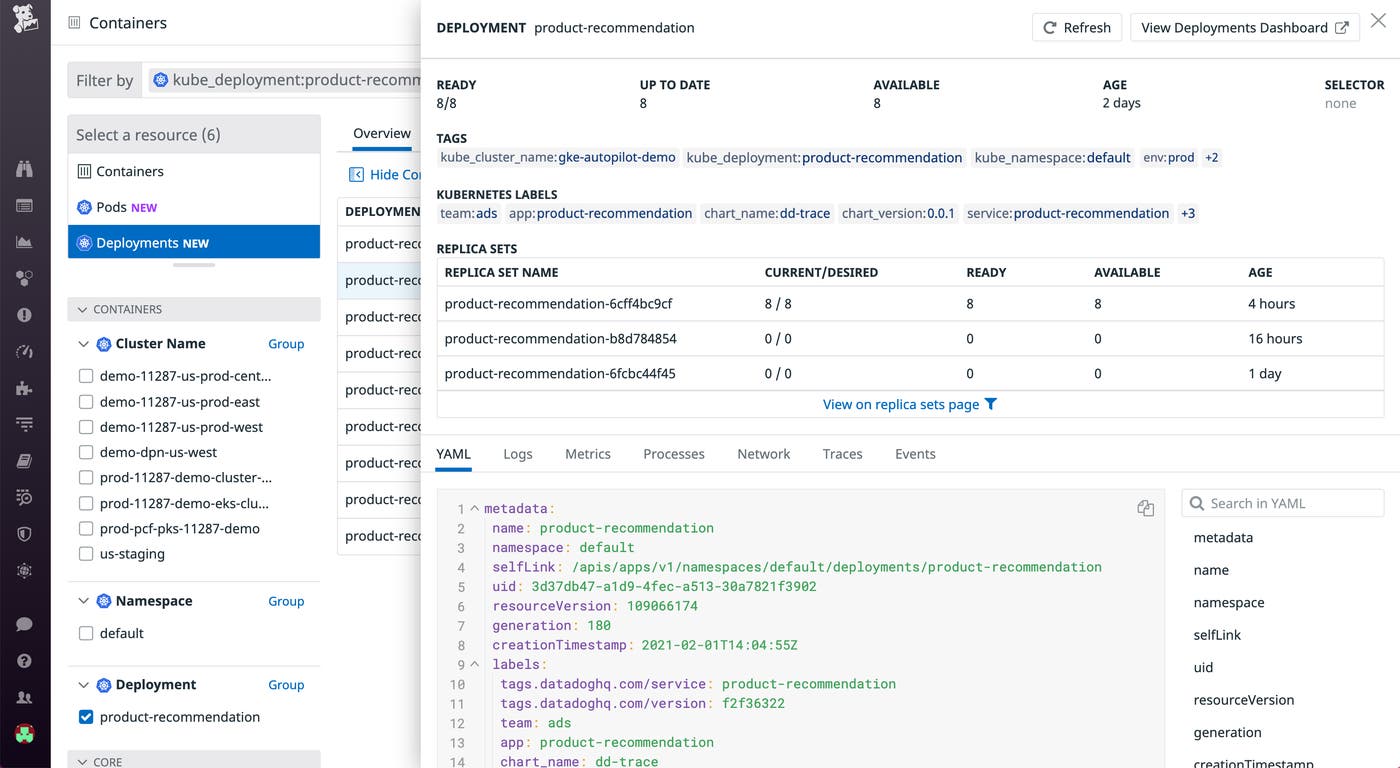
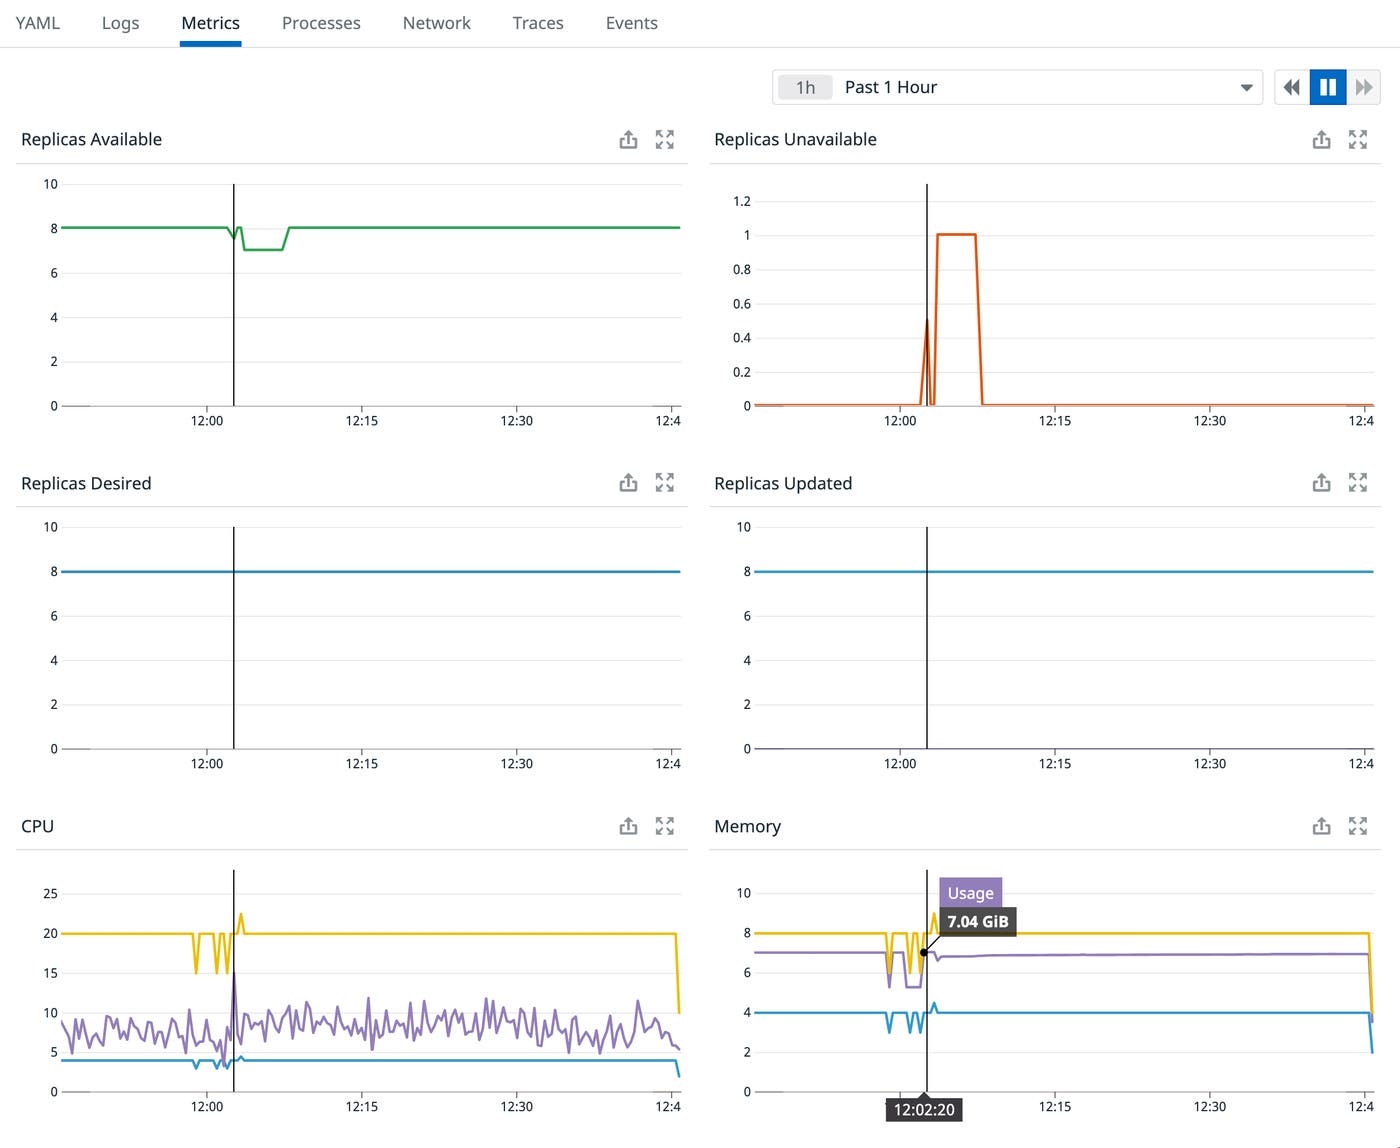
However, Deployments can also fail for a number of reasons, such as when a LimitRange constraint is violated or a pod quota is reached. If you encounter an issue with a rollout, you can easily view related metrics (e.g., resource usage, requests, and limits) and logs to gather more context around the issue.
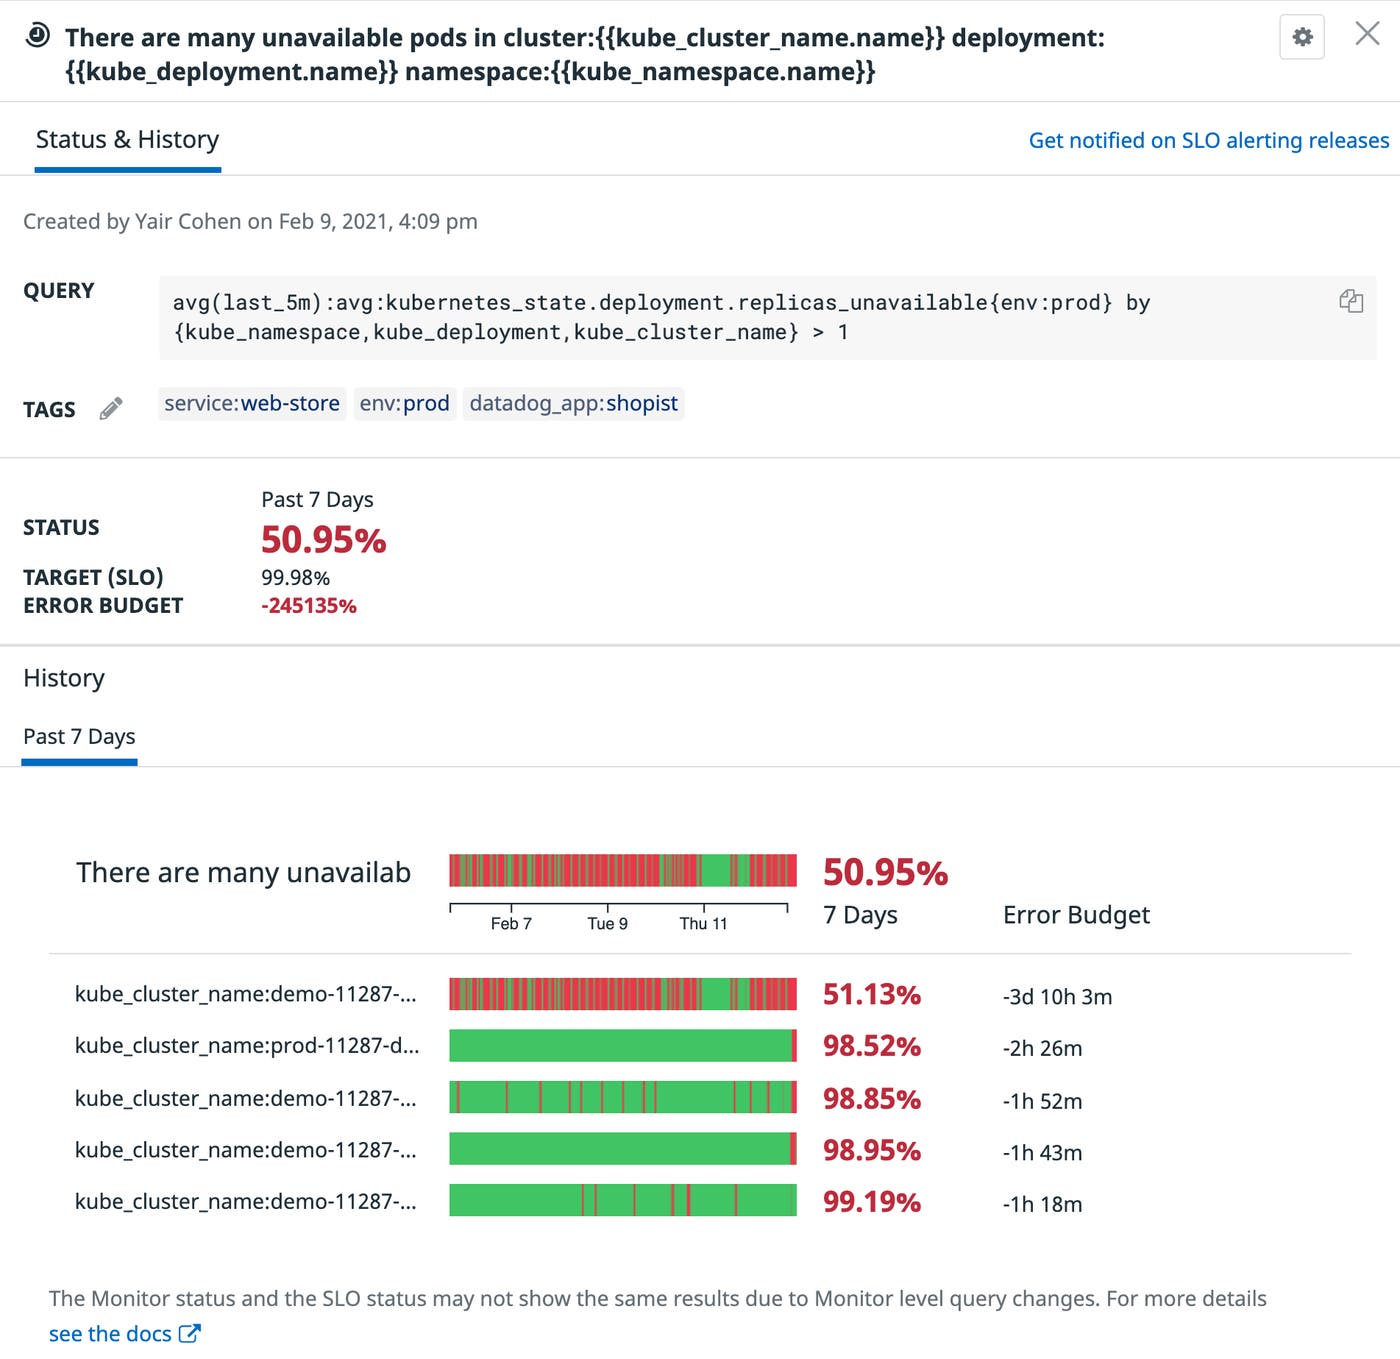
In addition, you can create a service level objective (SLO) that tracks the number of unavailable replicas in each Deployment—and monitor its status in real time—to ensure that you’re always meeting your application’s targets.
Track pod resource utilization
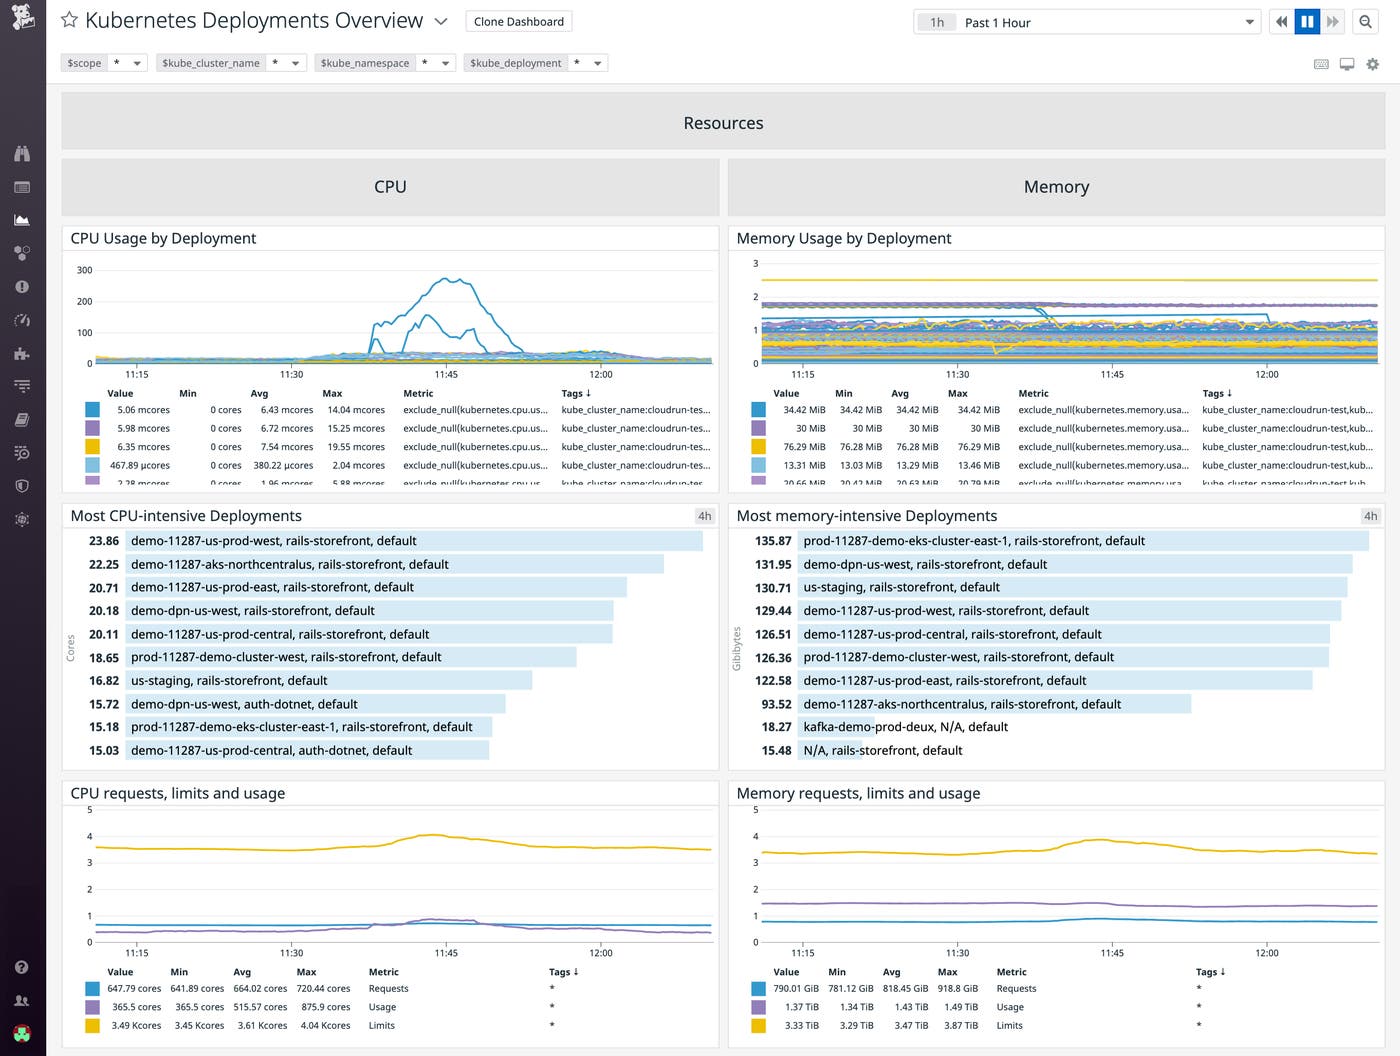
In addition, Live Containers tracks the resource utilization of your pods to help you make informed decisions when it comes to setting (or adjusting) requests and limits. If you specify too few resources, Kubernetes might begin throttling CPU to your pods or terminating those that have run out of memory. At the same time, you’ll want to avoid requesting—and paying for—more resources than your pods actually need. Note that pod vCPU comes in increments of 0.25 units, and the ratio of memory (in GiB) to vCPU must fall between 1:1 and 1:6.5. If you specify an invalid ratio, Autopilot will automatically scale up your resources accordingly.
In Datadog, you can get a high-level overview of the resource utilization of your deployments—and quickly identify the ones that are most CPU- and memory-intensive—on our out-of-the-box dashboard, as shown below. For more granular insight, you can navigate to the Pods tab of Live Containers and view the resource utilization of each container in a pod. Since Autopilot charges for the amount of resources your pods request, you can use this information to make any adjustments to optimize cost. You’ll want to fine tune your requests and make them more aligned with actual usage as well as investigate any anomalous spikes in usage.
Keep tabs on node health and performance
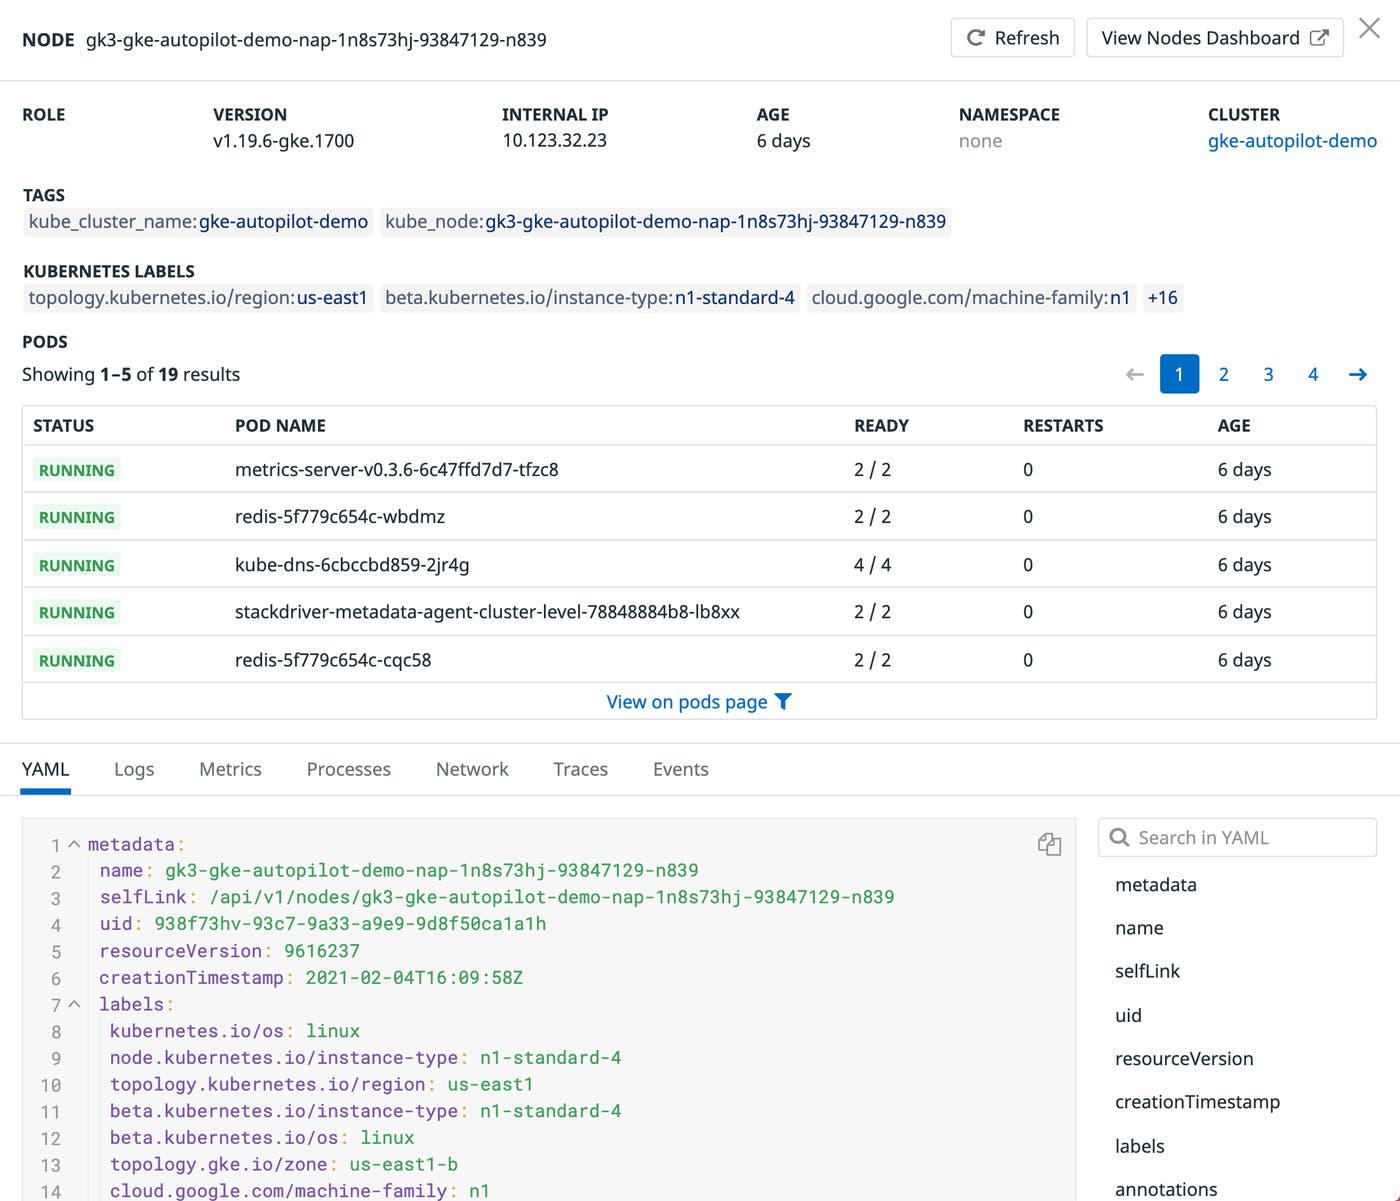
Even though Autopilot is managing your nodes, you can still keep tabs on their health and performance with Datadog. Nodes launched by GKE are searchable in Datadog with prefix gk3. Clicking on a node reveals key information such as its configuration details and the status of its constituent pods. From this panel, you can navigate to the pods page to view more detailed pod-level information.
Deploy Datadog on GKE Autopilot
Start by installing Helm and adding the Datadog repository. Then, deploy the Datadog Agent and Cluster Agent on Autopilot by running the command below. Note that the command also enables log and trace collection; you can omit the flags if you do not wish to enable them.
helm install <RELEASE_NAME> \ --set datadog.apiKey=<DATADOG_API_KEY> \ --set datadog.appKey=<DATADOG_APP_KEY> \ --set clusterAgent.enabled=true \ --set clusterAgent.metricsProvider.enabled=true \ --set providers.gke.autopilot=true \ --set datadog.logs.enabled=true \ --set datadog.apm.enabled=true \ --set datadog.kubeStateMetricsEnabled=false \ --set datadog.kubeStateMetricsCore.enabled=true \ datadog/datadogSee our documentation for more configuration options.
Once installed, the Agent will use Autodiscovery to automatically detect when certain common services (e.g., Redis, Elasticsearch) spin up and report metrics from those services. This helps you continuously monitor your containerized applications without any gaps, even as they scale or shift across containers and nodes. You can also enable our Google Cloud integration to monitor any Google Cloud services you’re running alongside Autopilot, such as Bigtable and Cloud Load Balancing.
In addition, you can register the Cluster Agent as an External Metrics Provider—and use the Kubernetes Horizontal Pod Autoscaler (HPA) to autoscale your workloads off of any metric in your Datadog account, as well as any custom Datadog metric query.
Start monitoring GKE Autopilot today
Autopilot fully manages both the Kubernetes control plane and worker nodes to provide an even more hands-off experience, so that you can focus on your applications and customers. Datadog’s new integration with Autopilot—along with our existing Kubernetes, Docker, and Google Cloud integrations—gives you all the context you need to ensure your containerized applications are running optimally. Head over to our documentation to learn more. If you’re not yet using Datadog, you can get started with a 14-day full-featured free trial.


