

Real User Monitoring (RUM) gives you visibility into the behavior of your users and the performance of your applications. You may already be using RUM monitors to automatically notify your team when the number of RUM events—such as pageviews, clicks, or errors—rises above a threshold you define. Now you can use formulas and functions to create RUM monitors that alert on, for example, deviations in user behaviors such as spending patterns, as well as application performance indicators like rising error rates.
In this post, we’ll show you how you can use formulas and functions in your RUM monitoring to alert on ratios and percentages of user activity as well as comparisons between time periods. First, we’ll take a closer look at how formulas and functions work and how you can use them in your RUM monitors.
Create actionable RUM monitors with formulas and functions
RUM monitors compare a value with a threshold you define, such as a web page’s largest contentful paint (view.largest_contentful_paint) at a threshold of 2.5 seconds. But in many cases, comparing a single RUM datapoint with your threshold can’t fully describe your users’ experience or your application’s performance.
By building RUM monitors that leverage formulas and functions, you can create alerts that trigger on new trends you could not alert on before. For example, you can alert on calculations that bring new meaning to each RUM event by using formulas, such as the average largest contentful paint across all of your pages. You can also alert on the relationship between RUM events by using functions, such as the change in that average from one week to the next.
Formulas
A formula allows you to perform arithmetic on a query result. You can also calculate the sum, difference, average, or other arithmetic operation between two or more queries. This technique allows you to perform useful tasks such as generating a monitor on a percentage or on an average result, allowing you to reduce alert fatigue on monitors that are subject to fluctuation.
Functions
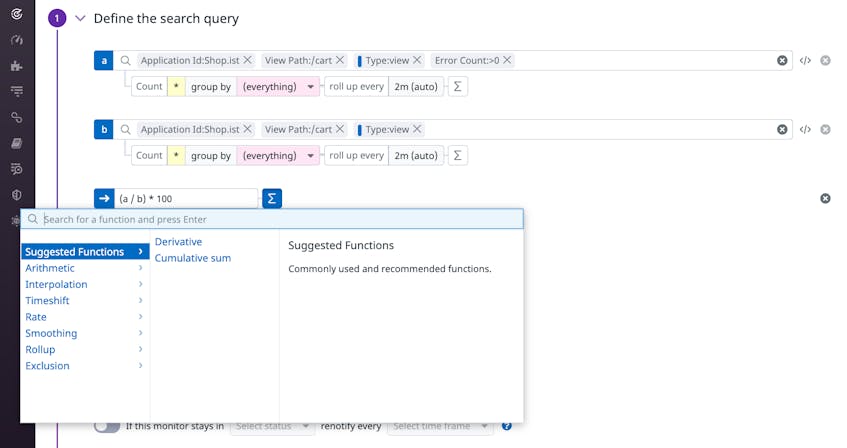
Functions provide higher-level mathematics to help you easily transform the result of your query into actionable insights. For example, you can use the timeshift function to compare a query to the previous day or week to identify newly emerging trends rather than relying on a simple alerting threshold. You can see other examples on the list in our library of functions.
Use formulas and functions to build meaningful monitors
In many cases, such as hourly fluctuations in user traffic, alerting on a single RUM query doesn’t allow you to identify and alert on meaningful changes on your application’s usage and performance. For example, an alert that triggers based on the number of successful checkouts might give you a false positive in the evenings when traffic dips. Formulas and functions help you solve this problem. In this section, we’ll show you examples of RUM monitors that use formulas and functions to give a clearer picture of how users experience your application.
Ratios and percentages
By alerting on your RUM data as a ratio or percentage of overall activity, you can do useful things like normalize the number of visits to a page on your site or the number of frozen frames users have encountered. Ratios and percentages can help you to better understand your RUM data irrespective of raw counts and to alert only when something new is impacting your users, regardless of normal traffic variations.
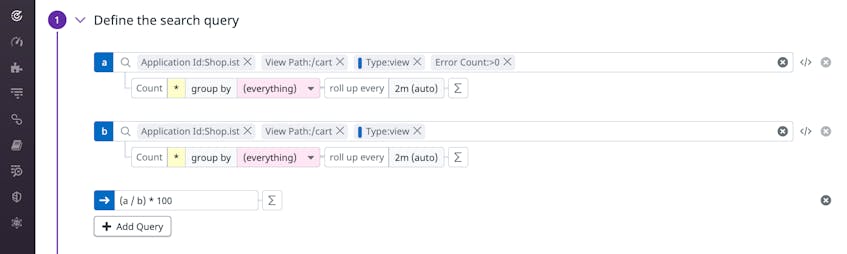
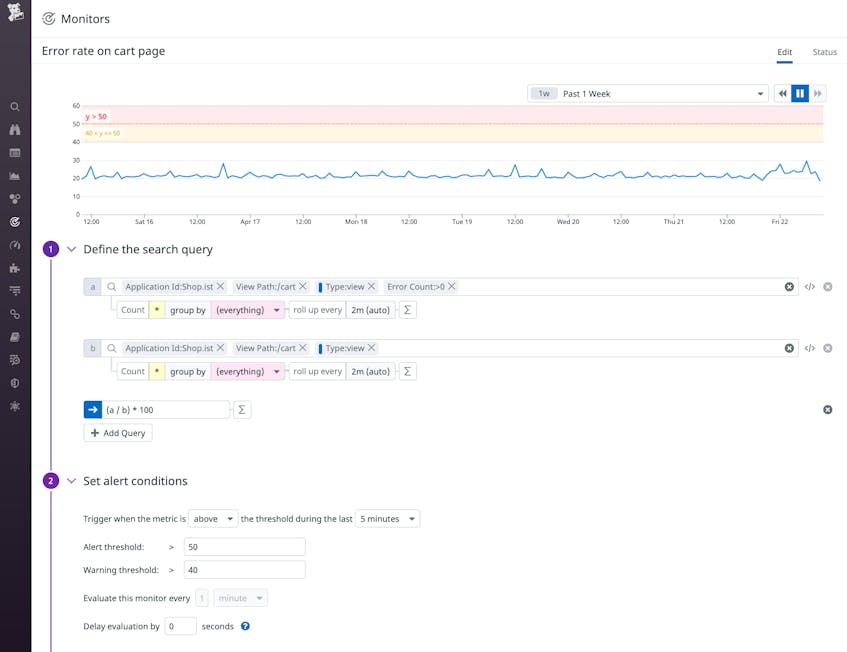
The screenshot below shows a RUM monitor that tracks the rate of errors on the /cart view in the Shop.ist application. One query counts the number of times an error occurs, and a second counts the total number times the view is loaded. The formula divides the result of the first query by the result of the second query and then multiplies that result by 100 to express it as a percentage. By alerting on the percentage of views that result in an error instead of on the number of errors, a monitor like this can more accurately indicate a potential technical issue as opposed to a jump in traffic.
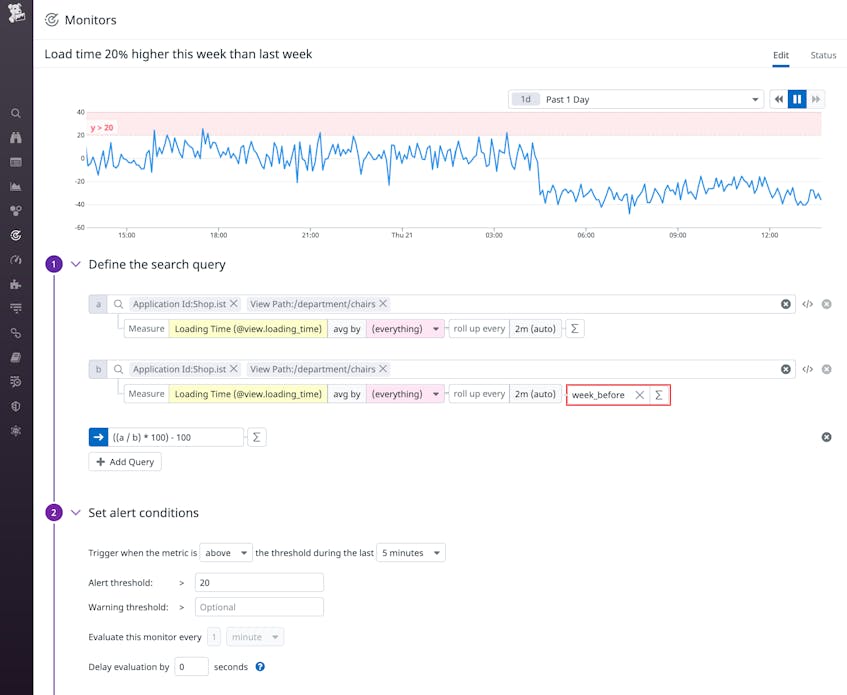
Comparisons to previous time periods
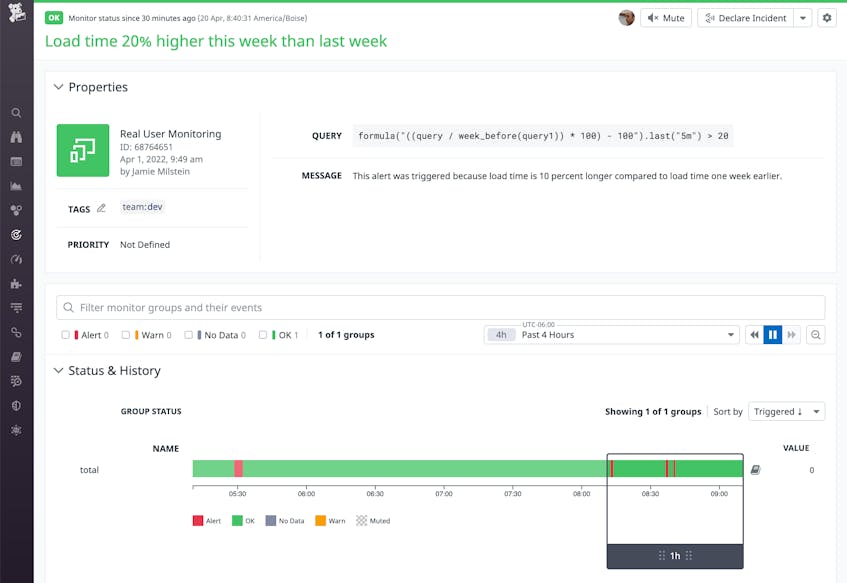
In some cases, you can reduce monitor fatigue by comparing your RUM data to an earlier value and identifying anomalous changes to application performance and behavior. This strategy can help you understand the impact of a change—such as a new version of your application or a marketing campaign aimed at changing user behavior—by comparing the value of the data before and after that change. The screenshot below, for example, shows an alert that will trigger if a page’s load time is 20 percent higher compared to the same page’s load time one week earlier. This alert, if triggered, could indicate that a code deployment or other change has introduced latency.
Incorporate formulas and functions in your RUM monitoring
RUM provides visibility into the health of applications and the behavior of your customers. Formulas and functions let you alert on your RUM data with greater detail, giving your team richer, more actionable alerts. See our documentation for information about how to get started using formulas and functions in your RUM monitors, as well as your dashboards and notebooks. Or if you haven’t started using Datadog yet, sign up for a free 14-day trial.
