David Asker

Clément Acher

David M. Lentz
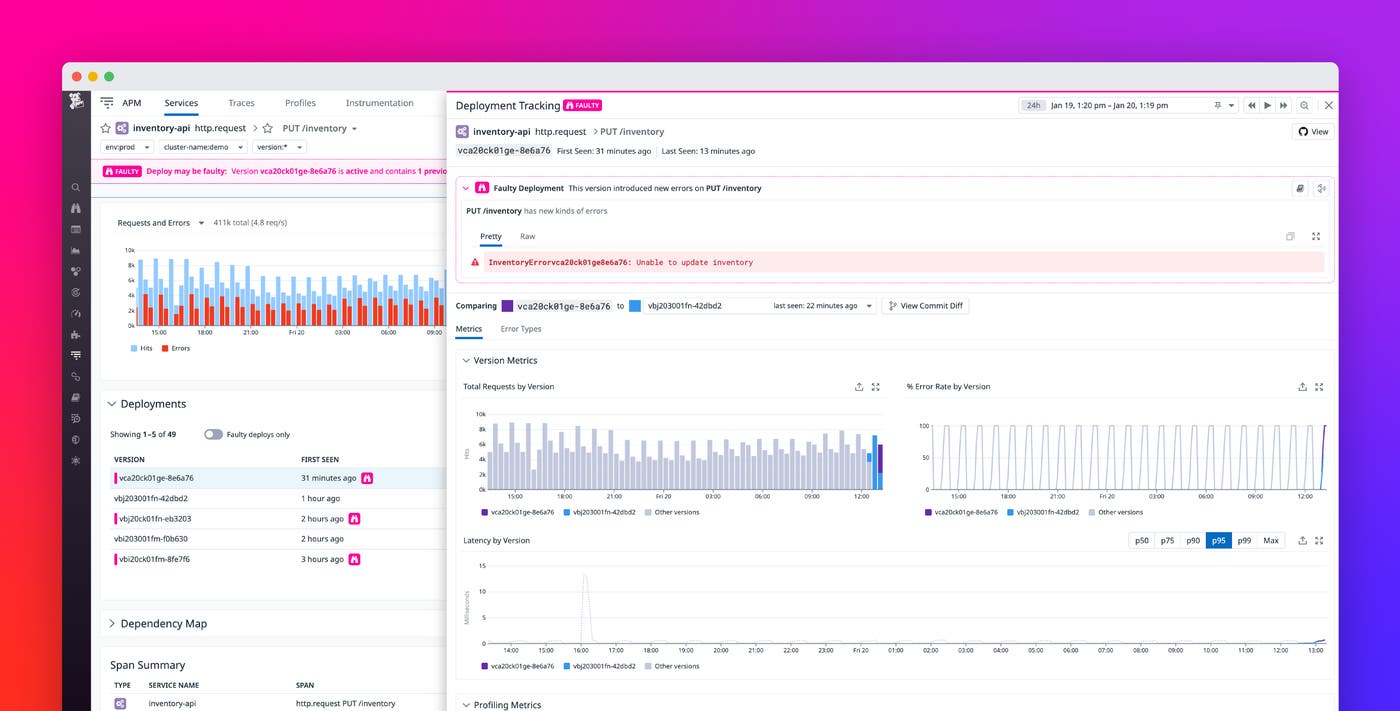
Modern software development teams use CI/CD tools to ship features quickly and rely on best practices like shift-left testing to find application errors before they become user-facing bugs. But you still face the risk that any code you deploy could contain errors that your testing did not surface. To help you deploy with confidence and mitigate the effects of a bad deployment, Datadog APM now provides Automatic Faulty Deployment Detection.
This post will show you how Automatic Faulty Deployment Detection helps you prevent faulty deployments from affecting the performance of your application. We’ll explain how you can:
- Spot a deployment that appears to be faulty (even if the deployment itself didn’t fail)
- Troubleshoot faulty deployments
- Create alerts to notify your team of a faulty deployment
Automatically detect faulty deployments
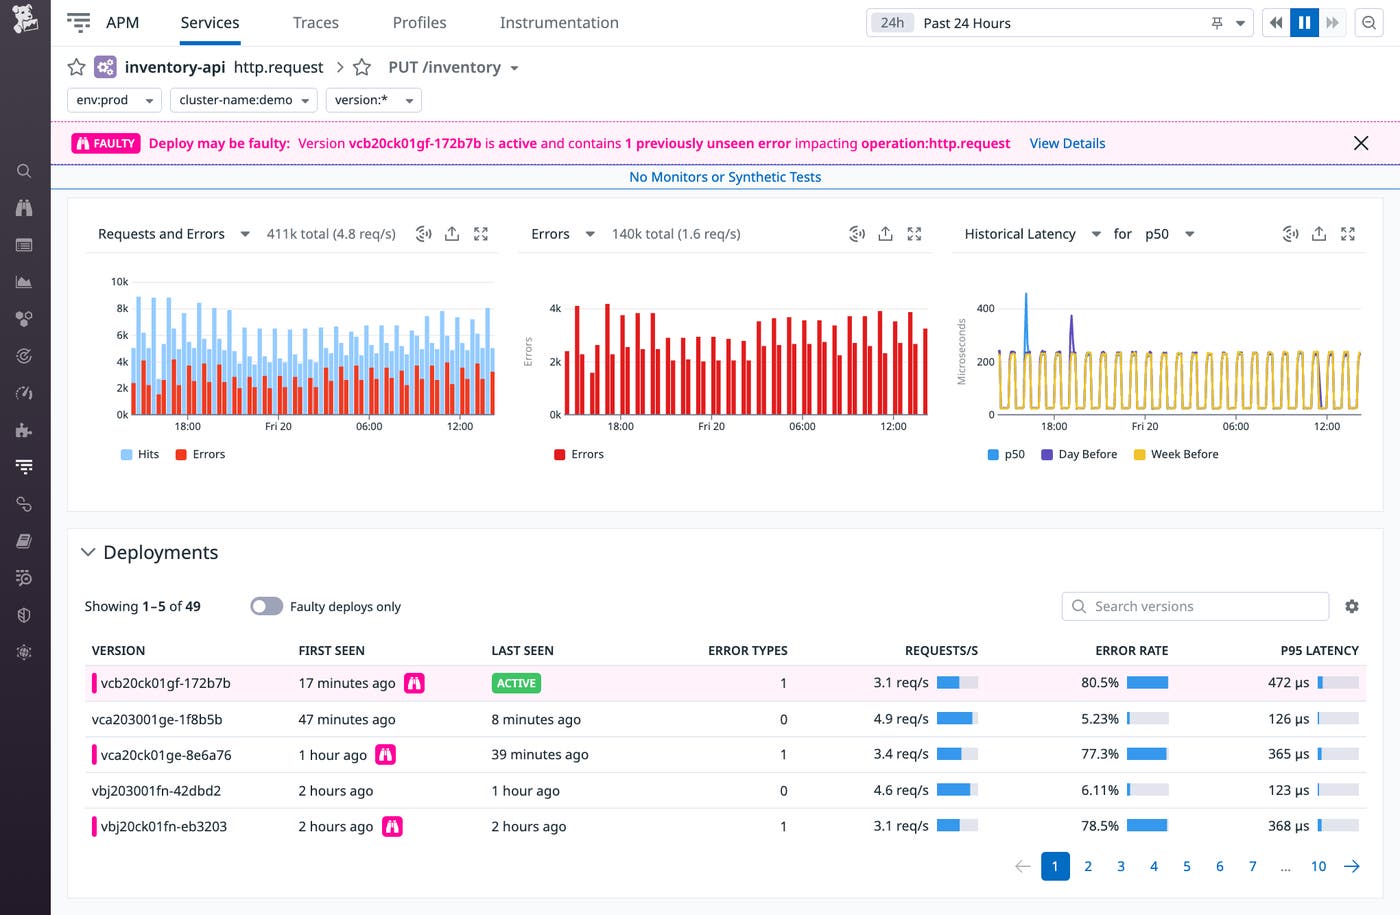
Automatic Faulty Deployment Detection uses Watchdog’s machine learning algorithms to spot faulty deployments within minutes, reducing your mean time to detection (MTTD). As your team continuously deploys code to production, Watchdog compares the performance of each new version of a service with its previous versions to spot new types of errors or increases in error rates introduced in a deployment. If Watchdog determines that a new deployment is faulty, you’ll see details about the affected service in the service-level dashboard, including error types, error rates, request rates, and latency metrics for each version you’ve deployed.
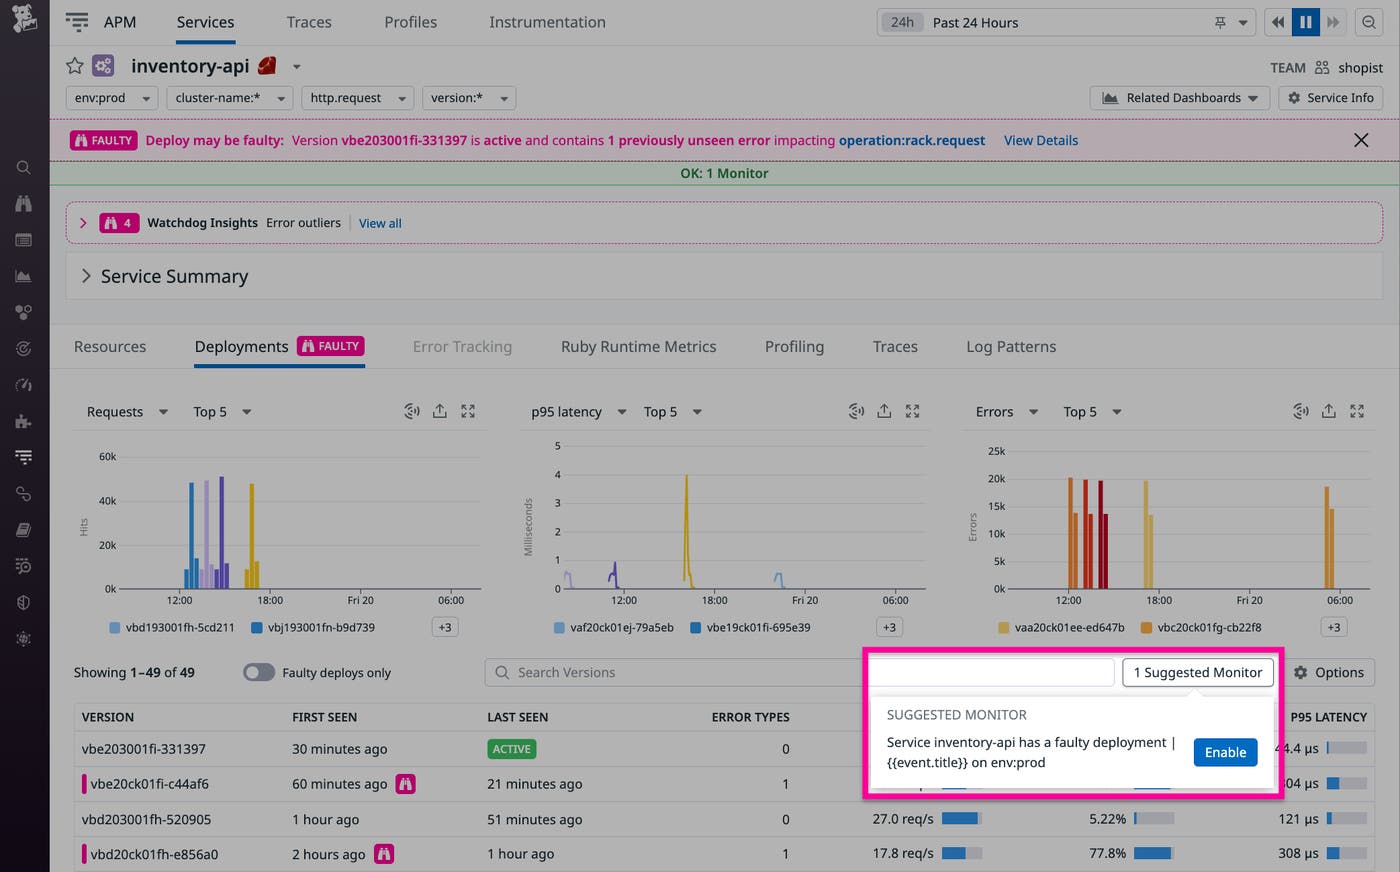
In the screenshot below, the purple banner at the top of the page indicates that the most recent deployment of the inventory-api service may be faulty, and a previously unseen error is affecting this service’s http.request operation. The Deployments table at the bottom of the screen shows a history of the service’s deployments and reports an error rate of 80.5 percent for the most recently deployed version, indicating that you may need to roll back the deployment and investigate the source of the errors.
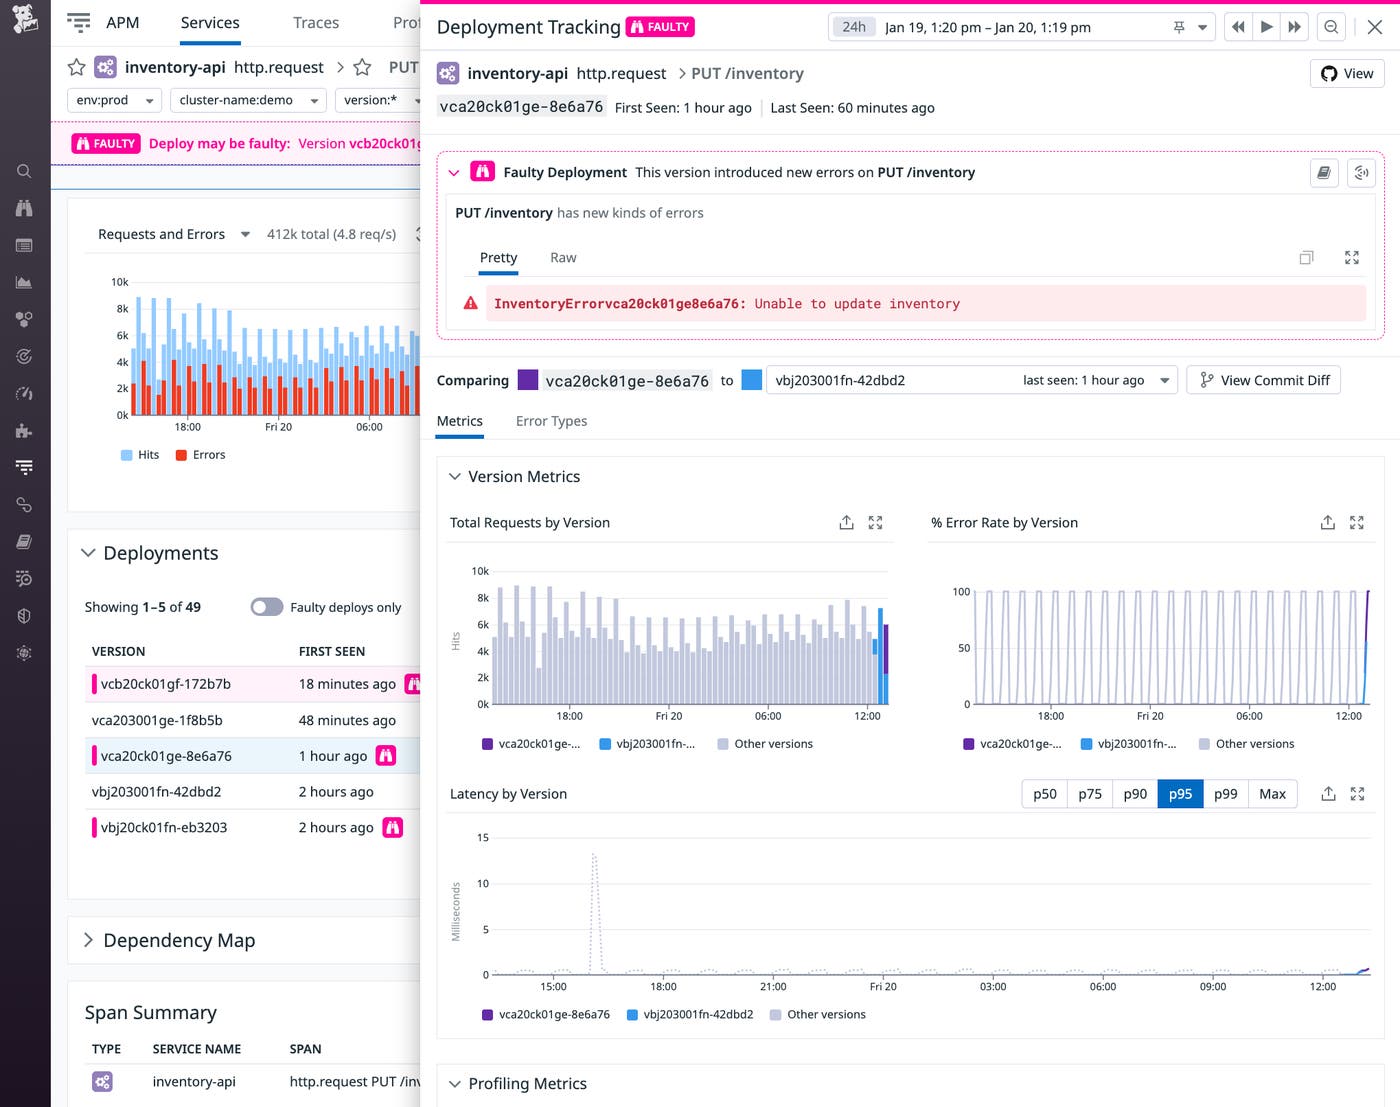
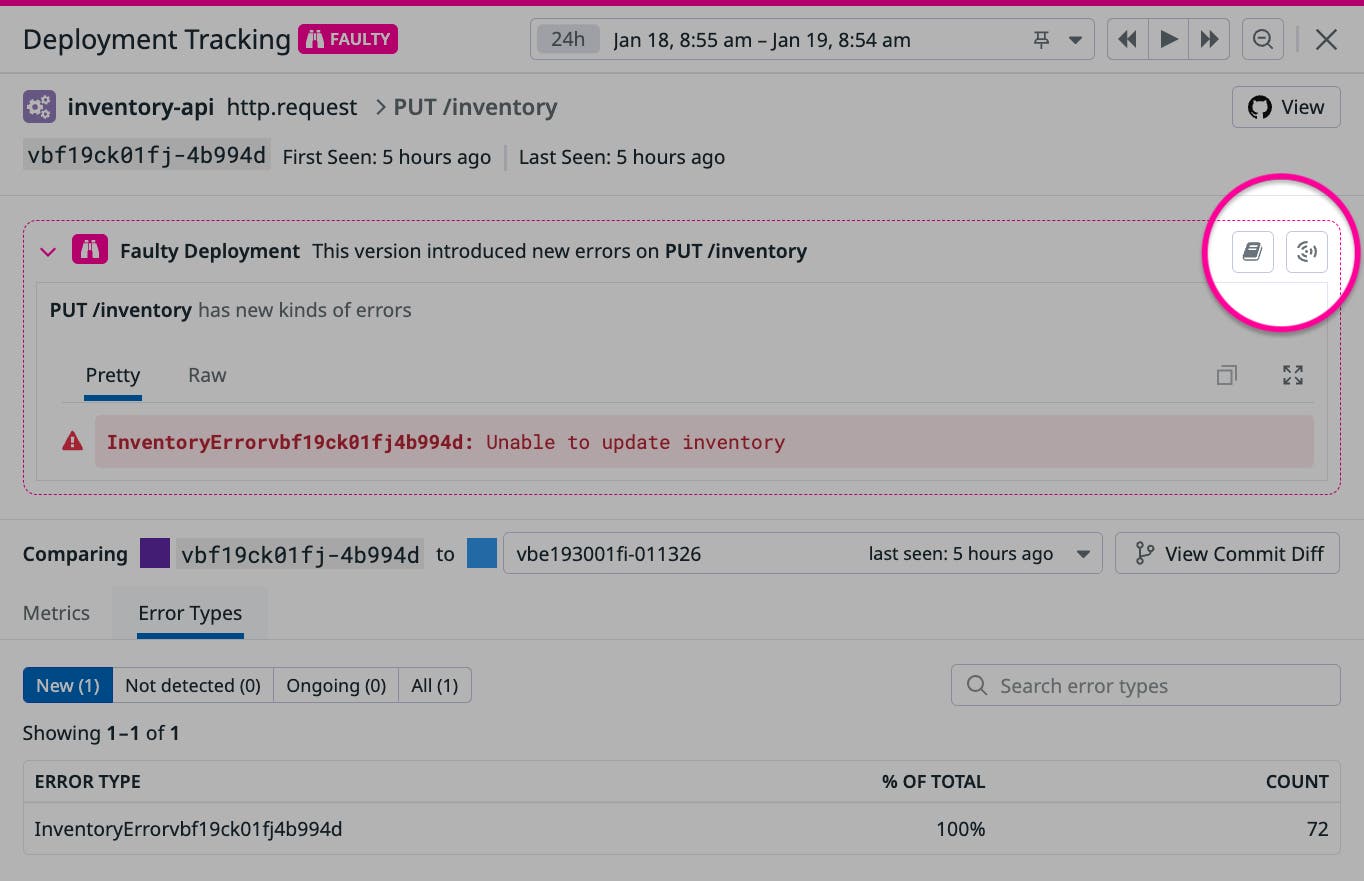
You can click any deployment listed in the Deployments table to open up the Deployment Tracking view, shown in the screenshot below. This view provides details about the faulty deployment, including the new type of error detected and the affected endpoint (/inventory), which can help you understand how the error is affecting your service.
Troubleshoot faulty deployments quickly
When Automatic Faulty Deployment Detection spots an error in a deployment, you can start troubleshooting by exploring the service’s traces, which visualize your application’s activity and surface details that can help you understand the source of the error.
To see the traces for a service affected by a faulty deployment, click the Traces tab on the service-level dashboard or the Error Types table in the Deployment Tracking view.
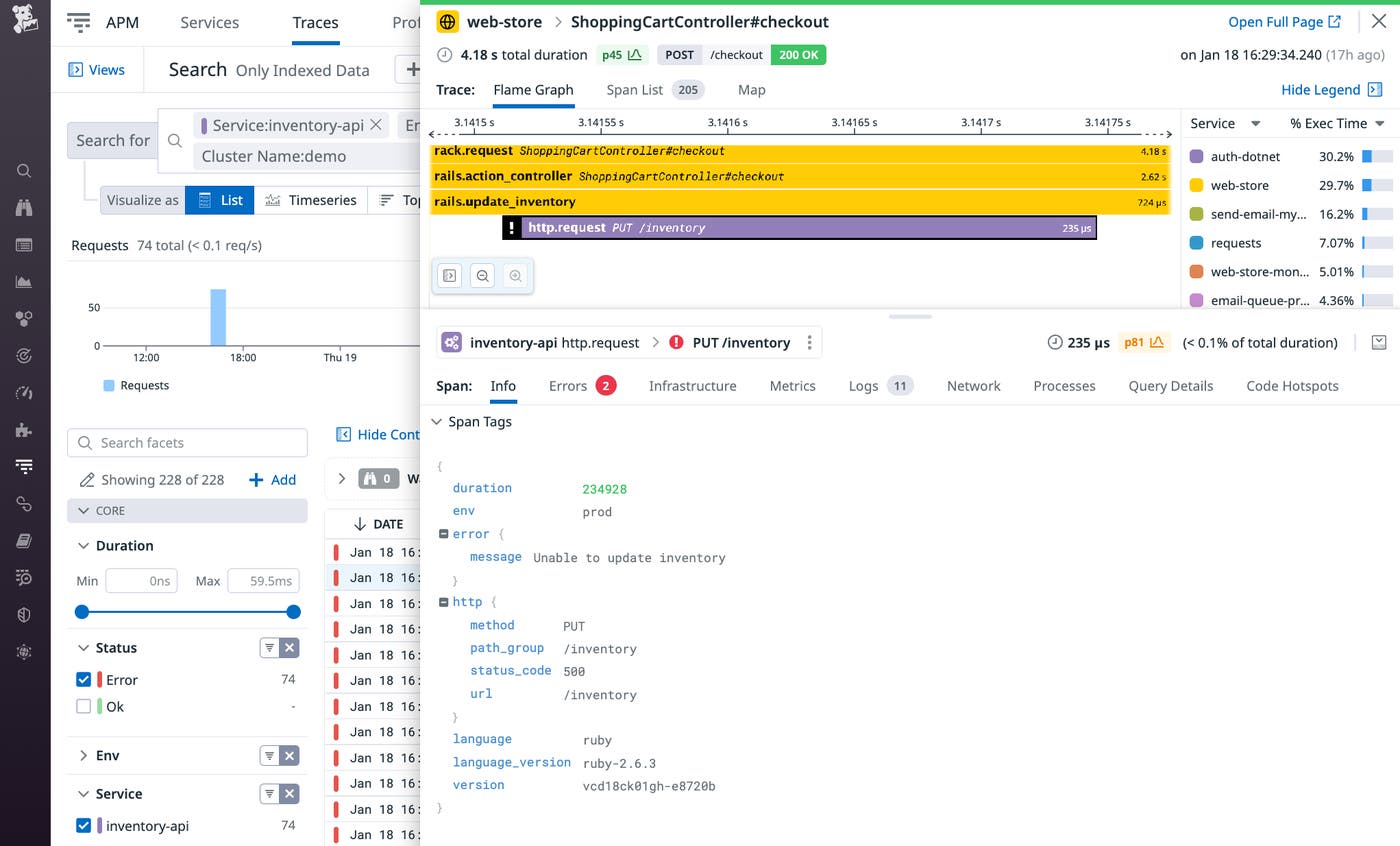
You can view your trace data as a flame graph, which shows the performance of each of your services as your application processes a request. The screenshot below shows a flame graph corresponding to the error shown earlier in the Deployment Tracking view. The 200 OK response at the top indicates that the request was successful overall. But the purple span shows the response from the inventory service, which took 235 microseconds and resulted in a 500 error, whose details are shown in the bottom half of the screen.
As you gain an understanding of the error that was detected in the deployment, you can collaborate with your team to troubleshoot and resolve the issue. You can easily share what you learn by creating a notebook that your team can use to collaborate, or you can declare an incident to initiate your team’s defined process for responding to an error in production. The screenshot below highlights the buttons you can use to start your collaboration with just a single click.
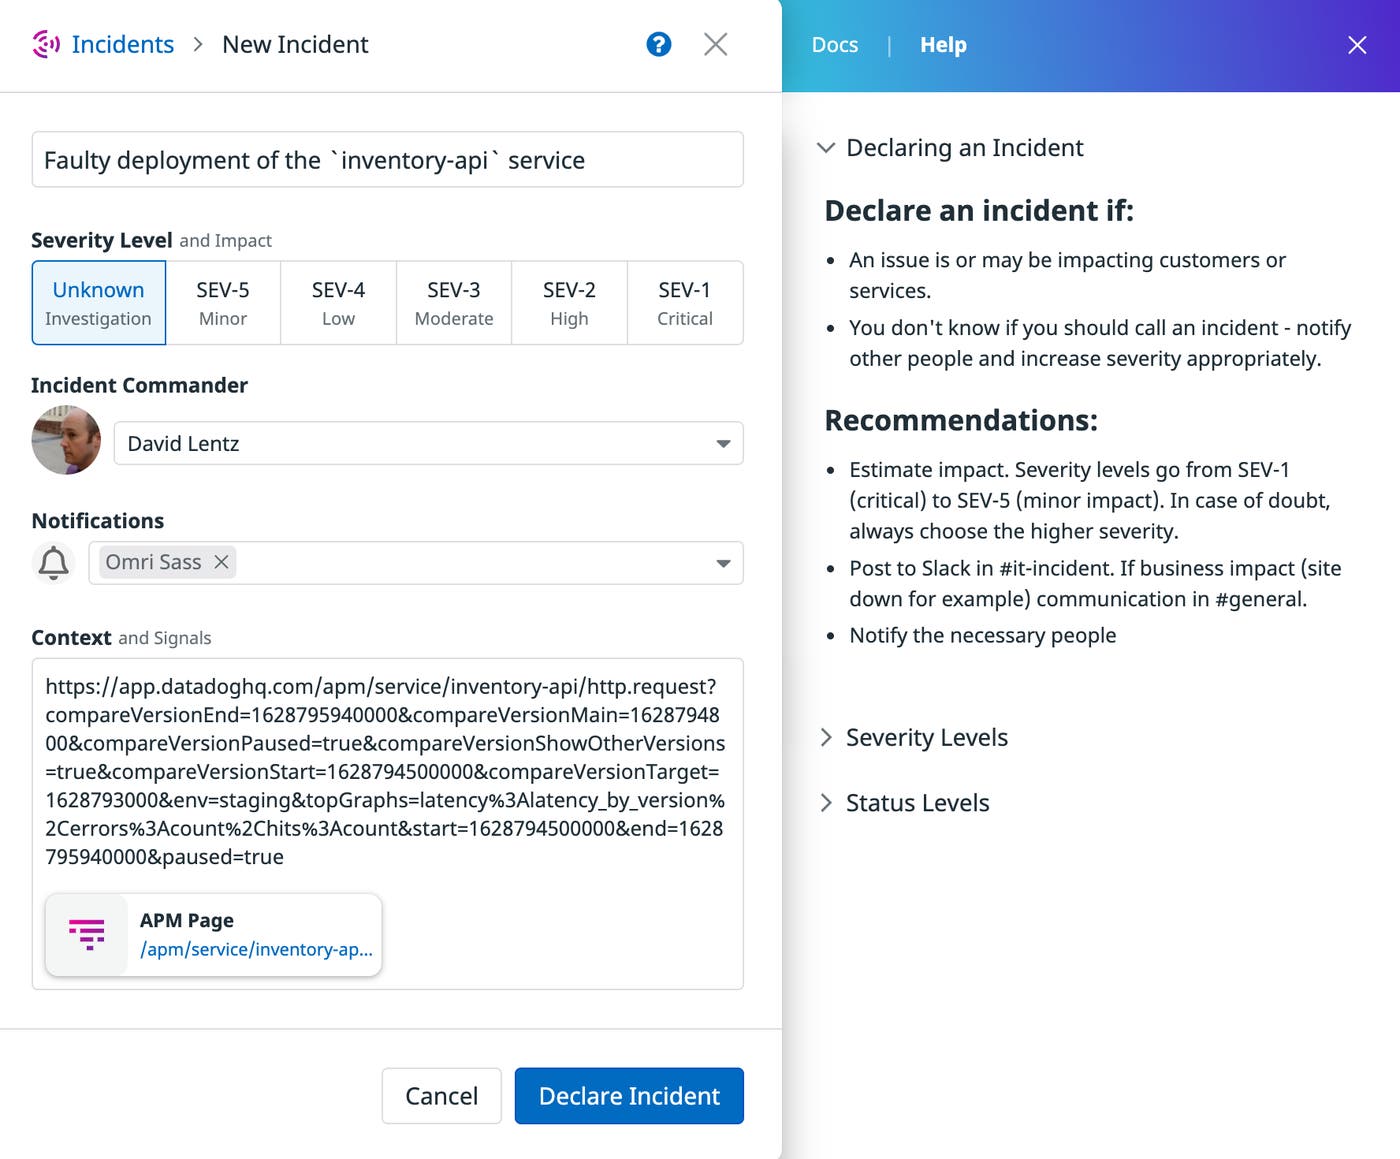
If you click the Create Incident button, Datadog will automatically generate an incident that your team can use to troubleshoot the faulty deployment. The incident automatically includes a link to the relevant service dashboard to provide context that can help collaborators quickly identify and mitigate the impact of the incident.
See the documentation for more information about Datadog Incident Management.
Proactively set alerts to monitor future deployments
To further support your team’s ability to release features rapidly, you can create alerts that automatically page you if a release appears to be faulty. Automatic Faulty Deployment Detection suggests monitors that you can enable with a single click to proactively address any errors that affect your most critical services. These automated alerts can help your team react quickly and mitigate faulty deployments before they degrade your user experience.
In the screenshot below, the inventory-api service dashboard shows a faulty deployment and includes a Suggested Monitors button that allows you to create an alert that will automatically notify you if the same service exhibits new errors or error rate increases in a future deployment. Once you’ve set the alert, Datadog will monitor your deployments so your team can focus on shipping your next release.
Deploy safely with Datadog
Along with best practices like synthetic monitoring and automated CI/CD pipeline testing, Automatic Faulty Deployment Detection can help you maintain both the velocity of your development and the quality of your service. To get started, enable APM and then enable Deployment Tracking by tagging your deployments with a version tag—which may be provided automatically by your CI/CD tool. If you’re not already using Datadog, you can start today with a free 14-day trial.
