

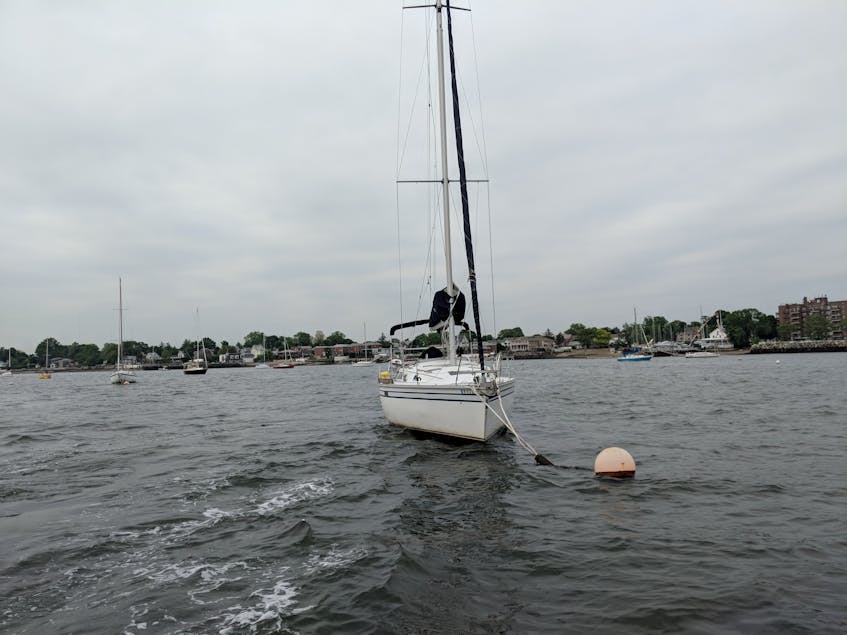
Call me Wouter. I’m originally from the Netherlands, and since May 2019 a Director of Engineering at Datadog. Let me introduce my boat. She’s a 37 ft Hunter Legend from 1992 named Second Wind. Second Wind and I, together with friends, often used to sail the Long Island Sound in New York, and soon she’ll be making a trip down south to New Orleans, since I moved there last year. Since Second Wind is the first boat I ever bought, we’re not only figuring out how to sail better together, but also how the systems onboard work.
Coming from a seafaring country and having been working with data for the last 10 years of my career, it makes for a nice combination.
Every day at Datadog, we spend time thinking about where else we can gather data and metrics. This sort of intense reflection is bound to overflow into our personal lives, and recently, I realized that I could do some really neat data analysis if I started to aggregate and look at data from my sailboat!
When I bought Second Wind in April 2018, she was equipped with some electronics and instruments that help when sailing. At the time, she had a depth sounder for measuring the depth beneath the boat, a speedometer for measuring speed through the water, an autopilot and a chartplotter that shows charts of the seas one sails, and a GPS.
Unfortunately, none of these systems were connected to each other, so there was no way to gather all of the data in a single place. At the same time, I was missing probably the most important thing that you need when sailing: information about the wind. My boat was equipped with a simple wind vane at the top of the mast. I could see what the direction of the wind was by peering up, but I wasn’t able to tell how fast the wind was blowing.
So I set out to make some improvements to my setup.
My goals for Second Wind
I had several goals in mind:
- Connect all of the instruments. This would allow for richer data to help with sailing the boat and with safety.
- Add a device to allow me to see the surrounding vessels. Apart from this being awesome technology, I like to sail as safely as possible.
- Add a wind instrument so I could read the wind speed and wind angle, preferably from the cockpit on an instrument, rather than looking up.
- Gather all of the data from all of the instruments and use this for further analysis to make me a better sailor.
I learned from SeaBits.com, a blog by Steve Mitchell, that there are multiple protocols that instruments can use to talk to each other, but that the world seems to have settled on NMEA 2000. This is a protocol that is comparable to CAN bus, which is used in cars. The idea is that you have a backbone running through your vessel, and you connect devices to this backbone. Instruments communicate with each other at a fairly low speed of 250 kbit/s, but since instruments exchange small messages with one another, the speed is more than adequate for my goals. NMEA 2000 devices all listen to the bus and broadcast their data. The nice thing with the NMEA 2000 is that cables carry both data and power, so there is no need for running multiple cables.
There are multiple vendors of marine equipment, but luckily, most make NMEA 2000 compatible hardware. So I realized that connecting things shouldn’t be an issue, and after reading a ton, I started to work on my first goal: connecting everything together.
Goal 1: Connect all the instruments
The first thing I did was to figure out how everything was connected. I spent a few days upside down in tight spaces tracing wires, trying to make sense of it all. What I found out was that the GPS, the autopilot, and the chartplotter were all nicely connected to each other. However, all of this equipment was made by RayMarine: the cables were not standard NMEA 2000, but are called SeatalkNG. Luckily, SeatalkNG and NMEA 2000 are compatible—the cables and connectors are just a little different. If I had to hook up NMEA 2000 gear later on (which I was sure I would), I could use a cheap adapter cable.
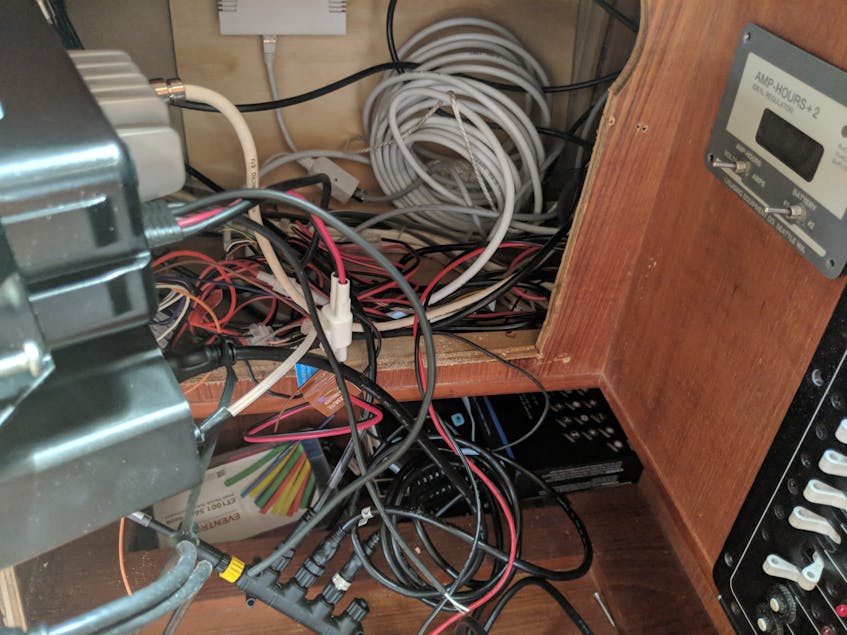
The second thing I found out was that neither the speedometer display nor the depth display were NMEA 2000 compatible. These two instruments were (visibly) older than the chartplotter and autopilot and used the older NMEA 0183 protocol. There were two options: get a converter between NMEA 0183 and NMEA 2000 or buy new instruments. Even though the second option was more expensive, I decided to buy new instruments. It would simplify the setup, and also give a more consistent look across all instruments.
I hooked up the new displays to the NMEA 2000 (or technically the SeatalkNG) bus and saw the data appear on my chartplotter!
Time for the next goal: more safety!
Goal 2: More safety
Safety is always a big concern for me when sailing. After all, when on the water, I’m controlling a machine that weighs several metric tons. During my research, I learned about Automatic Identification Systems (or AIS), which allow for vessels to see each other. The system works by sending small packets of data over VHF radio that contain the name, ID, speed, direction, and coordinates of a vessel. This allows you to see what other vessels are around, but only if they are equipped with AIS as well. Since AIS uses VHF radio, only vessels that are in line of sight will be seen. But it’s better than nothing, and a lot less expensive than buying a radar. Luckily, boats don’t move that fast, so mostly there’s enough time to avoid a collision.
I decided to buy an AIS transponder, install it, and connect it to my backbone. I purchased a device that has a normal NMEA 2000 connector, so it was time for the adapter cable. Hooking this up was easy, apart from the fact that the transponder used its own antenna that I wanted to mount on the back of the boat, while the transponder itself was midship. After a day or so with a piece of metal wire and some twine, I managed to pull the antenna cable through to where I wanted to mount it on the back of the boat. Once I turned on the device, other ships appeared on my chartplotter!
As a bonus, the AIS transponder has an internal GPS module so that it’s not dependent on any external devices, and this data also became available on the NMEA 2000 bus.
With this in place, it was time for the third challenge: getting wind data!
Goal 3: Wind data
As mentioned before, the only data I had about the wind was coming from a wind vane, an analog device at the top of the mast. I had no great way of measuring the speed, which can be dangerous, because you can have too much wind and not trim the sail in the right way.
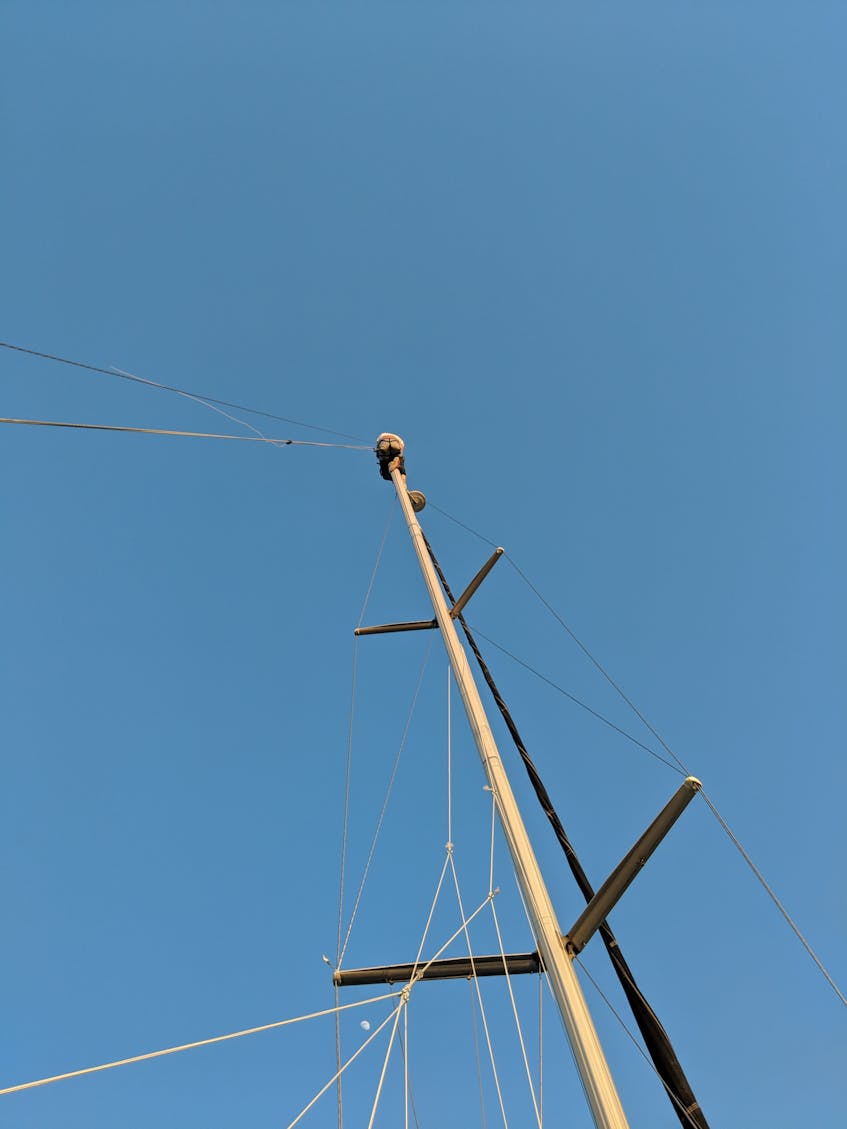
I decided to buy a wind transducer and an instrument for in the cockpit and connect this to the NMEA 2000 bus. The transducer is a sensor that has a little wind vane to measure the wind angle and a rotor to measure the wind speed. Typically, the transducer is placed at the top of the mast.
This posed a challenge.
I’m a big guy and not the most athletic, so I asked a good friend if he could climb up the mast and install the transducer.
To do this, we made a hole in the top of the mast and ran a wire from the transducer down through the mast, where we’d pick up the wire, run it through the boat, and connect it to the display.
I hoisted my brave friend, strapped in a harness, up the mast where he, equipped with an electric drill and a few tools, would install the transducer. We picked a beautiful summer evening with not much wind, so the boat wouldn’t rock too much. But since inch of movement at the waterline is amplified to feet at the top, installing the transponder proved to be too difficult. Erik was a true hero, climbing up 50ft and after trying for an hour, we gave up.
We figured this would be too hard to do while the boat was in the water and I decided that I would wait to install the wind transducer until the boat was on land for the winter. And so, winter came and Second Wind spent time on the hard. As part of inspecting the mast, the mast was lowered, and I asked the person who inspected the mast to install the transducer and run the wire through the mast. Things are sometimes so much easier on land than on the water.
When I started to prepare her for the next season early in the spring, the first thing I wanted to do was to finish my wind setup and finally connect everything up.
For running the actual wires, we started with the transducer cable. This went fairly easy. Since the cable was thicker than the twine, we had to wiggle a bit back and forth, but we managed to get the cable though to where the display was. But for the backbone cable, we weren’t that lucky—the cable got completely stuck. After a new cable, about three hours of trying and retrying and picking a different route, we managed! The cable ran the route I wanted it to and I could finally hook the wind instruments to the NMEA bus.
And it was glorious! Wind information was visible on the chartplotter and on the wind instrument!
Goal 4: Gather all the data
Finally, all the hardware was in place to do the really fun stuff: gathering all of the data from the NMEA2000 backbone! Because power consumption is a concern, I didn’t want to install a power-hungry computer. Instead, I bought a Raspberry PI. I have used Raspberry PIs in previous hobby projects, and since it runs Linux, it’s easy to setup and use.
To be able to read data from the NMEA 2000 bus, I bought a Actisense NMEA 2000 to USB adapter. This device is accessible as a serial port and shows all the NMEA 2000 messages that are on the bus. Luckily the messages are in plain text and easy to decode. Initially, I thought I’d have to decode the messages myself. After some research, I found out that there are a few great open source projects like CANboat and Canboatjs out there that already take care of this.
Signal K
Through reading and searching about marine technology, I understood that a lot of devices currently speak NMEA 2000, but that the protocol and message format is licensed. This means that if you want to make hardware that is NMEA 2000 compatible, you have to acquire a license. I also found out that there is an organization, Signal K, that created an open source and universal marine data exchange format that is built using modern web technologies like JSON, WebSockets, and HTTP. And luckily for me, they have built a server as a reference implementation! This meant that I was able to install the Signal K server on my Raspberry Pi to collect data!
Signal K comes with a whole bunch of plugins that allowed me to read the NMEA 2000 data and do something with it. The first thing I did was to connect OpenCPN, an open source chartplotter to verify that I gathered all of the data. This worked well, but I knew that I wanted to store data for longer periods—preferably not on my boat, but somewhere I could actually analyze the data. This meant that I had to get the data off the Raspberry Pi and store it somewhere else on the internet.
So, the first thing I did was to install a router onboard. I purchased a MikroTek hAP Routerboard that is able to switch between multiple upstream gateways, because I figured I wanted to send data through a mobile LTE connection when I was on the water and over WiFi when I was in the harbor. Then I hooked up my Rasberry Pi to the router and voilà! Internet!
Now the whole chain was pretty much complete: instruments gather data from transducers, send that data over the NMEA 2000 bus, the Raspberry Pi reads the data from the bus and can send it to somewhere on the internet. But where?
Storing and visualizing the data
I had the whole thing working by late spring, and I joined Datadog in May! And what better place to send my data to? I spent some time reading up on Datadog APIs and on how I could integrate Datadog with Signal K. Eventually I created signalk-datadog as an NPM module and Signal K plugin that ties the two together. I decided to directly call the Datadog APIs, rather than using the Datadog Agent, since I wanted to understand how the APIs worked.
The Signal K server listens to all messages that are broadcasted on the NMEA 2000 bus and stores them. Plugins can then either query for that data or can subscribe to a stream of messages and do something with that data.
The Signal K plugin I wrote gathers static data, like the name of the vessel, her draft, length, keel, etc. This is data that never changes, but is regularly output by devices on the NMEA 2000 bus and stored by Signal K. Every 60 seconds the plugin queries for that specific data and sends it to Datadog as logs using the Logs API.
Secondly, the plugin subscribes to a stream of data the Signal K server provides and uploads this data to Datadog. Some data can be expressed as a timeseries (like speed through the water, winds speed, wind angle, depth, water temperature, etc) so the plugin sends this data to Datadog as Metrics. Other data, like GPS coordinates are sent to Datadog as logs.
It turned out to be really easy to write the plugin and to get it all working! And now I have data in a place where I can visualize and analyze it!
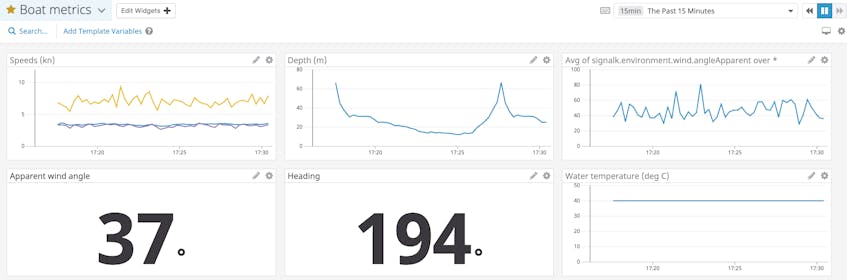
In the screenshot above you can see an example dashboard that shows the speed, depth, wind speed and water temperature as timeseries and the wind angle and heading as gauges.
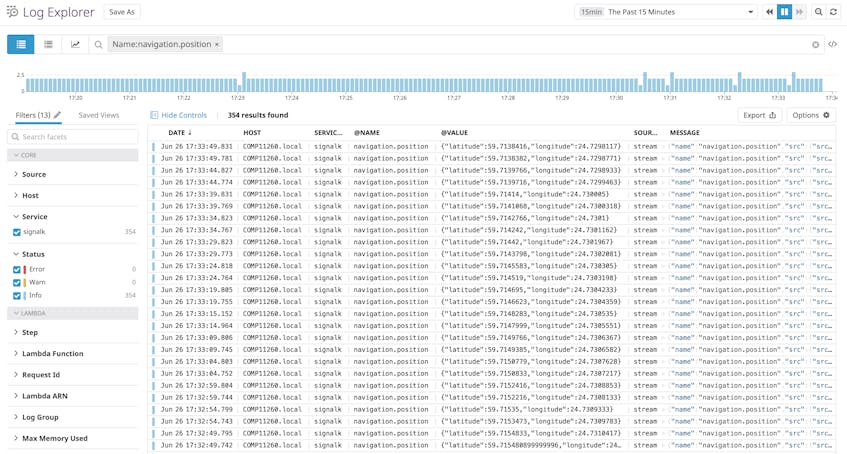
And in the screenshot below you can see GPS data that is captured as logs.
So what’s next?
The act of gathering this data gave me some pretty meaningful insights and ideas. First, I bought an AIS transponder, which has drastically increased my safety and awareness of other ships. But now that I can gather the data sent by the transponder and graph it, I have much better insight into popular times and routes and places to avoid sailing.
Safety is the most significant improvement, but it’s also really nice to keep such careful track of my GPS data. I’ve noticed that I do have favorite routes and spots, and if I do notice something out of the ordinary, I can cross-check and record it - for example, I can see location next to wind speed and take the location of other ships and compare to where I was at the time.
I will continue all of the data I am collecting to see if I can keep finding patterns to drive safety and enjoyment even further.
Next up is sailing Second Wind down to join me in New Orleans!
If you’re someone who enjoys amassing and analyzing data in your hobbies, consider making it a career—Datadog is hiring.
