Employees at all modern software companies use dozens and sometimes hundreds of outside pieces of software to do their jobs and to develop their product. From your company email to the services that you host your product on, to everything in between, most employees log into multiple accounts every day. So how do you keep track of all of these accounts to ensure that your employees are using them securely, make sure that you aren’t overspending on the services, and make sure that bad actors aren’t finding their way into your systems? Doing this process manually can be very difficult and time-intensive, especially when you have an ever-expanding SaaS portfolio. But as things continue to grow, infrequent manual audits do not suffice, and it becomes far more critical to promptly detect, notify, and take remediating action. For example, an unexpected account in your Identity Provider (IdP) could potentially lead to a bad actor accessing sensitive data across your systems. As Datadog continues to grow and have an ever-increasing SaaS footprint, we needed a tool that could perform these audits automatically and regularly.
We decided to build a tool we call “Clarity” that audits accounts in our SaaS applications against Workday, our human resources information system (HRIS) using a mix of technology including AWS Lambda, Slack, Freshservice, and, of course, Datadog. The tool’s primary function is flagging accounts in SaaS applications that do not match an active employee record in Workday. During the audit, we send logs and metrics to Datadog that provide detailed information about each account flagged in an application, including attributes like account name and what application the account was found in. At the end of each run, tickets are generated in Freshservice, and alerts are sent in Slack notifying the appropriate teams of unexpected accounts across SaaS apps with a link to relevant Datadog logs for further inspection.
Requirements
When deciding how to proceed with this project, we needed to define what requirements the tool would need to meet to fulfill our needs. Below are the requirements:
- The tool needed to have a single source of truth to reference when auditing accounts, which, at Datadog, is Workday. Workday has a record for every employee, both current and previous. But if you are trying to implement a similar system, you can fulfill this requirement with any system that contains a record of all employees in your company, such as Okta, Onelogin, or ADP.
- The tool should be able to be run often enough to provide quick and clear visibility into applications.
- The tool should be able to be run manually if needed.
- The tool needs to integrate with our common tooling. At Datadog, this includes Slack, Freshservice, and it needed to dogfood Datadog itself. If you are trying to set up a similar tool, make sure to consider any other communication and ticketing services, like Microsoft Teams or Jira.
Solution Background
Working in an organization that spans across multiple time zones and continents, we are mindful about introducing new tools and technologies and assessing how they will impact the rest of the organization, specifically our IT teams. We want our new systems to be as seamless and unobtrusive as possible when implemented and utilized because this leads to higher adoption rates and less frustration. With this mindset and our previously stated requirements, we decided to build the tool internally by dogfooding the Datadog application. This would accomplish our goals and requirements with the least amount of impact on existing workflows.
Solution
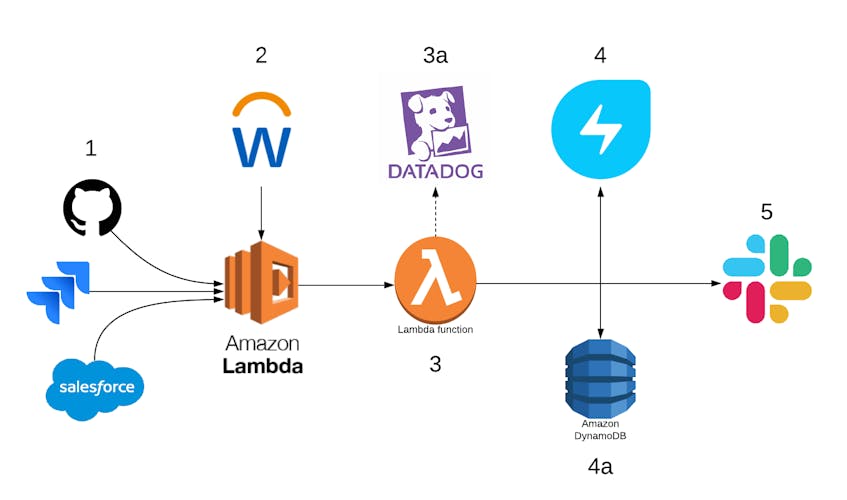
The diagram below illustrates the pipeline we implemented at a high level:
- Generate and retrieve a report of all active users in a SaaS application.
- Generate and retrieve a report of all active Datadog employees from Workday.
- Audit each service for the existence of an account that does not match any active Datadog employee in Workday.
- Send all logs and metrics to Datadog.
- Open a Freshservice ticket for any flagged accounts.
- Add the entry to a DynamoDB table for historical tracking.
- Send notifications via Slack containing an audit summary.
Auditing
Our Clarity audit begins with a Cloudwatch Event Rule that triggers Monday through Friday at 10 am EST. When the Cloudwatch event fires, Clarity concurrently retrieves all active Datadog employees from our HRIS and retrieves a list of all active users in our primary SaaS applications (Slack, Github, Zoom, etc.).
Clarity performs an audit of our primary SaaS applications by checking for the existence of an account that does not match an active Datadog employee. It does this by comparing the list of active user email addresses in each SaaS application against our HRIS (our source of truth for employee data).
Logging and Notification
As Clarity is auditing our SaaS applications, it utilizes some of our already highly used tools to log, track, and notify us of its audit.
Datadog Metrics
Clarity was built from the ground up to use the Datadog platform, specifically Datadog metrics. The flexibility and power of Datadog metrics for alerting and visualization is the driving force behind Clarity.
For every account flagged by Clarity, a metric is sent to Datadog. Sending a metric is simple yet extremely powerful as every metric contains tags that we utilize to send key information back to Datadog. In our case, for every account flagged, we notate which SaaS application the account was flagged in and the primary email address of the account, along with any other relevant information.
We utilize the Datadog metrics API, which allows you to quickly and easily send custom information to your Datadog org. Datadog supports different metric types, such as the gauge metric we use below to track things such as flagged accounts over time.
This is an example of a metric we send (using the Datadog Python SDK):
api.Metric.send(
    metric="datadog.corpit.clarity.account.flagged",
    type=”gauge”,
    points=1,
    tags=[
        "env:prod",
        "team:corpit",
        "service:googleworkspace",
        "user:noreply@acme.org",
    ],
)
The response provides us with the key information we need to investigate and take action on a flagged account, specifically the unique metric name, the environment the run is being conducted in (development or production), and finally, both the service the user was flagged in as well as the user themselves. We also tag our metrics with our team name to allow for easy filtering.
We also use Datadog’s out-of-the-box monitors in conjunction with metrics to alert us promptly on any unexpected behavior. For example, we send a metric any time a ticket is unable to be generated by Clarity:
api.Metric.send(
    metric="datadog.corpit.clarity.ticket.failure",
    type=”count”,
    points=1,
    tags=[
        "env:prod",
        "team:corpit",
        "service:googleworkspace",
        "user:noreply@acme.org",
    ],
)
We use a metric monitor with a low threshold that triggers a Slack message to be sent to the team Ops channel for investigation when one of these metrics is received.
You may notice that the first metric was a “gauge” metric type and the second was a “count” metric type. Datadog has many different metric types, all used for different purposes. You can take a look at the Metric Types page for more information on them.
Datadog Log Management
Clarity also heavily relies on the Datadog Logs product. As Clarity performs the audit, it generates a log for every account in a service, which is then sent to Datadog. By utilizing the Datadog Logs product, we can craft each log to take advantage of search features such as facets. For example, when auditing Google Workspace, Clarity sends additional information such as which organizational unit (OU) the account belongs to within Google and when the account was created. Log Facets allow us to quickly filter logs by fields such as service, user, or application-specific fields, including the organizational unit field as mentioned above.
An example of a log could look like this:
[WARNING] Found account=noreply@acme.org in service_name=googleworkspace and OU='/Email-only accounts' with creation_date='2018-12-28T17:21:56.000Z' and match=False for user in Workday
The response gives us this information:
- The account name found:
noreply@acme.org- In this case, the
accountvalue matches the email found in Google Workspace, but depending on the service, this might be a username or UUID, whichever is applicable.
- In this case, the
- What service the account was found in: Google Workspace
- What OU the account belongs to within Google Workspace:
/Email-only accounts- Adding this additional and service-relevant metadata can quickly help when trying to identify what the purpose of the account is. If, in our case, the OU suggested something along the lines of
/Dev Platform Team, we may be able to more quickly reach out to colleagues with context from that team.
- Adding this additional and service-relevant metadata can quickly help when trying to identify what the purpose of the account is. If, in our case, the OU suggested something along the lines of
- When the account was created in the service:
2018-12-28T17:21:56.000Z- Having this additional context can help you quickly narrow down who may have created an account and for what purpose. Additionally, if you’ve never performed an account audit in the service before, and an unrecognized account is flagged, you can quickly get a sense of how long the account may have existed to understand potential investigation scope.
Again, using the Log Facets mentioned above (denoted by key-value pairs separated by the equals (=) sign), we can view and sort logs in Datadog:
Datadog Dashboards
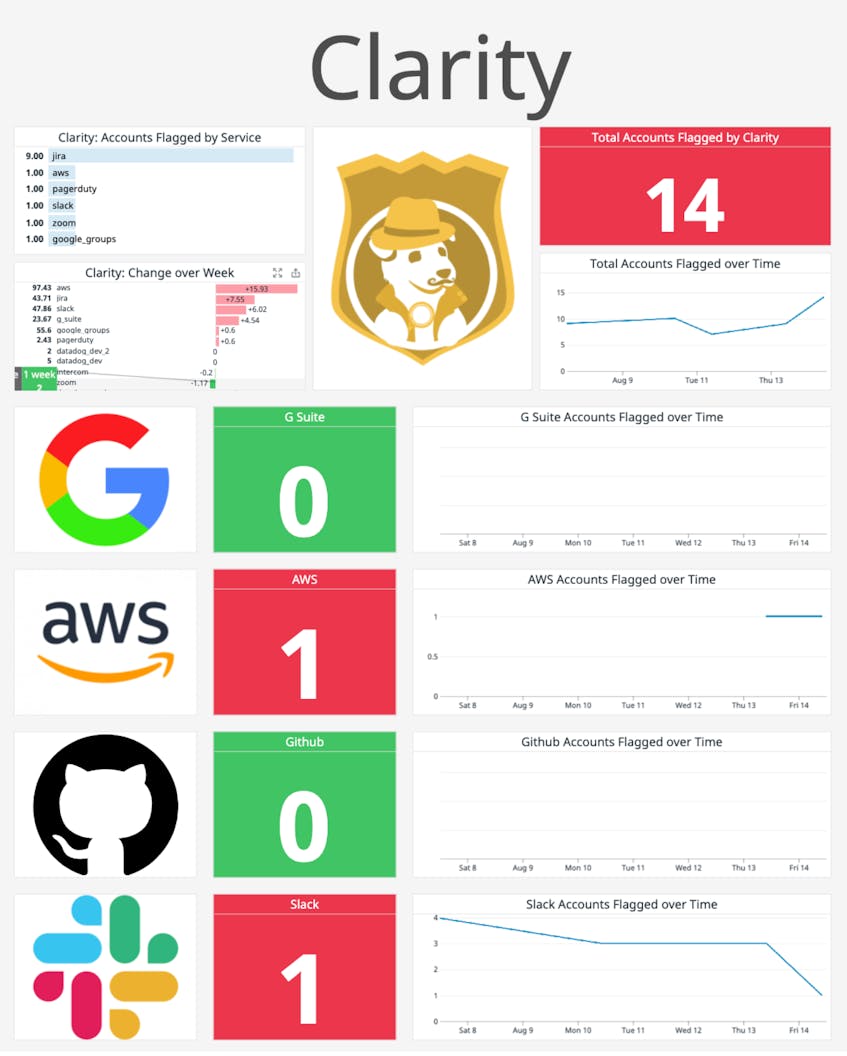
Another feature of Datadog that makes Clarity powerful is Datadog Dashboards. We use dashboards to visualize the metrics we send from Clarity to offer a quick insight into trends or provide a high-level view into our current account recertification status. We create widgets to visualize information such as:
- How many total accounts were flagged among all services audited
- How many total accounts were flagged within a specific service
- Number of accounts found in a service over time, which provides historical context to a service’s alignment with your employee source of truth
A sample Clarity Dashboard looks like this:
Notifications
Being notified promptly and through a highly visible medium was another important factor we considered when building this tool. Remember, our philosophy throughout the process was to focus on seamless integration with existing tools and ease of use for our global IT teams. Since Slack is a part of the daily workflow of everyone at Datadog, we built Clarity to directly interface with the Slack API for sending notifications by using their Block kit framework. Other tools that have an API, such as Microsoft Teams or Discord, would work just as well.
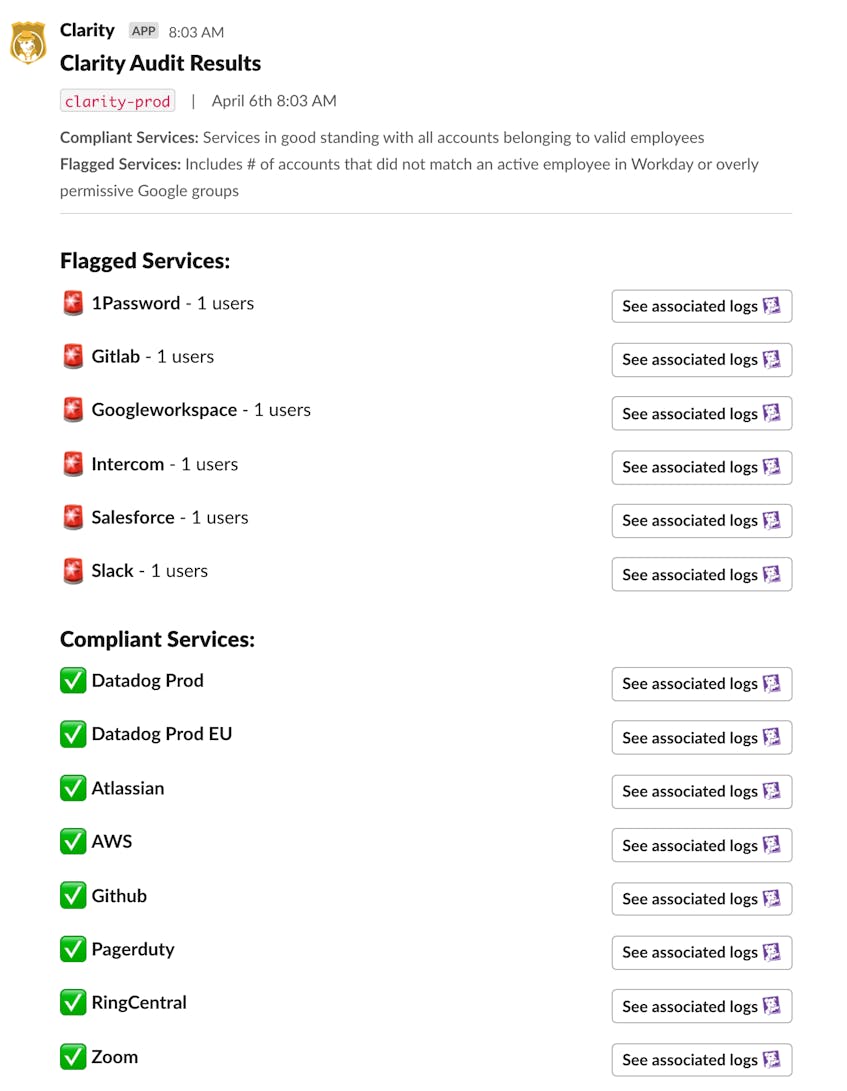
Clarity sends notifications via Slack for every application it audits, notating key information such as if any unexpected accounts were found or if the application came back clean. Within the Slack notification, a button links directly to the Datadog logs, which are prefiltered to only show the flagged accounts in the respective application. This allows for a quick and seamless transition from receiving the notification to beginning the investigation using the relevant logs.
An example of the Clarity Slack notifications:
Taking Action
Keeping our philosophy of seamless integration and ease of use in mind, we worked to create a system that would allow our teams to take action on flagged accounts as part of their normal workflow. While Slack is our primary communication and alerting tool and provides the “at a glance” insight, we use Freshservice as our internal ticketing system for tracking and auditing work. Any other ticketing system that has an appropriate API, such as Jira or Zendesk, could be utilized as well. Every time Clarity flags an account, it automatically generates a ticket in Freshservice with key information such as the email address of the account flagged, the application the account was flagged in, and any other relevant application-specific attributes. This allows us to keep track of all flagged accounts in an auditable system, make sure that no flagged account “falls through the cracks”, and applies the team’s existing Service Level Objectives (SLOs) for responding to tickets.
Historical Records and Audits
Since we are using AWS Lambda to run Clarity, we implemented DynamoDB to add stateful tracking of flagged accounts between runs. The DynamoDB table tracks all accounts flagged per application, when they were flagged, and relevant metadata about the generated Freshservice ticket. The ticket metadata includes when the ticket was created and a direct link to the ticket. This allows us to keep a historical record of all accounts flagged in an application, even after resolving the issue. Using the DynamoDB table also allows us to generate a new ticket if an account is still flagged in an application after the SLA deadline has passed.
Next Steps
As we look forward, we hope to expand this tool from purely a snapshot of “What accounts exist in an application right now?” to “Are the accounts that exist in an application being utilized?” through usage monitoring. This will allow us to optimize our SaaS spend even further by reducing licenses consumed by active employees who no longer need access to an application. It also expands our model of least privilege beyond the permissions within a SaaS application to the access of the application itself.
SaaS applications are heavily utilized in many organizations. The reliance on these applications and the value of being able to make data-driven decisions with them is now of critical importance, especially within IT teams. Datadog is built for cloud infrastructure monitoring with tools like metrics, alerting, and dashboards. IT teams can use Datadog to help manage and monitor tooling such as their SaaS applications and reduce their team’s workload.


