Christian Mauduit

Corentin Dancette
Datadog recently held an internal hackathon. We run these about twice a year across the organization. Each team hacks on the project of their choice for 2 days. Projects vary from process improvement, to new feature ideas, or just plain old fun hacks.
At Datadog we see and gather metrics everywhere by using Datadog to monitor our applications and infrastructure. So our team thought it’d be fun to come up with creative solutions to “where can we display metrics?”.
We decided to see if we could build a way to display Datadog graphs and dashboards inside the world of Minecraft. We know engineers are often gamers too, and while we do not expect our customers to monitor their production environments in Minecraft, we thought showing metrics inside the game world might help you get more game time while on-call.
Our goal with this was:
- Programmatically access Minecraft elements. More precisely being able to create, remove and query information about blocks.
- Programmatically retrieve real-time data from Datadog.
- Glue it all together to read data from Datadog and pump it into Minecraft.
Control Minecraft
The first step was to control Minecraft via Python. We picked Python because we use it heavily at Datadog and are familiar with the language. It also has lots of existing libraries and documentation to make Minecraft interactions straightforward. One way to do this was to use Raspberry Juice, which implements a subset of the Minecraft API; and PI Edition, a Minecraft server for Raspberry PI. We set this up on our laptops rather than installing dedicated PI boxes for this hack as it offered improved build times and performance. Once we had set up a dedicated server using Raspberry Juice, we simply had to import the Python library py3minepi and we were all set with a development environment.
Interacting with this environment (creating blocks) via Python code was as simple as:
import mcpi.minecraft as minecraftimport mcpi.block as blockmc = minecraft.Minecraft.create("127.0.0.1")mc.setBlock(10, 10, 10, block.STONE.id)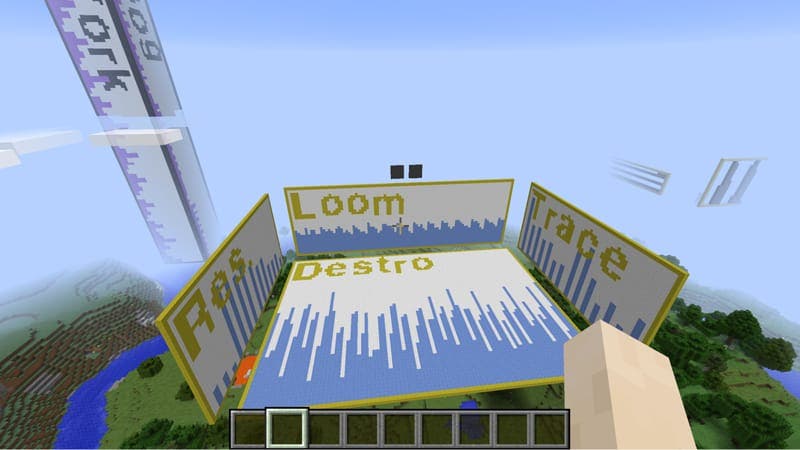
Once you can do this, you can do anything… The power of Python unleashed in Minecraft.
Access Datadog data
To access data from Datadog we installed the Datadog Python library and followed the API reference.
from datadog import initialize, apiImport time
options = { 'api_key':'01234abc01234abc', 'app_key':'0123456789abcdef0123456789abcdef'}
initialize(**options)now = int(time.time())data = datadog.api.Metric.query(start=now - 300, end=now, query="avg:system.cpu.idle{*}")Once we were able to both query data and draw objects, it was rather trivial to integrate the two pieces. We also started to implement some monitors, which would shine red when in alert mode, and resume to green in normal mode.
Challenges
Configuration
We rapidly found out we would need to describe our world with configuration files rather than rely on data mixed in function calls. So we set up some basic YAML files containing information such as:
- Where a graph should be (size, position, orientation, …)
- How a graph should look (colors, transparency, …)
- What data it should display (metrics to get, time span, …)
Here is a sample YAML configuration file, representing a dashboard with CPU usage and a monitor alert :
- graph2: type: wall query: "avg:system.cpu.idle{*}" pos1: x: 81 y: 40 z: 170 pos2: x: 92 y: 55 z: 170 layout: "xy" border: true
- monitor_status: type: monitor_status monitor_id: 660012 pos1: x: 81 y: 56 z: 170 pos2: x: 86 y: 61 z: 170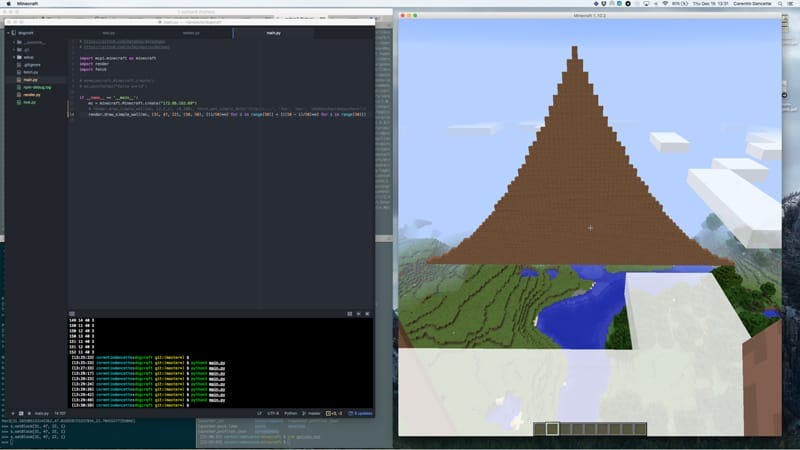
A complete dashboard, displaying several metrics, the two dark squares represent monitors. Everything is updated in real-time.
Persistence
Another problem was that Minecraft is by nature persistent. That is once you create an object it lives on. Our graphs on the other hand change frequently as the data changes. More challenges was that as we iterated on the project our failed attempts to make graphs would populate the world with random cubes and and be cumbersome to navigate or clean up. To ease this pain we wrote vacuum functions to clean anything we drew.
Displaying data
It feels awkward to draw graphs without being able to rely on JS and CSS as we do on the web. However as long as the data could be simplified to “one row of data”, we were able to build methods that would display the metrics from Datadog in a reasonably viewable manner. At some point, displaying large graphs would saturate the data pipeline, so we had to implement caching to save bandwidth. Interestingly enough, implement caching, saving bandwidth, is typically what we do in our daily job, as engineering for performance is commonplace at Datadog.
How fun was this?
The first four hours were spent trying to set up the environment, and connecting various components together. It has the charm of random hacking – trying to find your way in technologies you usually ignore (ie Minecraft). Which is fun. Then we had up to 20 hours to play around like kids, build walls, view them, explore, destroy, rebuild, and try again. Is there anything more enjoyable than hacking for pure fun?
See it in action!
To view your own metrics in Minecraft, fork the repository on Github.
Want to join us for our next hackathon? Datadog is hiring! Learn more on our careers site or email us a description of your favorite hackathon project.
