
Laurent Bernaille

David Lentz
This story began when a routine update to one of our critical services caused a rise in errors. It looked like a simple issue—logs pointed to DNS and our metrics indicated that the impact to users was very low. But weeks later, our engineers were still puzzling over dropped packets, looking for clues in kernel code, and exploring the complexities of Kubernetes networking and gRPC client reconnect algorithms. However, no single team was able to fully understand the issue from their vantage point.
In this post, we’ll tell the story of how we investigated and ultimately resolved this incident. And we’ll share some of the knowledge we gained along the way, including:
- Sometimes it’s actually not DNS (even when it really looks like it)
- AWS ENA metrics and VPC Flow Logs provide important visibility into connection tracking
- Cilium, Kubernetes, and AWS networking interact in elaborate ways
- Sometimes reverse path filtering considers packets as Martian when it shouldn’t
- DNS propagation time is influenced by many factors
It looks like DNS
Beginning in September 2021, we saw increased errors when we rolled out updates to our metrics query service, which is responsible for retrieving real-time and historical metric data from our data stores. It makes these metrics available to multiple clients, including our frontend web application and monitor evaluation clients, which use that data to determine whether to alert.

Clients automatically retry failed queries, so user-facing errors were minimized. But the retries introduced latency that affected the performance of dashboards and monitors.

The service’s logs showed us that DNS errors were preventing it from connecting to its dependencies—the data stores that hold our metric data. With this information, our next move was to investigate DNS activity inside the Kubernetes cluster where the service was hosted.
NodeLocal DNSCache reaches its concurrency limit
We use NodeLocal DNSCache in our infrastructure to improve performance by having a local DNS cache on every node. NodeLocal DNSCache is deployed as a DaemonSet—named node-local-dns—that runs a slimmed-down version of CoreDNS.
We saw that the node-local-dns pods were experiencing OOM errors. They were configured with a 64 MB memory limit and a max_concurrent parameter that limits them to processing 1,000 concurrent requests. We confirmed that—as expected—they were rejecting requests above that concurrency limit during rollouts.

We knew from the OOM errors that 64 MB of memory was not enough to support our caches plus 1,000 concurrent requests, so we increased the pods’ memory allocation to 256 MB. Although this stopped the OOM errors, the DNS errors persisted.
It was also unclear why node-local-dns was even reaching its limit of 1,000 concurrent requests. We expect it to process each query in about 5 ms or less, so even with a 0 percent cache hit rate, it should support at least 200,000 queries per second. The service’s request rate was mostly around only 400 queries per second. This increased to nearly 2,000 during rollouts, but remained far below its expected capacity.

At this point, we knew that rollouts of the service caused errors which increased user-facing latency, and that DNS failures were causing those errors. We looked at node-local-dns metrics and discovered that the local DNS cache was marking upstream DNS resolvers as unhealthy.

Each request that node-local-dns forwards upstream consumes a slot that counts toward the max_concurrent limit. Node-local-dns establishes TCP connections to upstream resolvers and reuses these connections until they expire (after 10 seconds, by default). Health check failures likely indicated that node-local-dns could not establish connections to these upstreams, which would also explain why we were reaching the max_concurrent limit: the forward plugin has a 5-second timeout to get an answer from upstreams so if it can not connect to them, we reach the limit with only 200 queries per second.
We began to wonder if this could be network related. We confirmed that we were well below the 5-Gbps maximum sustained throughput capacity of the instance types we were using, but we did see a rise in TCP retransmits correlated with the rollouts.


The increase in TCP retransmits indicated that packets were being lost, most likely due to network saturation. We suspected that microbursts of data—traffic spikes too brief to register on the throughput graph—were causing brief bottlenecks, so we expanded our investigation to include additional networking-related metrics from AWS.
AWS VPC connection tracking leads to dropped packets
Before we rolled out the next update of the metrics query service, we enabled Elastic Network Adapter (ENA) metrics on the Datadog Agent to gain deeper visibility into network performance. Some of these ENA metrics, like bandwidth and throughput, didn’t show any issues that correlated with the rollouts. However, we did spot an increase in a metric named conntrack_allowance_exceeded that looked significant.

This metric tracks the number of packets that get dropped when the VPC’s connection tracking (conntrack) mechanism becomes saturated. Conntrack keeps tabs on the status of network traffic to and from the host and allows for network features like the stateful packet filtering used in EC2 security groups. Each conntrack table entry represents a connection—a flow of related packets. Conntrack updates each connection’s status in the table as the flow continues, and then removes connections once they have timed out or completed. The conntrack table sets an upper limit on the number of entries it can support. Once the table is full, the host can’t create any additional connections.
Connection tracking on these instances takes place in two separate conntrack tables: the VPC conntrack—which is a per instance conntrack maintained at the hypervisor level—and the Linux conntrack within each instance.
We were surprised when the ENA metrics showed us that the VPC conntrack was saturated, because we could see that the number of connections in the Linux conntrack—shown below—was relatively low. We’d seen instances manage hundreds of thousands of connections without any issues, but during these rollouts, connection counts were peaking below 60,000.

We opened a case with AWS support, who confirmed that the capacity of the Linux conntrack varies by instance type, and that the maximum number of entries for the VPC conntrack was much higher than we were observing in the Linux conntrack. This made little sense to us at that point: we were saturating the VPC conntrack but the Linux conntrack showed a number of entries it should have easily managed. We decided to test larger instance types—which, according to AWS, could track more connections—and we verified that we could resolve this issue simply by scaling up the service’s infrastructure. But we wanted to understand why the table was full so that we could find a more sustainable and cost-efficient path forward.
We needed to know more about the service’s network patterns to understand why the conntrack was filling up, so we started looking at Amazon VPC Flow Logs.
VPC Flow Logs shed light on a full conntrack
VPC Flow Logs are an extremely useful tool for monitoring low-level networking behaviors. In this case, they revealed some key information about the metrics query service’s traffic.
When we rolled out another update of the service, we analyzed VPC Flow Logs to see the volume of traffic to and from each pod as it got replaced by a new one. We saw that after a pod had been deleted, metrics query clients were still trying to connect to its old IP address. We expected only a few connection attempts during the short period of time before clients knew that the old pod was no longer available.
To learn more, we aggregated our VPC Flow Logs by TCP flag to see the types of traffic coming in. The graph below shows ingress traffic to a single old IP address. The blue line shows a steady rate of long-lived connections that were established prior to the rollout. The red line shows FIN requests coming from clients—as expected—when gRPC gracefully shuts down the connection. The yellow line shows that, at the start of the rollout, clients generated a very high rate of SYN packets trying to establish communication with the service’s hosts. Based on the source IP addresses we saw in the VPC Flow Logs, we knew that these connection requests were coming from a subset of clients, specifically clients responsible for evaluating metric data. We expected to see a proportional increase in RST packets, which indicate that the host will not accept the connection request. But instead—surprisingly—we saw that the SYN packets were unanswered. This data showed us that a single old IP address received ~90,000 connection attempts in about 90 seconds.
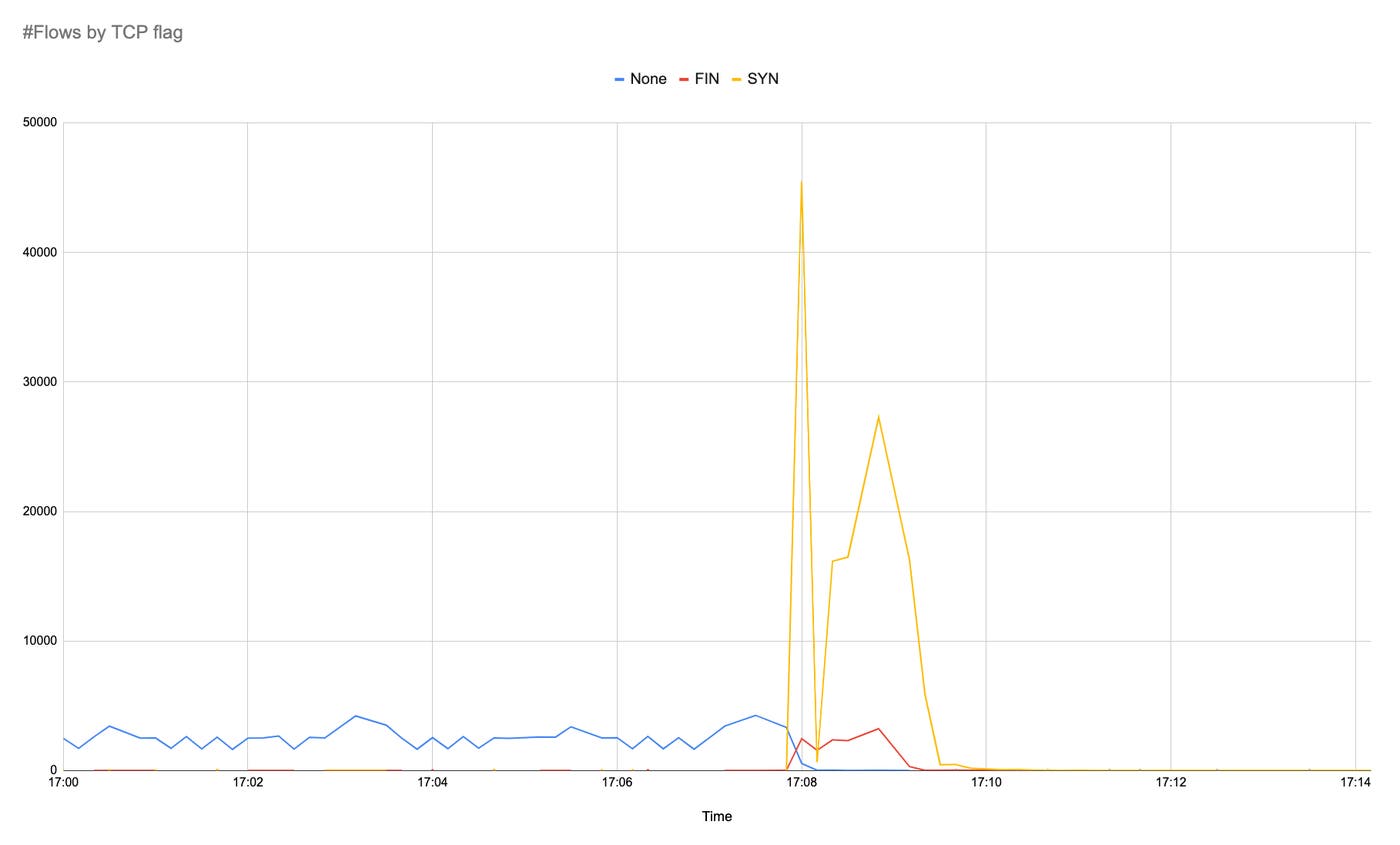
At this point, ENA metrics had shown us that a saturated VPC conntrack was preventing network connections and leading to DNS errors. And VPC Flow Logs had revealed that a specific type of client was sending SYN requests to try to connect to the old pod, but the host was not responding.
Learning how traffic is moving inside the node
To understand why the VPC conntrack was filling up—and why the Linux conntrack was not—we looked deeper into what was happening within the network. We focused on two key elements that define how packets travel to and from the metrics query service: Cilium and reverse path filtering.
A look at how Cilium, Kubernetes, and AWS networking manage pods and routing
The EC2 instances that host the metrics query service pods use two Elastic Network Interfaces (ENIs). The primary ENI—identified on the host as ens5—sends and receives traffic to and from processes running in the host network namespace, while the secondary ENI—ens6—sends traffic to and from the pods on the host.
We use Cilium in ipam:eni mode mode to manage networking within the Kubernetes cluster. When a new pod is created, Cilium is responsible for enabling that pod to send and receive traffic to and from the rest of the cluster. It reserves a subset of IP addresses from the VPC’s CIDR range and provides a native routable address for each pod on the secondary ENI.
Cilium creates a virtual Ethernet device (veth) that will serve as the endpoint for traffic destined to the pod’s IP. Next, it updates the host’s route table with a route to that veth so that traffic coming in from the VPC can reach the pod. It also adds an IP routing rule on the host to send outgoing traffic from the pod’s IP through the secondary ENI.
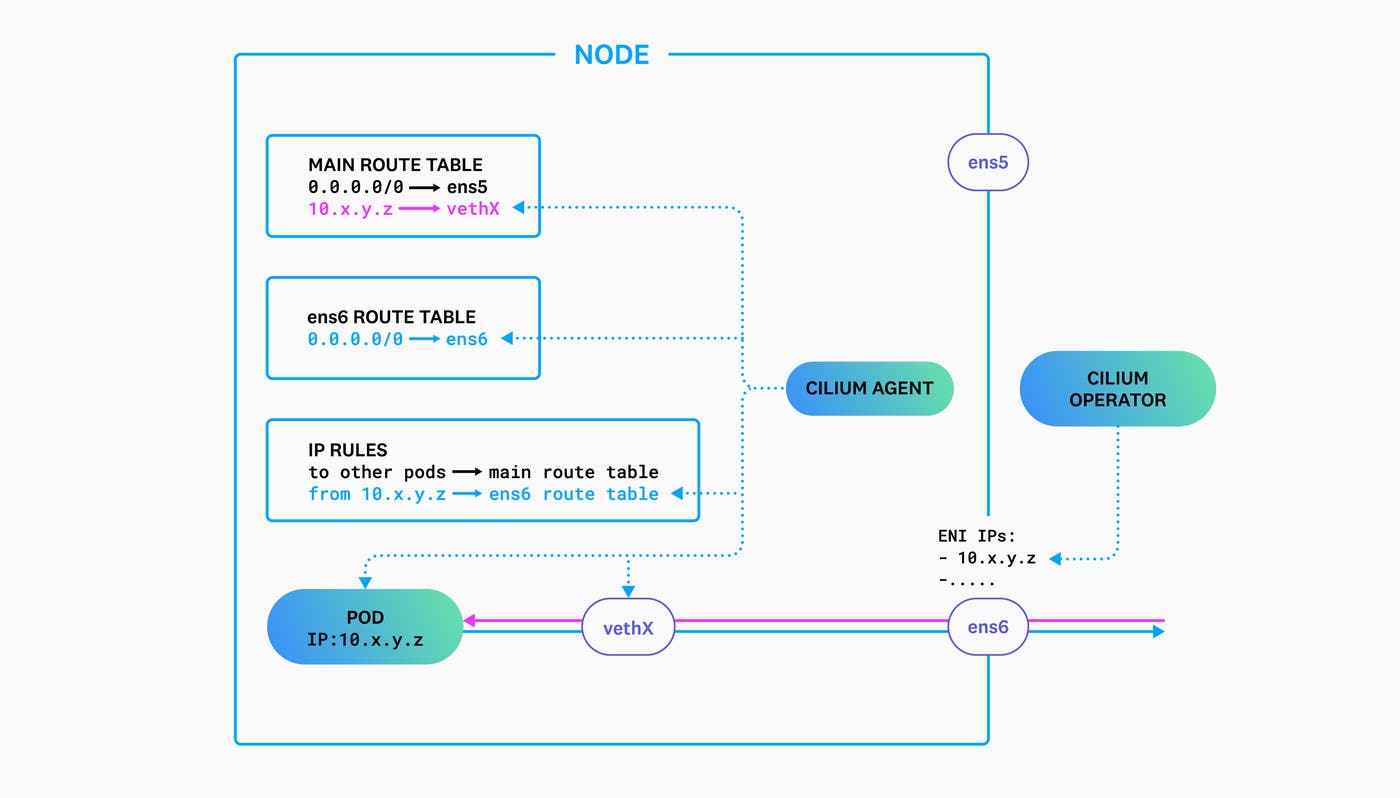
At the start of a rollout, Kubernetes deletes each old pod and Cilium removes its corresponding route table entry and IP routing rule on the host. At this point, even though the old pod no longer exists, VPC networking will still send traffic destined to its IP address to the secondary ENI on the host where it had lived. To understand what was happening to packets sent to the old IP address, we simulated traffic and analyzed the host’s routing behavior. We created two nodes, A and B, and sent traffic between them.
From node A, with IP 10.a.b.c, we sent packets to 10.x.y.z, an IP address which was allocated to node B’s secondary ENI (ens6) but not used by a pod on node B:
nodeA:~$ nc -vz 10.x.y.z 12345There was no response from node B, but it did see the incoming SYN request and retries:
nodeB:~$ sudo tcpdump -pni ens6 "port 12345"listening on ens5, link-type EN10MB (Ethernet), capture size 262144 bytes08:28:52.086251 IP 10.a.b.c.51718 > 10.x.y.z.12345: Flags [S], seq 4126537246, win 26883, options [mss 8961,sackOK,TS val 2002199904 ecr 0,nop,wscale 9], length 0Looking up the relevant route showed an error:
$ ip route get 10.x.y.z from 10.a.b.c iif ens6RTNETLINK answers: Invalid cross-device linkWe knew that this error came from reverse path filtering, and when we examined the kernel logs for further information, we saw that our test traffic was being identified as Martian packets:
Oct 28 08:25:54 ip-10-y-y-z kernel: IPv4: martian source 10.x.y.z from 10.a.b.c, on dev ens6This simulation showed us that reverse path filtering was dropping packets, so next we set out to discover why.
Reverse path filtering drops Martian packets
Reverse path filtering is a Linux security feature that examines each packet and determines its validity based on its source, destination, and return route. This helps prevent spoofing by identifying and ignoring Martian packets—requests whose return path would use an interface other than the one on which they arrived.
During the rollout, whenever a client sent a SYN packet to a deleted pod’s IP address, VPC routed it to the secondary ENI on the relevant host. Although it was coming in on the secondary ENI, there was no return route using that interface because Cilium deleted the IP rule when Kubernetes deleted the old pod. This meant that the host’s reply to that request would go out via the default route—the primary ENI. But reverse path filtering saw this as a Martian packet and dropped it before it got added to the Linux conntrack. The host did not respond with a SYN-ACK, an RST, or an ICMP host unreachable packet, so clients were unaware that their connection requests were directed at an outdated IP address.
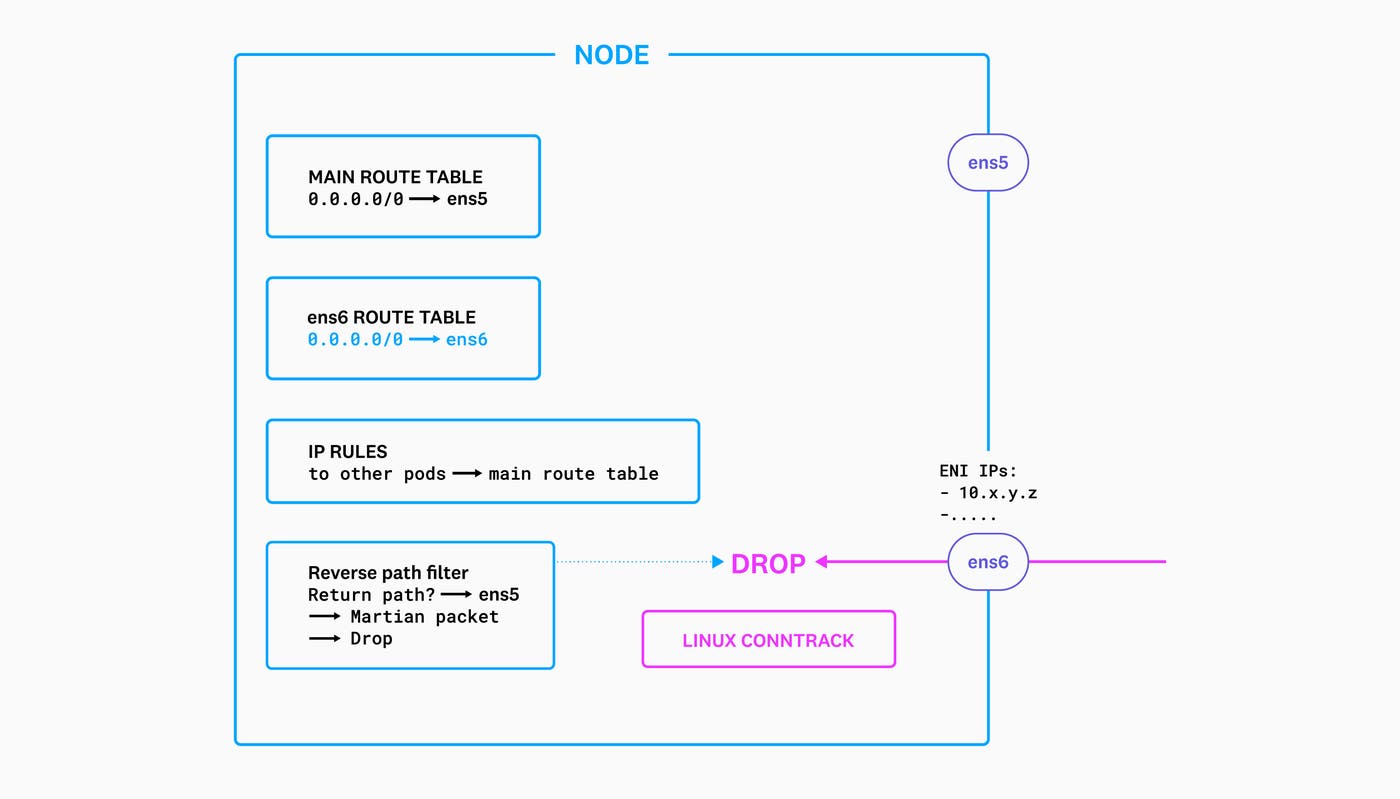
We saw kernel logs confirming this behavior:
Oct 28 08:25:54 nodeB kernel: IPv4: martian source 10.x.y.z from 10.a.b.c, on dev ens6This confirmed that reverse path filtering was dropping packets, but this service’s hosts are configured to use loose mode—which allows for asymmetrical routing—so we did not expect these packets to get dropped. Loose mode should only drop packets if they’re not routable through any interface; a packet that arrives on the secondary ENI should be allowed even if its return route is on the primary ENI. (Strict mode, on the other hand, drops packets that can’t be routed back out through the interface on which they arrived.) Reverse path filtering was behaving as if it were in strict mode, when in fact it was in loose mode.
We didn’t understand the reason for this until after we’d closed the incident. We explored the kernel code that implements reverse path filtering, and we discovered that the RTNETLINK answers: Invalid cross-device link error—and the Martian packet log—were triggered by the return -EXDEV statement here:
e_rpf: return -EXDEV;Leading to that return statement, we found the last_resort condition, which checks the value of the rpf parameter (which is 2 in our case, representing loose mode):
last_resort: if (rpf) goto e_rpf;But how did we get to last_resort? This test looked suspicious:
if (no_addr) goto last_resort;no_addr is set here:
no_addr = idev->ifa_list == NULL;ifa_list contains the list of IPs associated with the device, but in our case ens6—the secondary ENI—does not have an IP address. We added an IP address (that was completely unrelated to the addresses we use in our network) to ens6 and tested again.
$ ip addr add 192.168.1.1/32 dev ens6$ ip route get 10.x.y.z from 10.a.b.c iif ens610.x.y.z from 10.a.b.c via 10.m.n.1 dev ens5 cache iif ens6This confirmed that reverse path filtering was behaving as expected only if the secondary ENI had an IP address assigned. This part of our investigation helped us understand why reverse path filtering was not behaving as expected, even though we could not explain why the no_addr check was written this way.
To prevent requests for deleted pods from becoming Martian packets, we later contributed a PR to the Cilium project to add an “unreachable” route for the old pod’s IP address so that incoming SYNs are not dropped by reverse path filtering and clients get a clear ICMP error.
Meanwhile, we now understood that the Linux conntrack was not filling up because reverse path filtering was dropping those packets before they were added to the conntrack table. We knew that metrics query clients were sending a high rate of SYN requests to the old IP address, but we didn’t understand why. So we turned our investigation to the gRPC settings that define the behavior of the clients.
Understanding DNS propagation time
To explain the clients’ delay connecting to the service’s new pods, we wanted to understand how—and how quickly—changes in the pods’ IP addresses were propagating after the rollout. We found several factors that played a role in DNS propagation, and we analyzed each to see how it might be adding latency to the process.
We use external-dns to provide communication between services deployed across multiple clusters. Our external-dns configuration uses a 15-second TTL, and the version we use doesn’t update a pod’s DNS record until the kubelet has finished deleting the pod. (Newer versions of external-dns deregister the old address as soon as the Kubernetes API receives the delete command.) After receiving the SIGTERM, the service calls GracefulStop and then applies a 10-second timeout before shutting down and allowing the kubelet to finalize pod deletion. After the pod is deleted, its DNS address in Route 53 is not updated until the next external-dns sync, which in our case takes place every 15 seconds. Based on this, we expected an average of 25 seconds (10 seconds for the timeout and 15 seconds for the TTL expiration and Route 53 update)—and a worst-case scenario of 40 seconds—for the updated DNS record to be available to the client.
If a connection is lost, the gRPC client will resolve the service’s DNS name to re-establish a connection. It will continue to re-resolve the DNS name until it has successfully connected to the backends it needs to reach. The client’s re-resolution frequency—regardless of the frequency of connection attempts—is based on its min_time_between_resolutions parameter, which gRPC provides in order to avoid overloading the DNS server. The clients are configured with the default value for this parameter, so they would wait 30 seconds between resolutions. Accounting for all the necessary DNS update activity, clients have the updated DNS information 30 or—more likely—60 seconds after the rollout has initiated pod deletion.
Why were clients sending so many SYN requests?
We now knew that clients continued to send SYN requests to old pods during the ~60 seconds it took them to get updated DNS information, but we still didn’t know why they were trying to connect at such a high rate.
We began to look for an explanation in the gRPC settings of the service’s clients, and we found a change in their load balancing policy that appeared to correlate with this issue. Our clients had historically used gRPC’s pick_first load balancing policy. In June 2021, we resolved a separate issue by changing the affected service’s clients to use gRPC’s round_robin load balancing policy. Following that incident, we decided to apply round_robin as the default policy for clients across multiple services. When we rolled out an update to the metrics query clients in August 2021, the new default was applied and the clients started using the round_robin configuration for the first time.
We believed that this change explained the clients’ high rate of SYN requests. With the pick_first load balancing policy, each client connects to only one of the service’s backends. But when they use the round_robin policy, clients connect to all backends. Because each client sends a SYN request to open each connection, we believed that the round_robin policy explained the SYN flood we saw in the VPC Flow Logs.
But on closer look, we discovered that this application was creating one gRPC channel for each backend, so pick_first and round_robin should have behaved the same, since each channel was only given a single target.
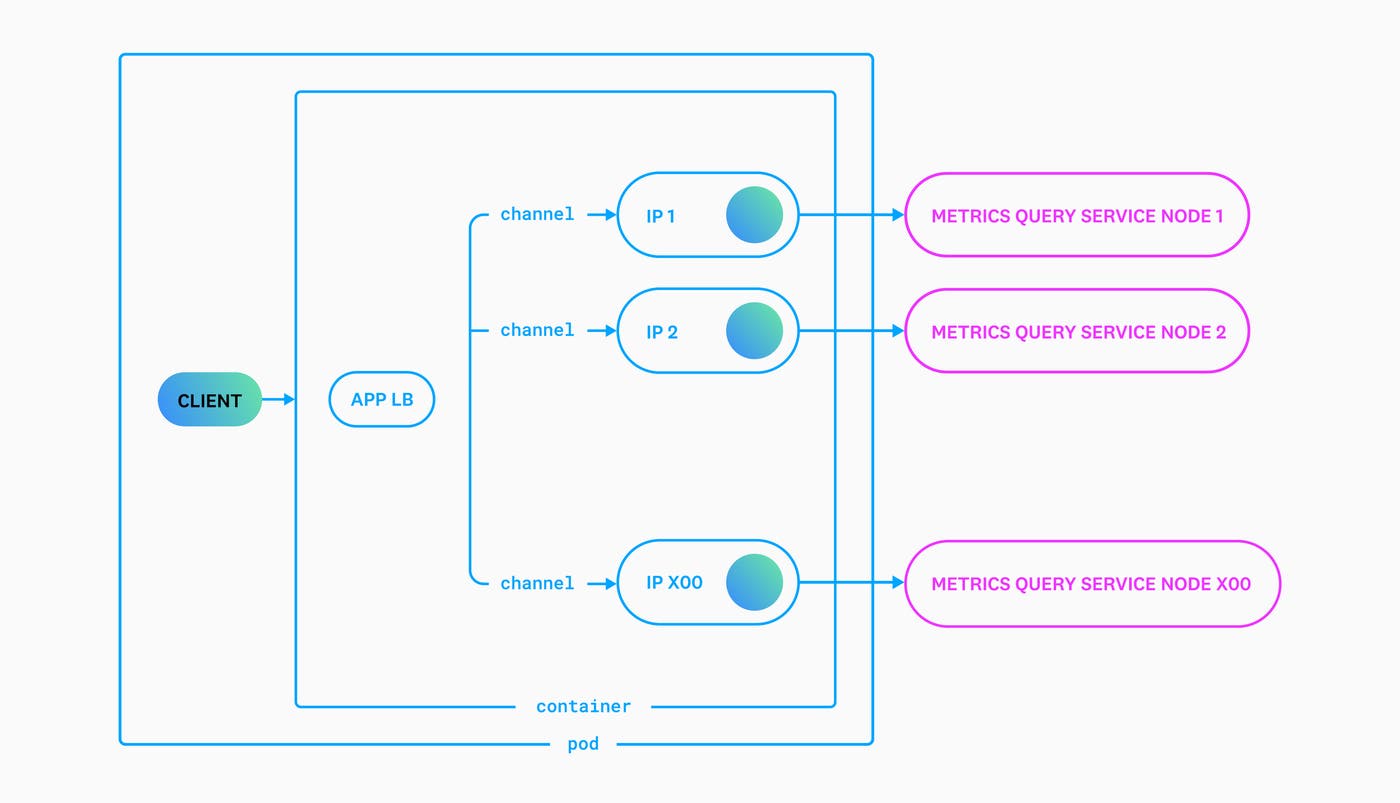
We no longer suspected that the SYN flood was caused by the number of connections, but we knew that it correlated with the change in gRPC load balancing policies, so we looked for an explanation in their reconnect behavior. Using the pick_first configuration, if clients became disconnected from the service, they would not automatically try to reconnect. Instead, they would wait for the application to request a reconnection. When we switched clients to use the round_robin policy, they would automatically reconnect any time a channel became disconnected.
One factor in the clients’ reconnect rate is their configured connection backoff value. When we looked at the client code, we found a very aggressive gRPC reconnect timeout—a parameter we had set a long time ago—that caused them to retry more frequently when they could not connect. The pick_first load balancing policy had generated relatively few reconnects, so this aggressive setting did not have a noticeable effect until we changed to the round_robin policy. The service has ~900 clients—about 600 pods, each with 15 containers. Each client was trying to reconnect approximately every 300 milliseconds, resulting in a total of up to 30,000 SYN requests per second.
Recall that the SYN requests sent to the old pods were dropped by reverse path filtering, but not before they were added to the VPC conntrack. Normally, the VPC connection tracking logic would maintain these records, updating their status when the host replied with an RST or an ACK (to acknowledge the request). Connection requests that aren’t acknowledged within 60 seconds should be automatically removed from the VPC conntrack table, but during the rollout, client requests were accumulating in the table much faster than they were being removed.
Once we understood that our custom gRPC reconnect parameter was causing the SYN floods, we created a PR to remove those parameters—shown below—and restore the defaults.
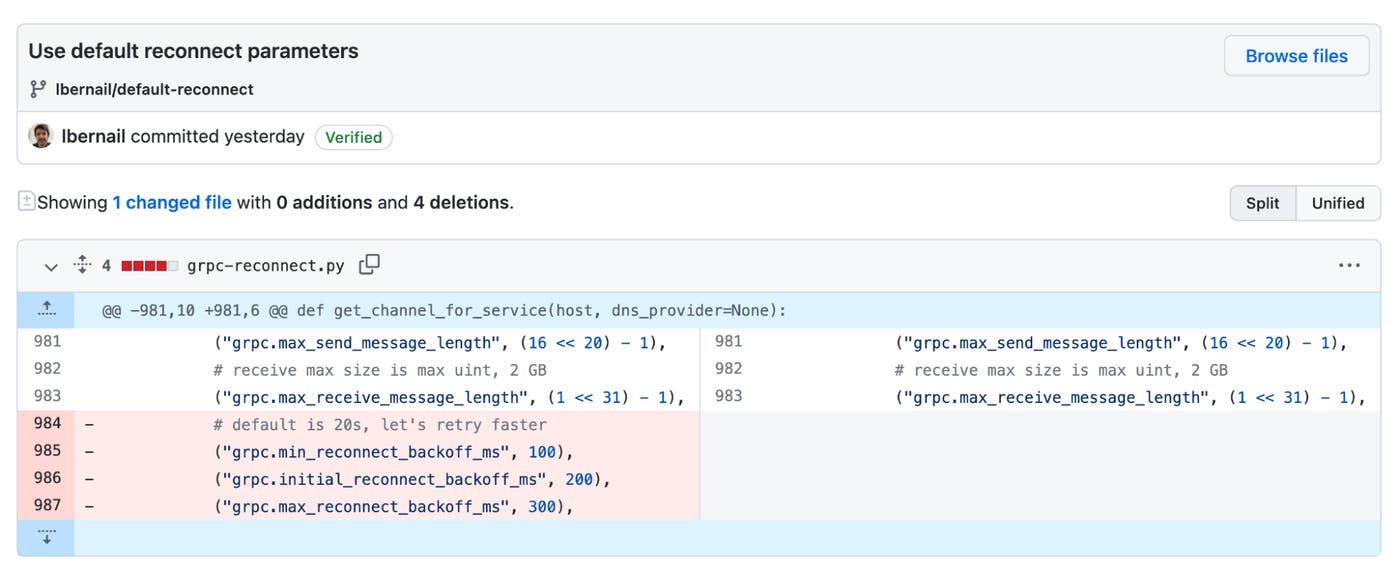
The next rollout did not show the errors we had seen correlated with rollouts beginning in September, and we resolved the incident.
The ongoing challenge of complexity
This series of incidents showed us that edge cases within the powerful abstractions we rely on—gRPC, Kubernetes, and AWS—occasionally lead to errors that surface a complexity that is hidden most of the time. It forced us to gain a deeper understanding of our gRPC configuration, which brought insight into behaviors we had seen in our services for quite some time but had not fully understood. After spending months investigating, we ultimately found the roots of these incidents in changes we’d made ourselves. These changes—to work around a bug in a dependency, resolve previous incidents, and override default reconnect parameters—seemed safe at the time, but they had unintended effects that surprised us much later when it was difficult to spot the correlations.
We hope you’ve found this story intriguing and illuminating. If so, you may also be interested in working with us.


