Christophe Nasarre
The Profiling Engineering team at Datadog develops profiling tools for various runtimes, including Microsoft .NET. This blog post is the first in a series explaining the technical architecture and implementation choices behind our .NET profiler. Along the way, we’ll discuss profiling for CPU, wall time, exceptions, lock contention, and allocations.
What is a profiler?
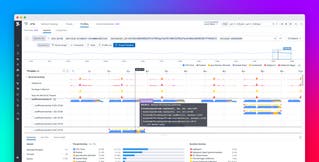
Before digging into the details, let’s define what a profiler is: a profiler is a tool that allows you to analyze application performance and method call stacks. While APM focuses on request performance (latency, throughput, error rate), profiling focuses on runtime performance, monitoring not only CPU consumption but also resources such as method duration (often called wall time), thrown exceptions, threads contention on locks, and memory allocation (including leak detection).
Datadog’s .NET profiler is a continuous profiler. While other profiling tools like Perfview, JetBrains dotTrace, dotMemory, and Visual Studio performance profilers can do some of the same performance analysis, they are best run sporadically or in non-production code because they have a high overhead themselves. Unlike these tools, Datadog’s profiler is built to run on production 24/7 while maintaining a negligible impact on application performance.
With 24/7 production profiling, you don’t need to build a separate environment with the same security, traffic, load, and hardware to reproduce an issue found in production. We took great care to build this continuous profiler so that its impact on application performance is limited. Indeed, maintaining performance will be a recurring theme throughout this blog series.
.NET profiler architecture

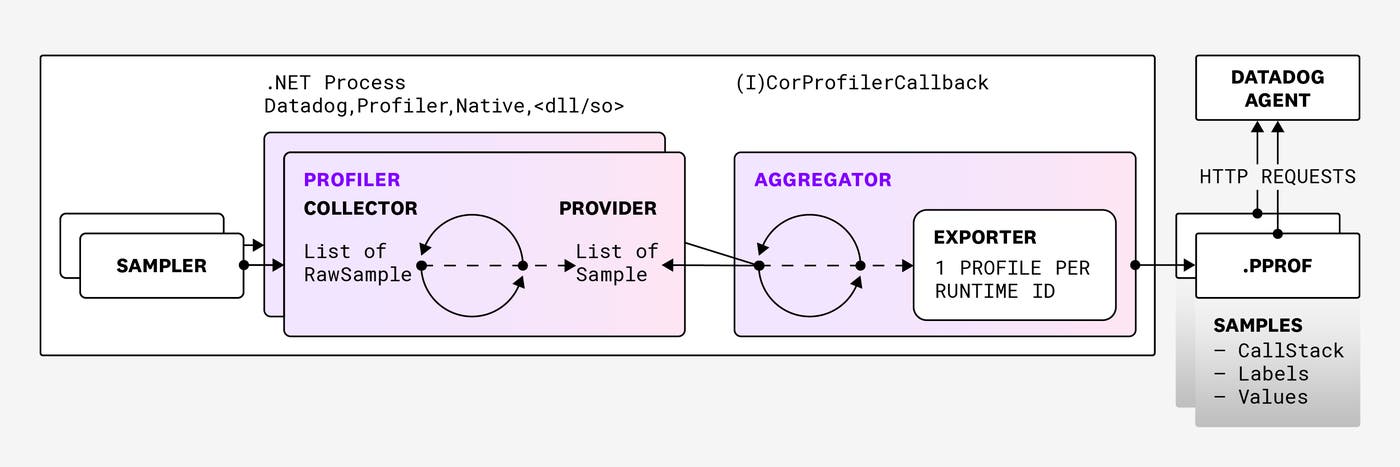
Datadog’s .NET Profiler consists of several individual profilers, each of which collects data for a particular resource such as CPU usage, wall time, lock contention, and so on. Each profiler has a sampler, for collecting raw samples, and a provider, which exposes them.
An aggregator then gathers the samples exposed by the profilers, and an exporter serializes the samples into a .pprof file and uploads it to our backend, through the Datadog Agent. Datadog’s backend then processes these files so that users can analyze the collected data.
Collecting and aggregating samples
Each sample contains:
- A call stack: a list of frames, one per method
- A list of labels
- A vector of numeric values
Each position in the vector corresponds to a different type of profiler information, such as wall time duration or CPU consumption. The labels are key-value pairs where contextual information, such as the current thread ID, is stored. When the labels and the call stack are identical between samples, the exporter adds up the values and stores only one sample in the profile.
For example, if an exception is thrown twice by the same code and by the same thread, they share the same call stack and labels. Raw samples with the same call stack and labels are merged. This is an optimization that generates smaller files, since call stacks and labels are not duplicated. The code responsible for aggregating and serializing samples into the Google .pprof format is written in Rust and shared with other Datadog runtime profilers (profilers for Ruby, PHP, and so on).
Processing samples on the backend
Associating profiles with traces and spans
The profiler attaches metadata to each .pprof file sent to the Datadog Agent by HTTP. The metadata includes the process ID, the host name, and the runtime ID.
Let’s dig into what the runtime ID is. In Datadog, each application or process is associated with one service. However, in .NET, it is possible to run several services in the same process—like what is done by Microsoft IIS, with each service in a different AppDomain. Datadog uses a runtime ID, assigned by the .NET Common Language Runtime (CLR), to uniquely identify a service for both the tracer and the profiler. This allows the Datadog backend to find the profiles related to a given trace or span.
Behind the scenes, the tracer tells the profiler which runtime ID maps an AppDomain to which service name, DD_SERVICE, which a user sets through configuration or API. If the DD_SERVICE environment variable has not been set, it uses the process name. For each runtime ID in a process, one profile is sent every minute. Consequently, several profiles from the same process can have the same date and time, but a different runtime ID.
Cleaning up .NET call stacks
The profiling API provided by Microsoft is used to build the type and method names of the frames shown in the Datadog profiler call stack visualizations. However, in some cases, what is provided by the API does not match exactly what was written in the code. To avoid these differences, Datadog cleans up certain frames, so that resultant call stacks are less confusing to read and understand.
Clean-up changes include:
- Constructors: The .NET runtime provides each class constructor as a method named
.ctor. Datadog replaces.ctorwith the class name from the C# code. - Anonymous methods: When a callback is defined inside the code of a function, an anonymous method is created. Instead of the complicated name generated by the compiler, Datadog builds a display name from the name of the method in which the anonymous method is defined, plus the suffix
_AnonymousMethod. - Lambda and local methods: In C#, you can pass anonymous methods as lambdas, especially with LINQ statements. Datadog builds the display names for these the same way as with anonymous methods, but with
_Lambdaas a suffix. - Inner named methods: If you define a method inside another method, the C# compiler gives a different name to the inner methods based on the top defining method. In this case, the compiled name may look like
<DefiningMethodName>g__InnerMethodName|yyy_zzz. Instead, Datadog renders this asDefiningMethodName.InnerMethodName.
There are also more complicated cases, such as when the compiler generates hidden state machine classes with a MoveNext method. Datadog cleans up these frames by using the same type and method names as what’s in the source code.
High level .NET profiler implementation
When we designed the .NET profiler architecture, we considered using Microsoft’s TraceEvent nuget. The code responsible for receiving and parsing CLR events would be written in C#, and the managed code would be run by the same CLR as the profiled application. This would result in the corresponding allocations adding memory pressure on the garbage collector.
We could alleviate the garbage collector problem by running the code in a sidecar application, but then we would face other issues:
- Because of the sidecar, deployments would be more complicated.
- If the application runs under a different user account as a Windows service or in IIS, we couldn’t connect to these probably protected user accounts.
- Some events, like memory allocations, must be processed synchronously—but this is not possible with the asynchronous communication channels available from a sidecar, like EventPipe or ETW.
In light of this, we decided against using TraceEvent. The current implementation of the Datadog .NET continuous profiler is written in native code (C++ and Rust) that runs in the same process as the profiled application.
Startup and initialization
Because we profile even the startup code of a .NET application, our code is loaded as soon as possible when a .NET application starts. With the CLR, we can register a COM-like plugin library (.dll on Windows and .so on Linux) that implements the ICorProfilerCallback interface, which is loaded by the runtime when the application starts.

One important limitation of this architecture is that only one ICorProfilerCallback implementation can be loaded by the CLR. In our case, we have multiple Datadog products (for tracing, security, and profiling) for .NET applications that implement ICorProfilerCallback to be loaded this way, and communicate with the CLR via the ICorProfilerInfo interface. So, we added a native loader that is responsible for loading the other ICorProfilerCallback implementations (specified in a configuration file) and for dispatching the different ICorProfilerCallback method calls from the CLR to each of our implementations. When you install the APM bundle, this native loader is automatically registered.
Leveraging CLR services
Because the profiler is loaded before any application’s managed code even runs, we can set up the profilers that collect the various profile types. The following table lists the profilers and which CLR services are used for their implementation:
| Datadog profilers | CLR services used |
|---|---|
| CPU time and Wall time | List of managed threads to be profiled via ICorProfilerCallback’s ThreadCreated, ThreadDestroyed, ThreadAssignedToOSThread, and ThreadNameChanged methods. |
| Exceptions | Notified of thrown exceptions via ICorProfilerCallback::ExceptionThrown. The layout of Exception class fields is built one time when its module is loaded. ICorProfilerCallback::ModuleLoadFinished notifies when that is completed. |
| Locks contention | Listens to Contention events emitted by the CLR. |
| Allocations | Listens to AllocationTick event emitted by the garbage collection. |
| Live heap | Based on allocations and the ICorProfilerInfo13 API in .NET. |
A future blog post in this series will talk more in depth about how the profiler listens to and processes CLR events.
To transform call stack instruction pointers into symbols (the names of methods), we call ICorProfilerInfo::GetFunctionFromIP, which returns the FunctionID of the managed method. If the method was a native call, this fails and we look for the module in which it is implemented. For a deep dive into the details of symbol resolution (module, namespace, type, and method), see Deciphering methods signature with .NET profiling APIs.
Finding the CLR version
Before bootstrapping the profilers, we need to know which version of the CLR is running the application. The events emitted by different versions of the runtime have different payloads that lead to either missing features or adjusted implementations. Additionally, the ways the events could be received are different, depending on if you are using ETW for .NET Framework, EventPipe for .NET Core 3, and ICorProfilerCallback for .NET 5+.
First, the CLR calls the ICorProfilerCallback::Initialize method and passes in an implementation of ICorProfilerInfo to access the .NET runtime services. This interface has grown with the versions of the runtime ICorProfilerInfo3::GetRuntimeInformation. It looks like it would be able to figure out the major and minor version of the runtime, but it doesn’t distinguish between Framework 4+ and .NET Core 3+. While both share 4.0 as their version, the former uses COR_PRF_DESKTOP_CLR and the latter uses COR_PRF_CORE_CLR (the Microsoft documentation uses this value for the long-gone Silverlight).
So, to distinguish between major and minor versions of the runtime, we call QueryInterface on the ICorProfilerInfo provided via Initialize, starting from the latest (currently .NET 7 in our latest release):
| ICorProfilerInfo version | Runtime version |
|---|---|
| 13 | .NET 7 |
| 12 | .NET 5 or .NET 6 |
| 11 | .NET Core 3.1 |
| 10 | .NET Core 3.0 |
| 9 | .NET Core 2.1 or .NET Core 2.2 |
| 8 and below | .NET Framework |
Conclusion
This overview of the architecture, implementation, and initialization of the Datadog .NET profiler provides you with the background you need to understand how we can profile production applications continuously. Based on the 24/7 production requirements, the first architectural and technical decisions have been presented (in-process native code bound to the right CLR services) and, in the next post in this series, we’ll dig into the details specific to continuous CPU and wall time profiling. You will see more examples of designs and implementation choices that minimize the impact on applications running in production environments.


