Aaditya Talwai

Emily Chang
Elasticsearch uses the term “master” to describe the primary node in its cluster architecture. Datadog prefers the more inclusive term “leader,” which we will use in this post.
Many companies, including Etsy, Stripe, and Datadog, run game day exercises in order to improve and maintain fault-tolerant production systems. Game days are designed to purposefully trigger failures in your services, so that you can observe how they respond in a controlled environment.
At Datadog, game days have provided a framework to help us discover weaknesses, create more useful alerts, and deploy fixes that improve the way our services respond to failures.
We recently ran a game day on one of our Elasticsearch clusters. We hope you’ll find these observations as useful as we did—and if you’re looking for a great way to test the resilience of your systems, we encourage you to run your own game day.
The game plan
First, let’s dive into some details about the Elasticsearch cluster we tested in our game day. Datadog APM traces are stored and indexed in this cluster, which runs Elasticsearch version 2.4.4. It is comprised of three distinct pools: client nodes, data nodes, and leader-eligible nodes. You can learn more about the purpose of each of these node types here. Below is a short summary of the jobs that these nodes perform within our infrastructure:
- Data nodes hold data, i.e., traces! A trace is a collection of spans that tells a story about a single request to your application. We store traces as JSON documents, and our API docs should give you a sense of what these documents contain.
- Client nodes are the first hop for search and indexing requests. At Datadog, a set of Go workers ingests incoming traces and sends them to the client nodes, which then route them to the appropriate data node. Search queries generated in our web layer also go through client nodes, which assemble the resulting traces and serve them to the frontend.
- The leader node is elected from the leader-eligible pool, and is the chief coordinator for any operation that alters shared state in the cluster.
For this game day, we set out to test the following scenarios:
- Stopping Elasticsearch on the leader node to learn more about leader election behavior.
- Stopping Elasticsearch on a client node that routes read and write requests for recent data.
- Stopping Elasticsearch on a client node that routes write requests for long-term data.
To track how our applications responded, we collected some key health metrics—hits, latency and errors—from the services that had a known dependency on Elasticsearch. For example, we traced the requests made by our Elasticsearch Go Client to determine if our ingestion workers were having trouble persisting traces. We also watched load, free memory, and network traffic on our Elasticsearch nodes, to get a sense of how much we were stressing out the underlying infrastructure.
Lessons learned
Be prepared for 503s
Our leader-eligible pool is comprised of three nodes. At any given time, one of these nodes is the active leader. The leader node is in charge of coordinating any change to shared cluster state. For example, if you have ever had to increase the speed of shard recovery when responding to a failed data node, you probably relied on the leader node to propagate this config change to nodes across the cluster.
A leader election is, in our experience, a fairly rare occurrence, but we wanted to observe it in a controlled setting to get a sense of how our applications responded. After identifying the existing leader, we killed the Elasticsearch process on that node.
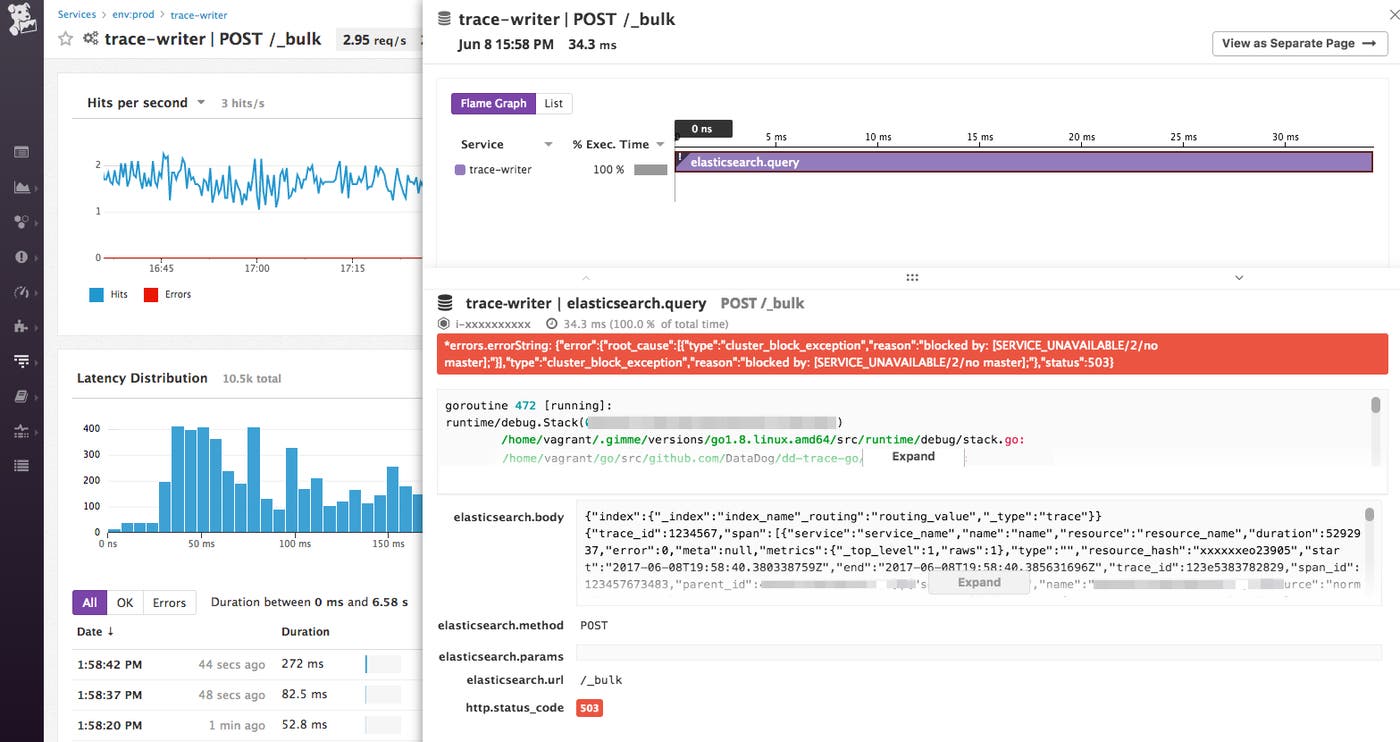
Our instrumentation gave us a uniform view of all queries landing on the Elasticsearch cluster. Crucially, APM splits up requests and errors by HTTP status code, so we had a window into exactly what responses our cluster was serving during the leader transition.

For a very brief period during the leader election, we witnessed that both indexing and search requests were returning 503s. In total, this time period lasted about five seconds, a function of the ping_timeout setting in Elasticsearch’s zen discovery mechanism.
Our applications were wired to respond to 503s by buffering their requests in memory and retrying them after a small backoff. This strategy allows them to be resilient to brief periods of unavailability. Because our leader election went off without a hitch, and a new leader was chosen in a matter of seconds, our apps recovered with minimal impact.
If you’re using Datadog APM, you could instrument your app with our Elasticsearch APM integration and set up a monitor for trace.elasticsearch.query.errors{http.status_code:503, service:$MYSERVICE} to ensure that your client nodes are successfully processing requests.
Dangling indices can turn a cluster RED
It’s often helpful to manually expire indices in your Elasticsearch cluster—perhaps to keep a lid on resource usage, or to gracefully “age out” data that is unlikely to be useful to query. Elastic’s Curator is a great tool for this, and we run it in a cron job to discard indices that have exceeded a certain age.
But remember that discarding indices is a cluster-wide operation, and one that needs acknowledgment across every node. So what happens when a delete is acknowledged by some nodes but not others?
We found out mostly by accident. While we had taken down a leader-eligible node during our game day operations, our Curator job ran unattended, and deleted several indices. These deletes were acknowledged by every node except one: the downed leader.
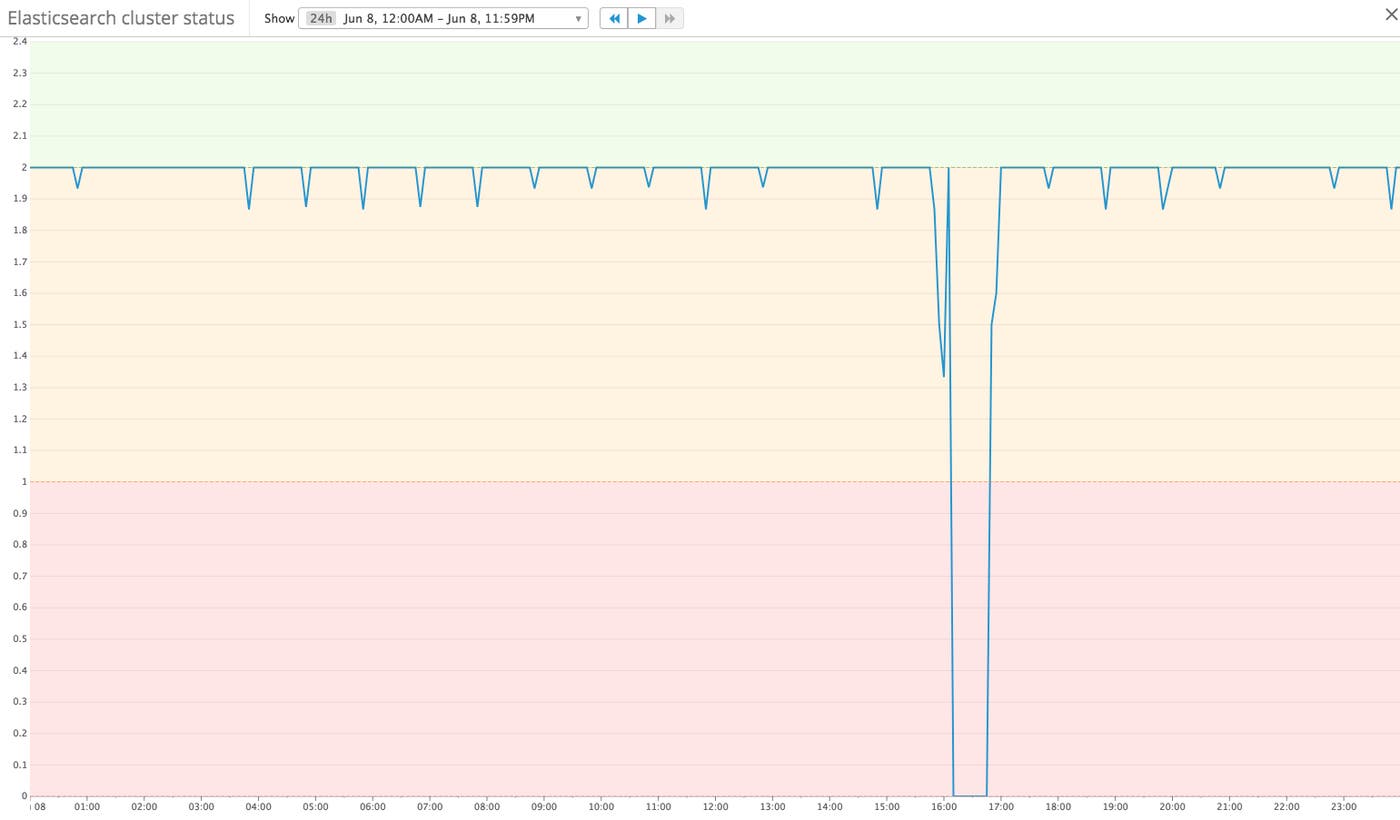
At the time, this was mostly fine. But when we reverted to normal operations and brought our downed leader back up, our cluster went to RED as a result of several indices residing in local node metadata, but not replicated in any other node.

After a brief sanity check, and a helpful excursion through Datadog’s event stream to spot the last time our Curator job ran, we opted to delete the indices by hand, which returned the cluster to GREEN. These “dangling indices” gave us a brief scare, but Elasticsearch’s tooling made the problem obvious to us pretty quickly.

Health checks for client nodes are key
Our Elasticsearch client pool fields the majority of our search queries originating from the web app. When you filter for a trace, or a set of traces, client nodes are the first hop to help route queries to their appropriate shard. Depending on how the data is placed, they may also compose results as they are retrieved from their respective shards.
When using a client-data-leader cluster split, as is recommended for Elasticsearch, client nodes are also the way you address the cluster. We pass our applications a list of client node IPs so they know where to send their requests. But static IPs have their downside—they couple your application to a specific set of nodes that can go up and down arbitrarily (and in this case on the whim of a rogue developer).
Regular health checks for client nodes are key. We were expecting that this exercise (taking a client node down) would have more of a negative impact on request routing, but we were surprised to find that our cluster handled the failure quite well. We realized that this was because we were using the olivere/elastic client, which automatically embeds a simple ping check in the application layer. As such, our apps quickly dropped the downed client node from their active pool, and restricted queries to the remaining healthy nodes.
But not all Elasticsearch drivers have built-in health checks—indeed, our home-rolled Python client (which we use elsewhere in Datadog) was much less clever. Thanks to this game-day observation, we transitioned all of our Elasticsearch client nodes to a Consul-backed DNS addressing scheme, to avoid having to concern our applications with figuring out which nodes were healthy. In our new setup, Consul is in charge of pinging our client nodes to check their health, and only healthy IPs are exposed under the trace-es-client DNS name. Our apps now point to this DNS name, rather than to static IPs, and are more resilient to nodes dropping in and out of the client pool.
Game day pointers
This game day offers just a few examples of the types of situations you could test in your own environment. Running a game day is a great way to test and identify vulnerabilities in your systems, and determine if you need to tweak existing alerts and/or create new alerts to notify you about important issues.
When we conclude a game day, we’ve found it’s useful to summarize our findings in a standardized format, to make it easier for others to digest:
- The scenario: What you’re testing and how you triggered those scenarios.
- Expected results: How do you expect the service to react?
- Actual results: How did the service actually react? What went well? And what didn’t go so well?
- Follow-up actions: Checklist of fixes or to-dos to address vulnerabilities or blind spots you uncovered, as well as any scenarios you plan to investigate further in future game days.
We hope we’ve inspired you to go forth and run your own game day exercises—if they’re anything like ours, you’ll uncover valuable insights about your systems, and have a lot of fun doing so.


