

Your network is continuously becoming more complex. Whether you’re migrating to the cloud, deploying containers, or load balancing your applications, getting visibility into your network’s architecture is increasingly difficult—yet more important than ever. Due to the ephemeral nature of VMs and containers, identifying traffic by IP address is no longer enough to understand where your traffic is going, or how this traffic affects the health, performance, and security of your network.
To provide enhanced visibility into endpoints within and outside your network, we’re happy to announce that domain resolution is now generally available in Network Performance Monitoring. Domain resolution extracts meaning from your network endpoints by translating temporary IPs into stable, easily recognizable domain names, so you can quickly pinpoint dependencies to cloud and external endpoints like Amazon S3, load balancers, and more. You can also use domain resolution to isolate connectivity and latency issues in traffic to external endpoints—where an agent cannot be installed—such as third-party platforms and APIs.
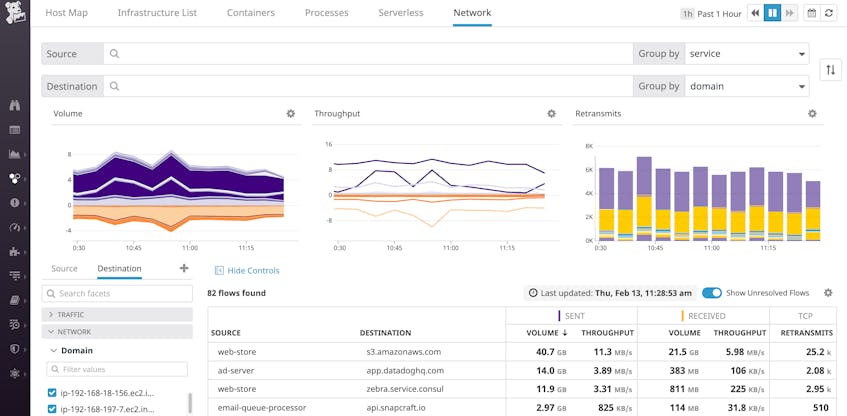
Datadog resolves domains for internal and external IPs on the receiving end of your network connections, using inspection of traffic over port 53. Domain names, at the granularity of individual IP-to-IP flows, appear as a domain tag that you can use to filter and aggregate traffic.
In this post, we’ll highlight how to use domain resolution in Network Performance Monitoring to:
- Monitor cloud provider services
- View traffic through load balancers
- Debug traffic to external endpoints
- Pinpoint security issues
Monitor cloud provider services
In the cloud, keeping tabs on your network is especially important—but also more challenging. You may not have direct access to install a monitoring agent on your instances (e.g., if you’re using a managed database service like Amazon RDS). And on top of that, cloud-based components are designed to weather a state of flux, making it difficult to see through the noise of ephemeral IPs and ports.
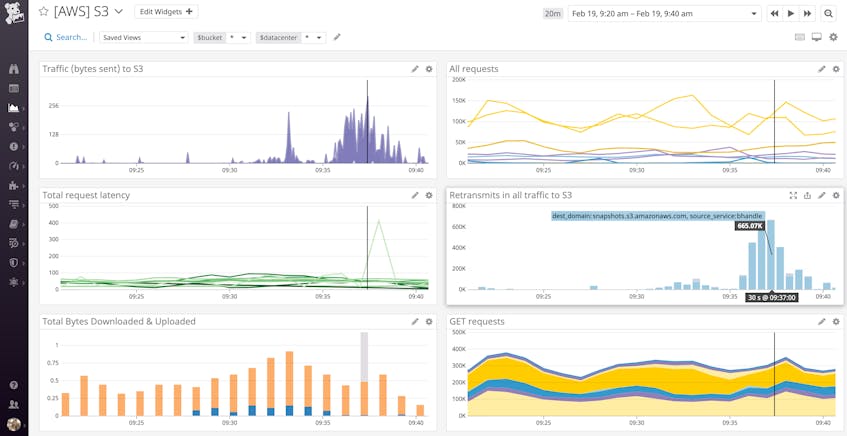
With domain resolution and Network Performance Monitoring’s tag-based filtering and aggregation, you can follow the flow of traffic wherever it goes, and understand at a glance when, how much, and with what latency your hosted services are communicating with cloud services such as Amazon S3, Google Cloud Storage, or Azure Blob Storage. Network Performance Monitoring automatically detects tags like region from the sources that communicate most with cloud services, so you can, for instance, compare the latency (i.e., round-trip time) in traffic to S3 between your US and EU regions. If you see high network latency in a particular region, you can correlate it with request latency and error metrics for different HTTP request methods using our S3 integration.
View traffic through load balancers
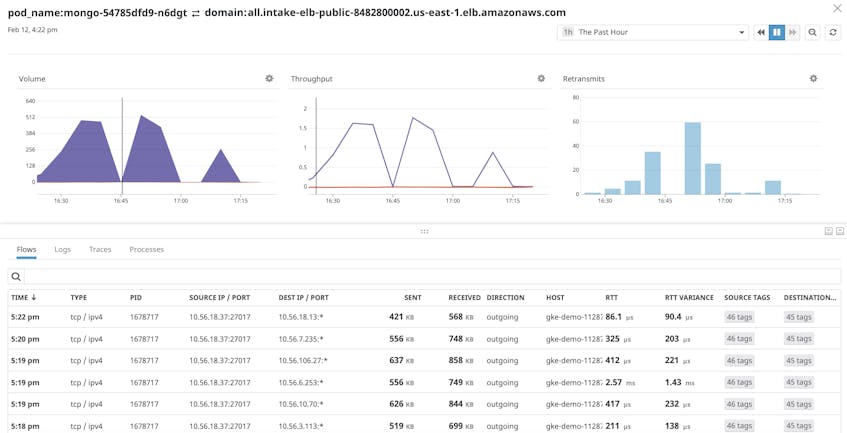
With domain resolution built into Network Performance Monitoring, you can monitor incoming traffic to load balancers—whether they’re cloud-based, on-prem, or hybrid—to stay ahead of potential performance issues. High retransmits to a load balancer from its backend instances, especially when correlated with spikes in target connection errors, may indicate a downstream issue. From here, you can pivot to Datadog’s out-of-the-box ELB dashboard and use metrics like surge queue length and 5xx errors to determine if the ELB has enough capacity to handle all of the requests it’s receiving.
In containerized environments, errors can often be traced back to issues with load balancing among containers in a workload. An ELB’s errors can also lead to CPU overloading of the backend instances it communicates with. Domain resolution helps you immediately identify which load balancer endpoints are causing downstream problems by tracking latency and connectivity issues in their incoming traffic from Kubernetes services. Latency in traffic to an ELB may point to a misconfiguration with the ELB or an overwhelming volume of traffic from a particular service. The Network Page allows you to break down traffic to an ELB by source so that you can easily isolate which of these issues is affecting your system.
Debug traffic to external endpoints
External traffic is more expensive and often more brittle or malicious than internal traffic. By resolving IPs to human-readable domains, you can monitor traffic to external endpoints that are particularly important to your business. For instance, bidding platforms are extremely latency sensitive, and poor connectivity to a platform like Facebook may impact your ability to place ads and generate revenue.
Since Network Performance Monitoring connects seamlessly to the rest of Datadog, you can even utilize it alongside distributed tracing and APM. If a service exhibits increased request duration without a corresponding spike in network latency (indicated by round-trip time) when communicating with other services, you can conclude that the issue is at the code level and not a larger network issue. By inspecting a row on the network page, you can navigate to the “Traces” tab to isolate traces with especially long durations and pivot directly to their flame graphs in APM to debug further. From here, you can correlate errors in your service’s requests to the lines of code generating the errors.
Pinpoint security issues
Network attacks are often perceived as coming from the outside in, when in fact, some of the most harmful attacks are indicated by attacker-orchestrated, malicious egress traffic. Domain resolution can help you instantly spot unrecognizable external domains that may point to these attacks. Domains embellished with a malicious top-level domain (e.g., .cf, .gq, .download) may signal a flood attack, a kind of distributed denial-of-service (DDoS) attack that diverts traffic away from legitimate domains into malicious, attacker-registered domains.
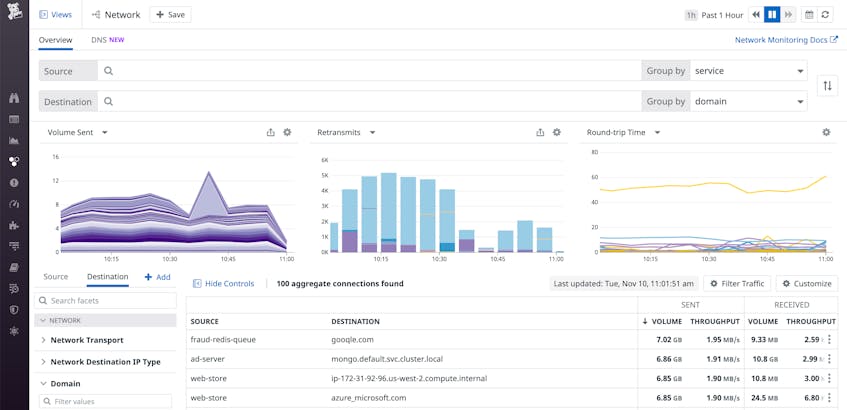
Domain resolution can also point to a typosquatting attack, also known as URL hijacking. Attackers register domains that take advantage of human spelling errors to match intentionally misspelled strings (e.g., gooogle.com instead of google.com). They may also register domains that reflect seemingly recognizable strings, sending traffic to a malicious domain (e.g., azure_microsoft.com) over a legitimate domain (e.g., azure.microsoft.com).
If you are using a firewall between your private network and your open internet, and you notice a malicious domain, you should configure your firewall’s policies to only permit egress traffic to authorized domains. For increased network border protection, you can also exclude the IPs associated with malicious domains, so that you don’t communicate with them in the future.
Start monitoring network endpoints with domain resolution
We’re excited to bring you this new feature for monitoring your network. Domain resolution is automatically enabled for Network Performance Monitoring with the latest release of the Datadog Agent. If you’re already using Datadog to monitor your infrastructure, you can enable Network Performance Monitoring today to get deeper visibility into your network connections. Otherwise, get started with a 14-day free trial.
