
When you scale your infrastructure in the cloud, you rely on a large number of servers to work in concert. These servers should have the same performance metrics, as they’re replicas of one another. If some are visibly behaving differently, you should be concerned.
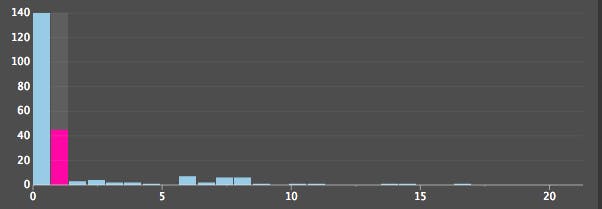
So, how do you find out if they’re behaving differently? Given enough servers the traditional visualizations start to fall short of delivering any actionable information. What can you tell from the graph below? There’s one line at 0, none above 100, and the rest falls somewhere in between. In short, not much.

What you need to gain an at-a-glance understanding of several server’s state is a third dimension (with time scale and the values themselves making up the first two dimensions), to be able to get an idea of the concentration of specific servers that fall into certain metric bands.
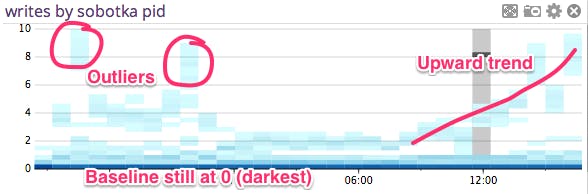
Datadog’s new heatmaps accomplish this. By using color brightness as the third dimension, heatmaps let you instantly grok and identify patterns for a given metric across a large number of servers.
This is helpful for two reasons. First, it gives an understanding of how most servers behave, and thus if they’re performing well, what can be considered “normal” or “expected”.
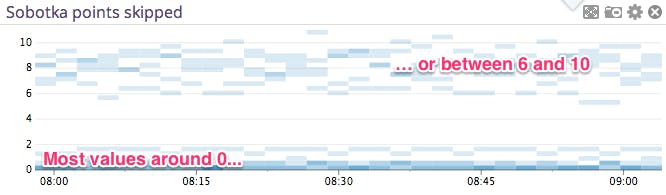
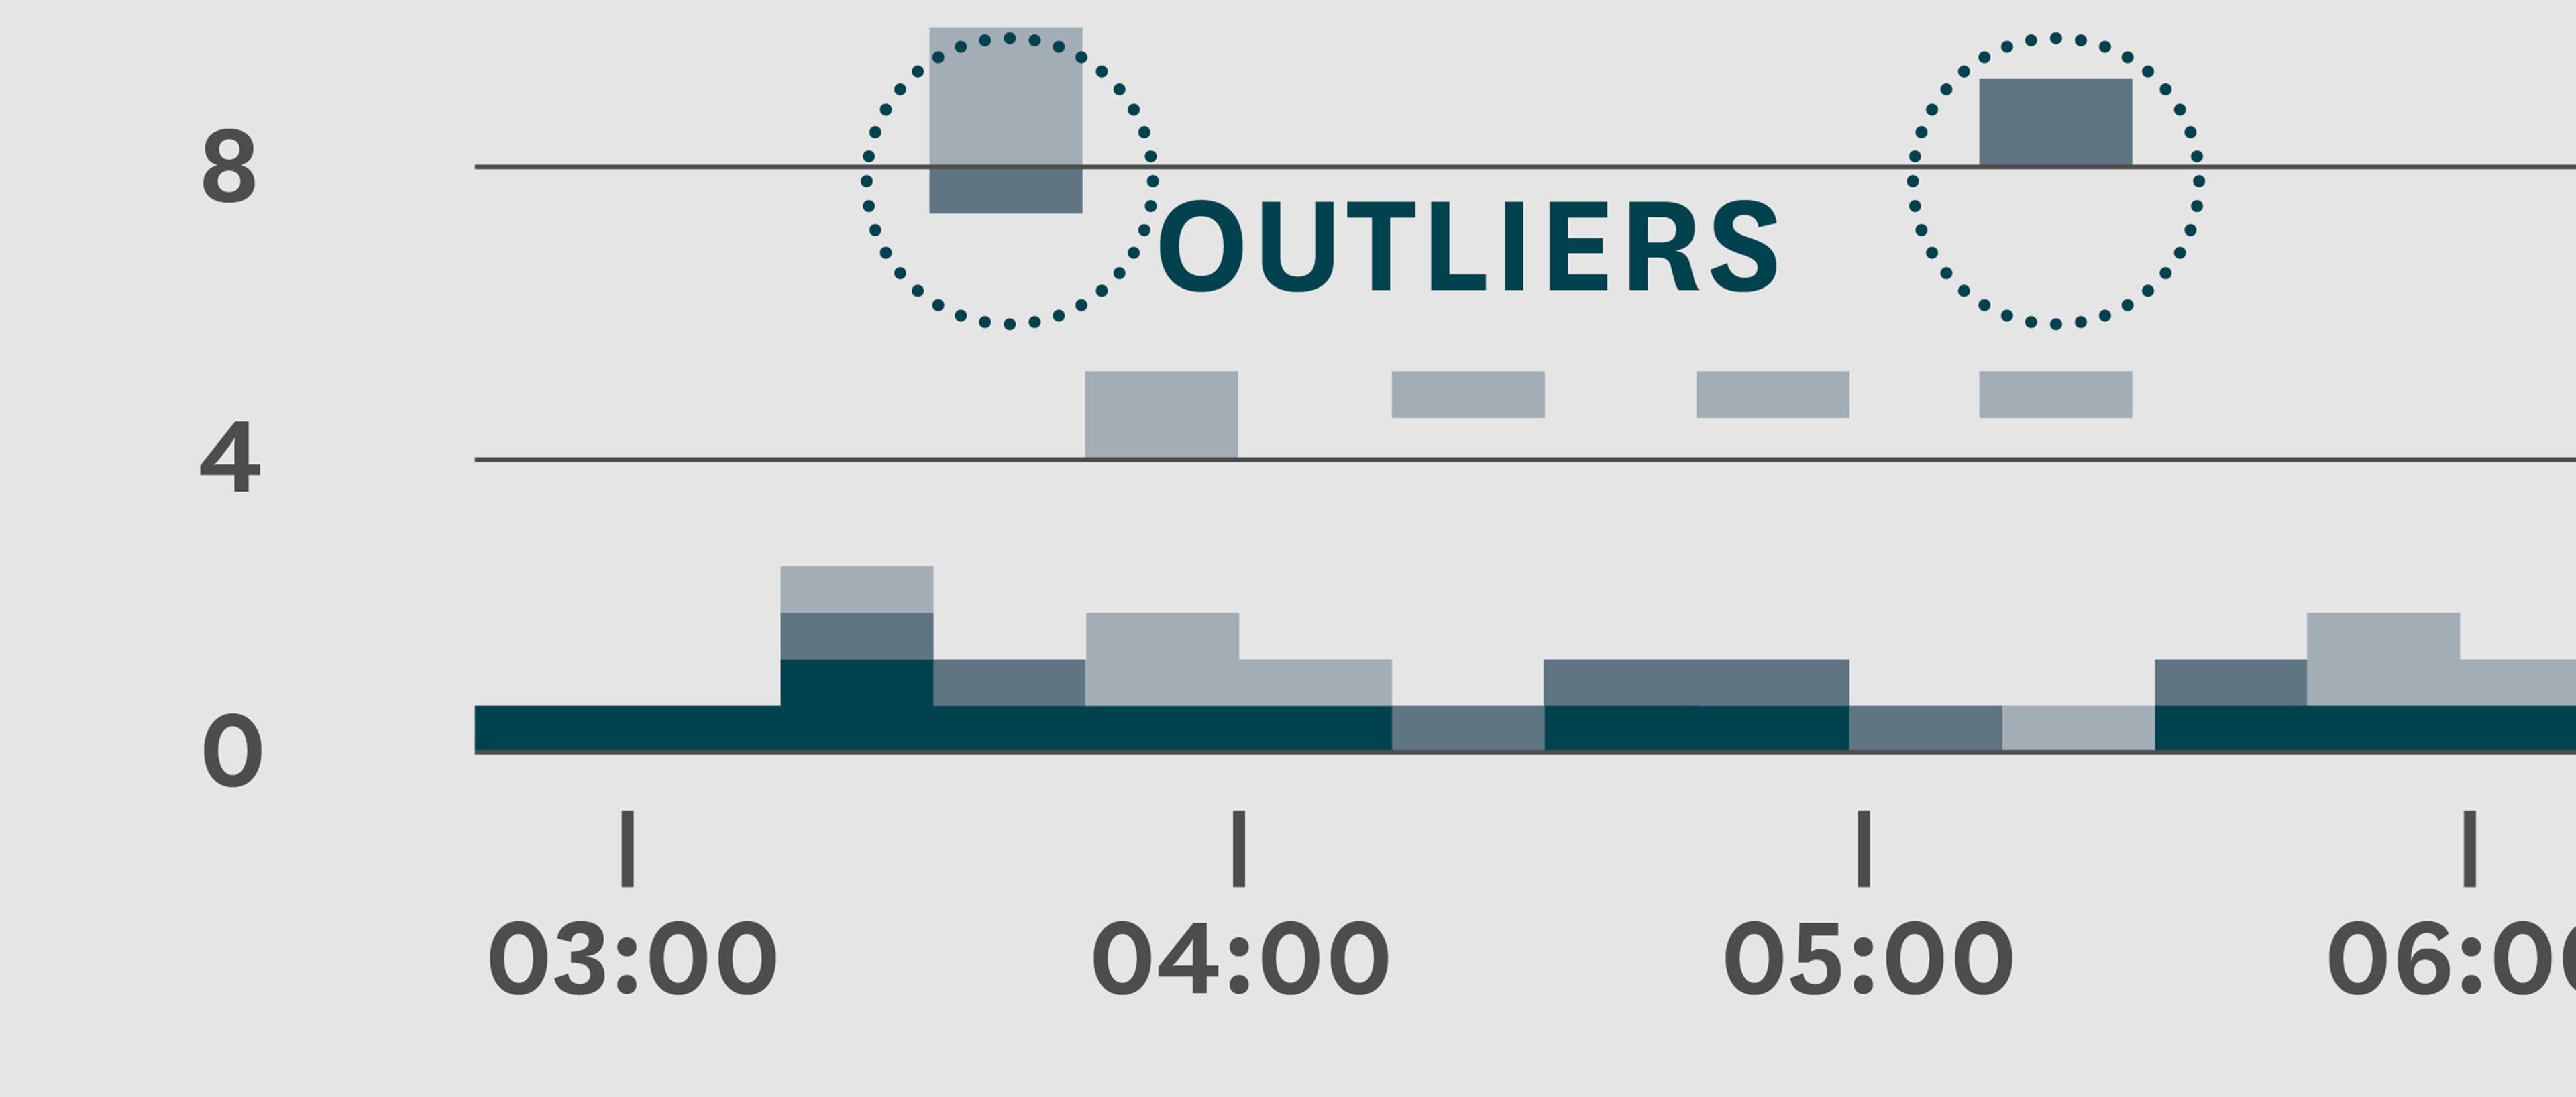
Second, and more importantly for troubleshooting, it makes it easy to find outliers, as they are instantly visible.
From there, you can click on a given band to get the details of the affected servers. And not let misbehaving servers get lost in the noise.
Getting access to Datadog’s heatmaps for your infrastructure takes just a few minutes. After you sign up for a free Datadog trial, this visualization type will be available on graphs in your dashboards.
