Scott Richardson

Garrett Sibinga

Aaron Kaplan
Visibility into the upstream and downstream dependencies of your services is key to maintaining a performant microservices environment. Application developers and SREs rely on this visibility to quickly trace issues back to the source, which is essential during incidents—when time is of the essence—throughout day-to-day operations, and as systems evolve and scale. But troubleshooting issues can be difficult when your resources receive traffic from numerous sources, and issues often originate multiple steps upstream.
We’re pleased to announce the Dependency Map Navigator, which provides detailed visibility into the flow of traffic through your resources, such as specific endpoints or queries, from your upstream to your downstream service dependencies. This visibility lets you quickly pinpoint repetitive requests to services in downstream call paths and troubleshoot issues in upstream services.
In this post, we’ll provide an overview of how the Dependency Map Navigator can help you:
- Zero in on load amplification in downstream services
- Expedite incident response by quickly identifying large upstream callers
Zero in on load amplification in downstream services
Load amplification occurs when a resource sends a substantially higher number of requests to a downstream service than it receives, as in cases of the n+1 problem—a common instance of which is repetitive querying to a database. Load amplification drags down application performance and drives up costs. But it can also be difficult to identify, and engineers are often under-equipped to determine which specific upstream call paths have triggered load amplification in downstream services.
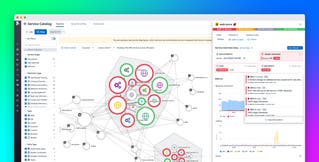
With the Dependency Map Navigator, you can quickly pinpoint load amplification in your call paths. You can access the Dependency Map via the Service Catalog or Service Map in APM. Each Service Page includes a table of resources, and each Resource Page has a Dependency Map with the Navigator.
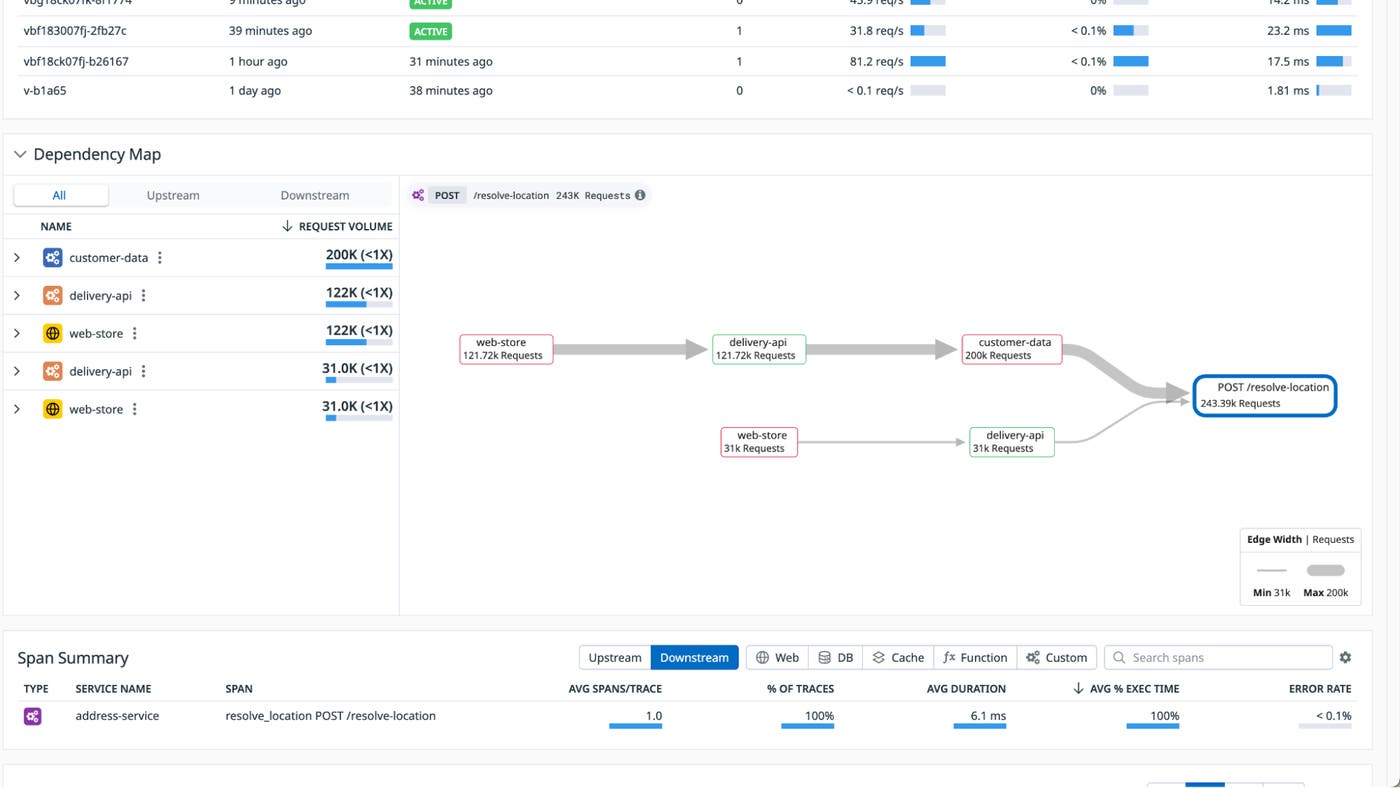
The Dependency Map displays the upstream and downstream service dependencies of any resource you select. You can hover over each node on the map to view service metrics, including requests per second, error rate, and average latency. You can click on each node to access the relevant Service Page or host map, as well as related traces, monitors, logs, and processes.

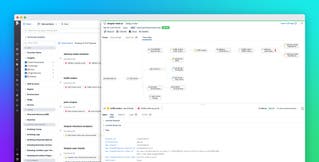
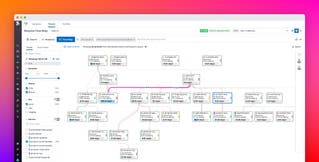
On the left-hand side, the Dependency Map Navigator flags services that are experiencing load amplification and sorts them by severity. In the Navigator, you can expand each service undergoing load amplification to see repetitive spans. Load amplification is calculated by comparing the number of requests received by the selected resource with the number of requests received by each downstream service. Traffic volume is indicated in the map by the weights of the edges connecting the nodes, enabling at-a-glance evaluation.
Expedite incident response by quickly identifying large upstream callers
Without the ability to trace traffic to your resources back to specific upstream callers, incident response can become prolonged and disorganized. By identifying the upstream services that are sending the most traffic to affected endpoints, the Dependency Map provides vital information for incident investigations and helps facilitate internal coordination among teams. From the Dependency Map, you can easily pivot to the Service Catalog, where you can identify which team owns a particular service and access their dedicated Slack channels, Jira boards, and GitHub repositories with a single click.
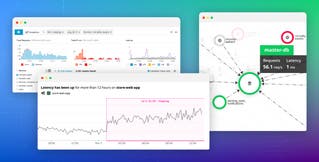
Let’s say you’re an SRE who’s been paged about elevated latency in one of your endpoints. Using the Dependency Map Navigator, you can quickly identify the upstream dependencies issuing the highest proportion of calls to that endpoint. From there, you can begin your incident investigation by inspecting those callers’ Service Pages or any associated monitors. The screenshot below shows the red service node borders the Dependency Map uses to indicate monitor alerts.
Speed up troubleshooting and optimize performance in your services
Real-time visibility into dependencies is particularly important due to the dynamic nature of cloud-based infrastructure. With the Dependency Map Navigator, engineering teams can quickly zero in on costly performance inefficiencies in downstream services and expedite troubleshooting during incidents. Datadog APM users can start using the Dependency Map Navigator with their instrumented applications today. If you’re new to Datadog, get started with a 14-day free trial.


