Deepak Balasubramanyam
This is a guest post from Deepak Balasubramanyam, co-founder of Konotor.com, which is a mobile-first user-engagement platform that helps businesses engage, retain, and sell more to their mobile app users.
Background
Konotor has grown tremendously over the last year, so the scale of our operations has grown quickly too. Like many growing companies, we were finding ourselves spending an increasing amount of energy to make our monitoring practices keep pace with our business. These were some of our pressing questions:
- How can we detect issues before they significantly affect our users?
- How do we correlate different events and metrics to make sense of what is happening?
- How do we do all that as we grow our user base and our infrastructure?
Then we found Datadog. It answers all those questions and more. Monitoring with Datadog has been hugely valuable for Konotor. In this article I’ll share how Datadog helped us solve one of our big problems: scaling our PostgreSQL database.
Problem: Slow writes on AWS Elastic Block Store
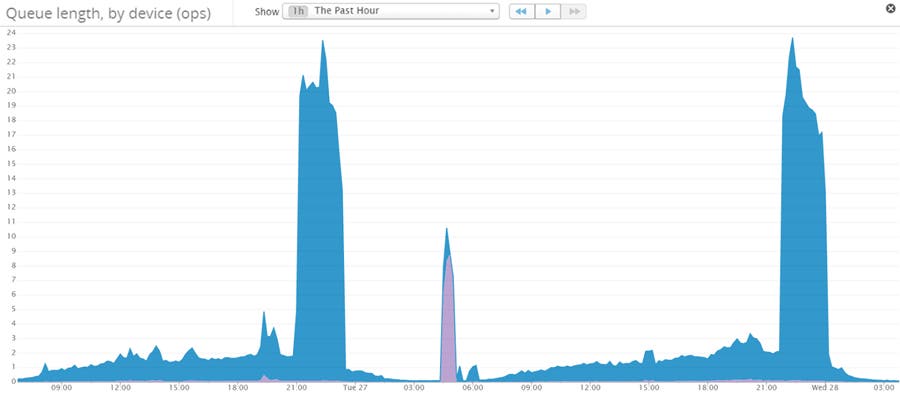
We wanted fast database responses from PostgreSQL, so we decided to use SSD-backed AWS Elastic Block Store (EBS). Things went fine until we started getting alerts that some of our write queries were starting to get slow. By slow I mean really slow. What would normally take 50ms now took 800ms. This was baffling since traffic stats on Datadog showed us that the peak traffic had already passed and the day was coming to a close. The queue length on the data disk was quite high when this happened, but what was causing it?

Investigation
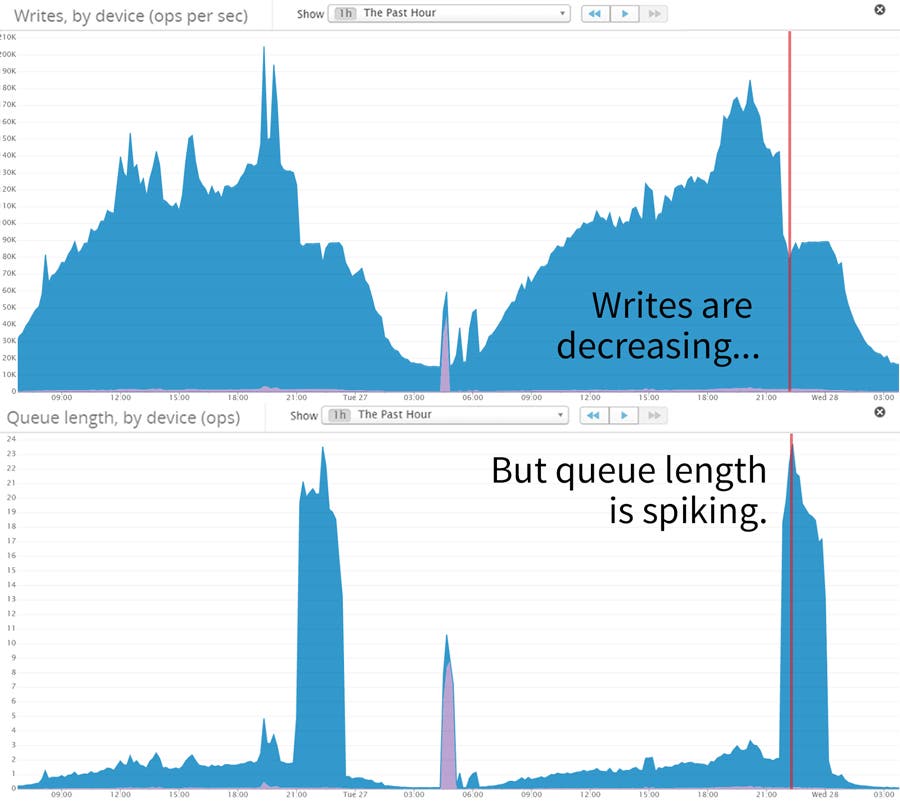
We decided to correlate the writes with the queue length, and we found something strange: queue lengths spiked immediately after writes started to go down (see below). What was happening?

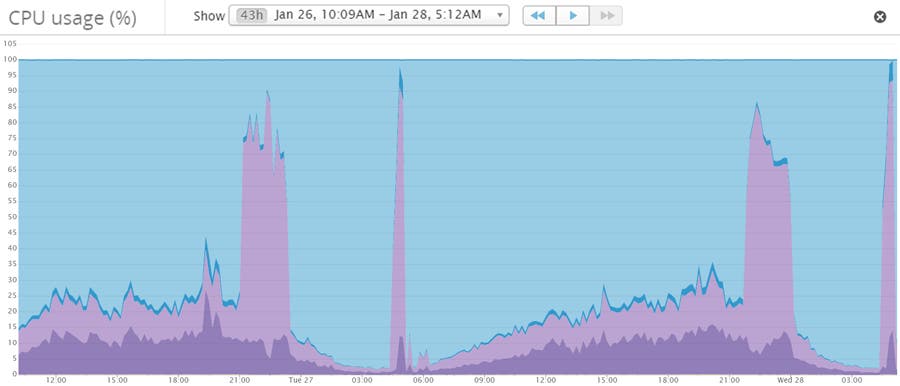
Konotor is a write-heavy application. We keep track of mobile user metrics and custom properties which change with time. The graphs above gave us a clue: AWS Elastic Block Store writes were declining even while plenty of new write requests were coming in from the application (and being sent to the queue). Using Datadog, we confirmed that CPU was not maxed (though it was spending a lot of time waiting on I/O), there was available RAM, and our PostgreSQL locks looked fine. This led us to our insight: EBS was throttling our writes!
We discovered that while allocating new disks to the database we had failed to correctly calibrate how many IOPS the disks would consume. Let’s say that you purchase an SSD disk that is 100 GB in size and has 500 IOPS allocated to it. With the General Purpose (SSD) volumes we used, AWS Elastic Block Store will allow you to exceed your I/O limit in case your site encounters bursts in traffic. At the time of this writing there is a formula to calculate this.

What is a credit you ask? Your device accumulates credits when you do not exceed its base performance. Since we had consumed more writes (mostly) and reads than what were provisioned for us, the AWS Elastic Block Store throttle kicked in and capped our IOPS to the device’s base performance.
Solution
There are many possible solutions which can be used separately or together. Use the strategies that are best for your situation.
Striping multiple disks
By striping you can spread the I/O load across your disks and this approach can handle burst pretty well. Be sure that database has the right backup policies to handle disk failures.
Use Provisioned IOPS (SSD)
You can always buy your way out with more I/O power. It may simply be the case that your application needs N IOPS to scale in production. If you use this strategy, be sure to purchase an EBS optimized instance. Other conditions to be met have already been documented well by Datadog.
Use ephemeral storage
This is faster than EBS for obvious reasons, but the solution never did sit well with me since storage will be wiped out during a restart. Use this solution only if you know what you are doing and figure out your failover plans before your primary goes down.
Move frequently used tables / indexes to another disk
PostgreSQL allows you to define a new tablespace dynamically and move specific tables / indexes to the new tablespace using the ALTER clause. This ensures that write heavy transactions do not affect other transactions. The tables will be locked when you move the tables / indexes over to a new tablespace, so do this with care.
Reduce I/O writes
Tuning your app writes and trimming indexes can help reduce I/O.
- Can your application buffer writes and aggregate them before flushing it to the database?
- An INSERT or UPDATE operation on your table will lead to more writes depending on the number of indexes that need to be updated. Can you afford to drop some of them or prune them using partial indexes?
Detection and prevention
With good monitoring, you can avoid ever having these problems affect your users.
- Monitor and alert the I/O transactions on all your disks. Set your alert so that if you begin to approach your provisioned I/Os you can act quickly and avoid running out of I/O credits.
- Monitor how CPU time is spent. When we ran into this issue over the span of 2 days, most of the CPU time was spent on I/O waits due to a high queue length. Notice how the actual CPU utilized is low but I/O wait (shown in light purple) is very high.

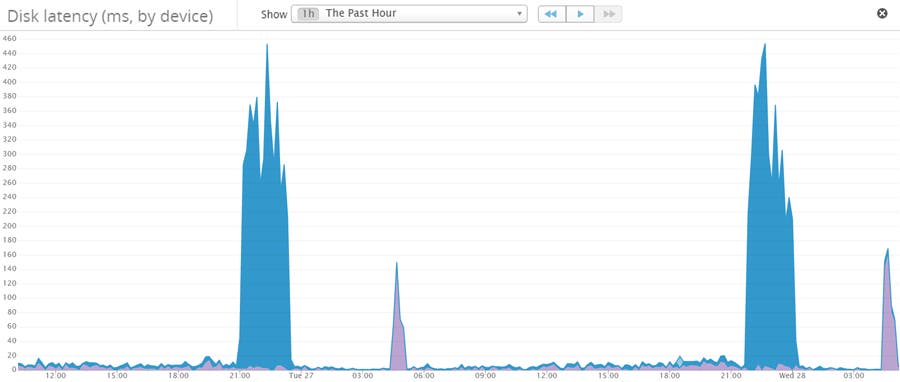
- Monitor disk latencies. You should monitor for high disk latency, too.

Why we use Datadog
As we look to scale our operations we rest easy knowing that Datadog has our back. These are some of the areas where Datadog shines.
Correlation
To know if increased writes to your database came from increased web traffic or an index you added at version 3.0.1 of your application, you need to correlate data. While you can get some of these metrics from AWS, you cannot correlate them easily or construct dashboards dynamically.
More metrics
As you expand your infrastructure you will need more sources for metrics. Whether you use Kafka or Tomcat, Datadog has a plugin for any framework / server under the sun.
Lightweight
Datadog’s Agents are lightweight and add little to no overhead to a production system. Plugins can poll data from a framework’s HTTP API for example (say from RabbitMQ) instead of gathering this data more intrusively (by existing inside the framework).
If you’re looking to avoid ever having storage problems affect your users, sign up for a 14-day free trial of Datadog and monitor your CPU usage, disk latency and much more.


