

Serverless event-driven architectures are composed of AWS Lambda functions that regularly interact with databases, APIs, message queues, and other resources to facilitate complex workflows and functionalities. It is therefore crucial to monitor every component of your stack to ensure your applications perform optimally at scale. But traditionally, telemetry data for AWS resources has lived in silos, making it difficult to quickly get the context you need to debug issues. For instance, if the end-to-end latency of a customer request to your application’s backend suddenly spiked, you would need to dig into each resource’s Amazon CloudWatch metrics and logs to figure out whether an overloaded database, throttled Lambda function, or misconfigured API Gateway endpoint was to blame.
As today’s serverless applications become increasingly complex, we’re excited to announce that we’ve fully redesigned the Serverless view to meet our customers’ need for a more seamless debugging experience. The new Serverless view unifies telemetry data from Lambda functions and other AWS resources to give you a full overview of your entire serverless stack—making it the ideal starting point for monitoring, debugging, and optimizing your applications.
Create a logical view of your serverless application
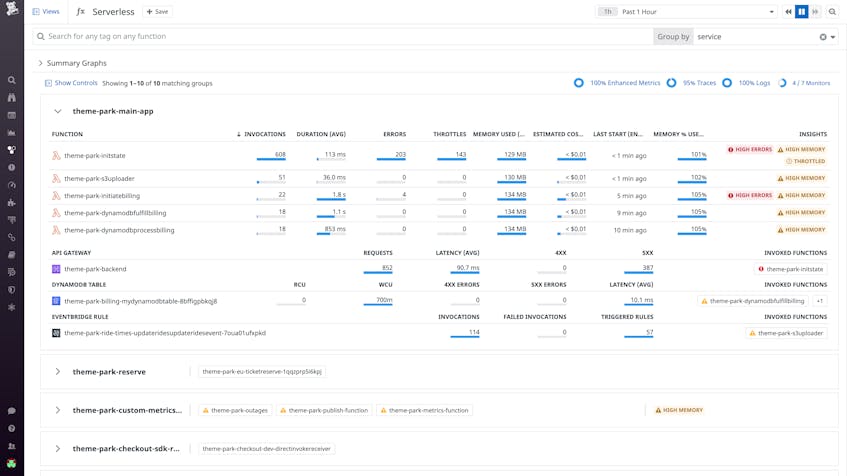
By default, the Serverless view groups your serverless resources by service to help you easily visualize how each part of your application is performing. For each service, you will see the functions that belong to it, along with the resources (Amazon API Gateway, SNS, SQS, DynamoDB, S3, EventBridge, Kinesis) that invoked them.
While grouping by service is the default, you can also group your resources by AWS CloudFormation stack name, as well as any other tags you’ve configured (e.g., team, project, or environment). Additionally, Saved Views allows you to preserve your preferred way of grouping, so you don’t need to manually enter it every time you visit the page.
Detect and debug performance issues across your stack
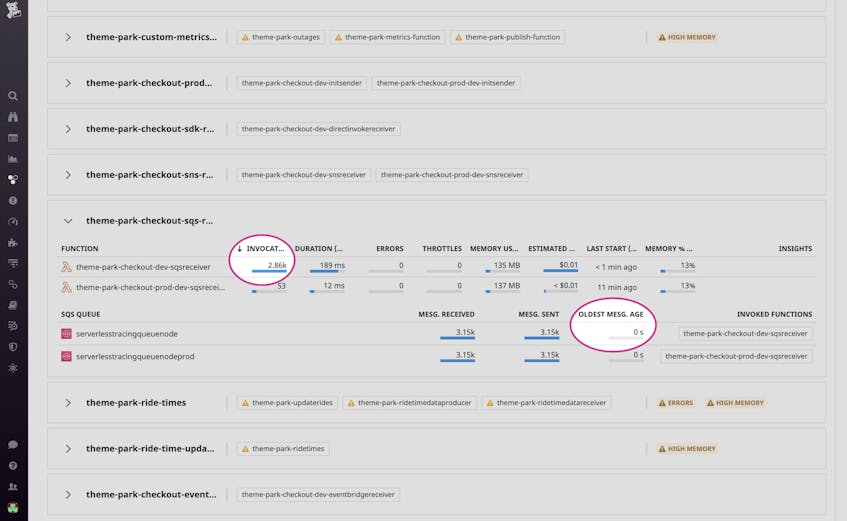
The Serverless view enables you to correlate high-level metrics from AWS resources with those of Lambda functions, so you can quickly spot issues and jump-start your investigation. In the example below, we can see that one of our Lambda functions is frequently invoked, which is causing our cloud costs to increase. But the age of the oldest message in the SQS queue that invokes the function is 0 seconds, which indicates that SQS is not under heavy load.
By clicking on the queue, we can seamlessly pivot to the default dashboard for SQS and view additional statistics on message and queue activity. As our application is not latency-sensitive, we can increase the queue’s batch size, such that more requests are processed by each Lambda invocation—reducing invocation count and costs.
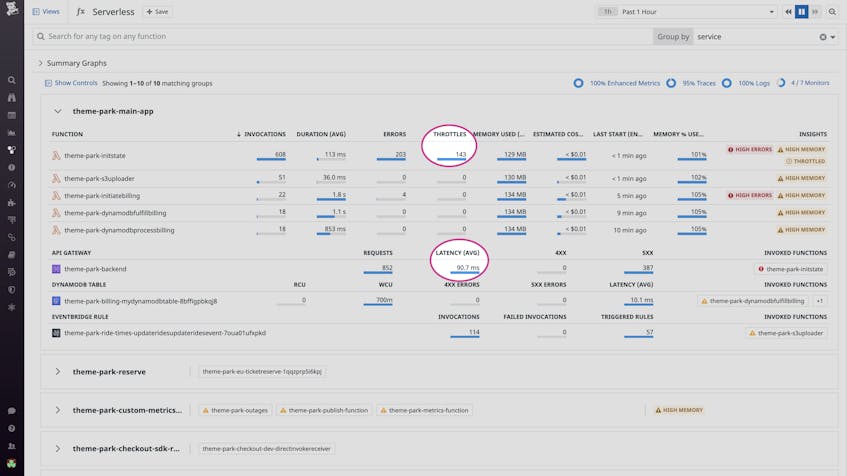
Or, say that in a different case, a monitor alerts us of elevated latency in API Gateway. In the Serverless view, we can immediately see that the theme-park-initstate function, which is invoked by our API, is experiencing increased throttling.
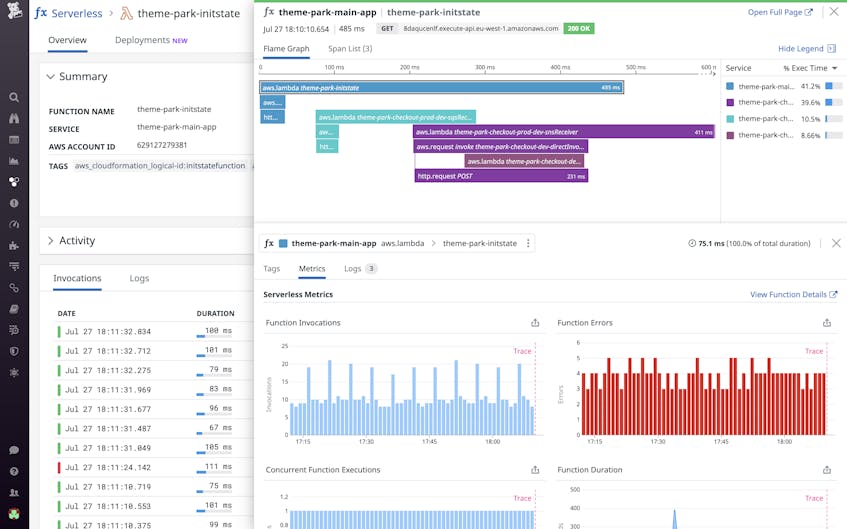
To investigate, we can click on the problematic Lambda function to view a full list of its invocations, along with key metrics, traces, and logs. Datadog APM visualizes Lambda functions and the AWS resources they invoke all in one trace, so we can track the flow of requests across our distributed architecture and determine whether the issue has propagated to downstream resources.
Start monitoring your serverless applications in the Serverless view
All customers can now group their serverless resources using any tag in the new Serverless view. At this time, only Python and Node.js functions are tied to their related resources, but we plan to add support for more runtimes in the future. To get started, enable Datadog APM for tracing and ensure you’re running Lambda Library v28+ for Python and v49+ for Node.js. Or if you’re already using AWS X-Ray to trace your applications, all you need to do is add the Lambda Library to your functions.
New to Datadog? Get started with a 14-day free trial today.
