

Since its release in 2013, React.js has become one of the most popular solutions for building dynamic, highly interactive web app frontends. React’s declarative nature and component-based architecture make it easier to build and maintain single-page applications.
While single-page React apps can provide powerful user experiences, they also introduce potential monitoring challenges. For example, because single-page apps make it easier to dynamically generate new views to facilitate seamless navigation, you might find yourself with greater volumes of route change data that’s more difficult to glean insights from. And with more application logic processed on the frontend, it’s important to collect as much context around errors as possible. Finally, if you’re leveraging React to create more dynamic UI elements, it’s paramount to track user actions appropriately, including all the context you need to track, triage, and troubleshoot issues.
To help navigate these challenges, Datadog’s Real User Monitoring team has built a set of React components you can adapt and integrate into your applications to get more granular data—and therefore better insights—from your instrumented React apps. In this post, we’ll show you how to use these components to:
- Get cleaner user page view data with the React Router Tracker component
- Get better context around errors with the Error Boundary component
- Append stacktraces and custom attributes to recorded user actions with the Context Provider component
Consolidate your view paths
React Router lets you generate routes dynamically as your application renders. This simplifies development because you don’t need to declare static routes beforehand, which helps you easily compose, for example, multiple sets of valid routes for different devices or screen sizes.
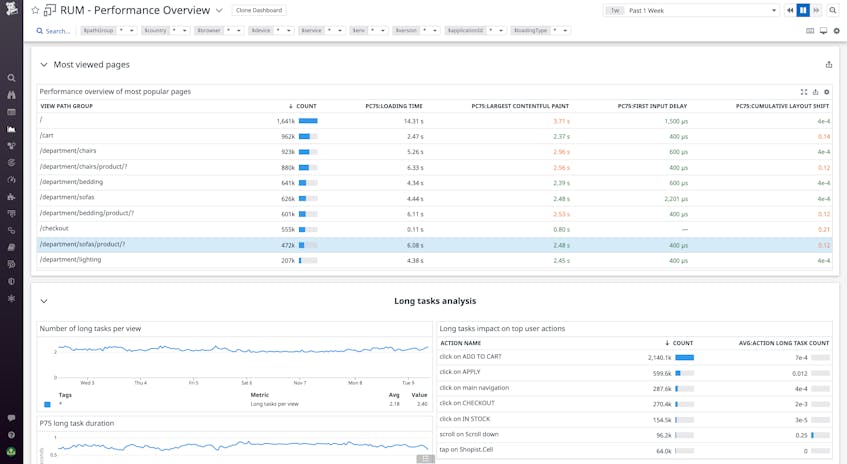
Monitoring route changes is essential for getting a full picture of user traffic on your site, including things like page view counts, how long users spend on a page, and common user flows. Collecting route change data at the URL level—that is, by marking a route change each time the URL is updated—can be sufficient for capturing all browser activity, but it can lead to messy data that’s difficult to parse for insights. For example, on an e-commerce site, you might have a product view with a unique URL for each product ID (e.g., /tables/product/:id). In your RUM data, this would create a separate view path for potentially thousands of different products. If you wanted to compare, for example, page view counts between your product and checkout views, you’d have to aggregate all of these product view paths to get a valid comparison.
With the React Router component, you can define a convention for your view paths so that a new RUM view is created each time the router is invoked. This ensures that your RUM data aligns with the way you define pages in your application. Because this component inherits the same props available on its counterpart in the original React Router library, your implementation doesn’t need to change much. Just use the <RumRoute /> component in your route change definitions, like so:
MyApp.js
import {
BrowserRouter as Router,
} from 'react-router-dom';
import { Menu } from './Menu';
import { Cart } from './Cart';
import { Department } from './Department';
export function App() {
return (
<div className="App">
<Router>
<Menu>
<RumRoute path="/">
<Home />
</RumRoute>
<RumRoute path="/department/:name/product/:id">
<Department />
</RumRoute>
<RumRoute path="/cart">
<Cart />
</RumRoute>
</Menu>
</Router>
</div>
);
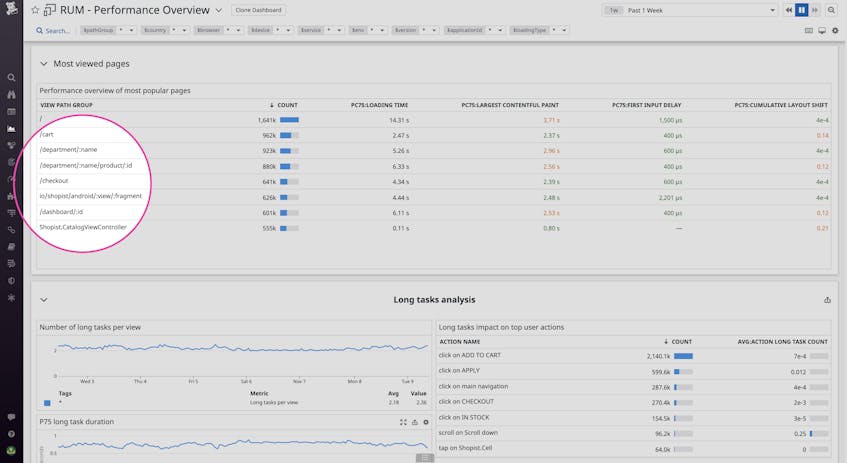
}Now, your view names are simplified and follow the conventions you define in your routing structure. This enables you to easily make apples-to-apples comparisons between relevant view categories and ensures that your view path names in RUM precisely follow their definitions in your router.
Get more context around errors
When adding error handling to your React apps, you want to appropriately catch each error, log relevant context for debugging, and prevent the rest of your application from crashing. In vanilla JavaScript, this is traditionally accomplished using try-catch blocks. But to implement this in a way that preserves React’s declarative architecture, Facebook added the Error Boundary feature to React 16 in 2017.
Error boundaries are React components that catch JavaScript errors anywhere in their child component tree, both during rendering and within the lifecycles of any nested components. Using error boundaries, you can wrap a component (or group of related components) with a safe fallback that:
- Properly dismounts to a user-friendly error message UI instead of displaying the component tree that crashed
- Emits the full context of the error, including the whole stacktrace within the boundary
To get this important context into your React error logs so you can send them to Datadog for analysis and monitor them in Error Tracking, we built an Error Boundary component that works like the one shipped with React 16+, with the added benefit of automatically forwarding all its log data to Datadog. Simply wrap the parent component of the UI object you want to handle errors for using the <ErrorBoundary /> element.
MyApp.js
import { Cart } from './Cart';
export function Checkout() {
return (
<div className="Checkout">
<Menu />
<ErrorBoundary
fallback={(error) => <div>Unable to load shopping cart: {error.message}</div>}
>
<Cart />
</ErrorBoundary>
</div>
);
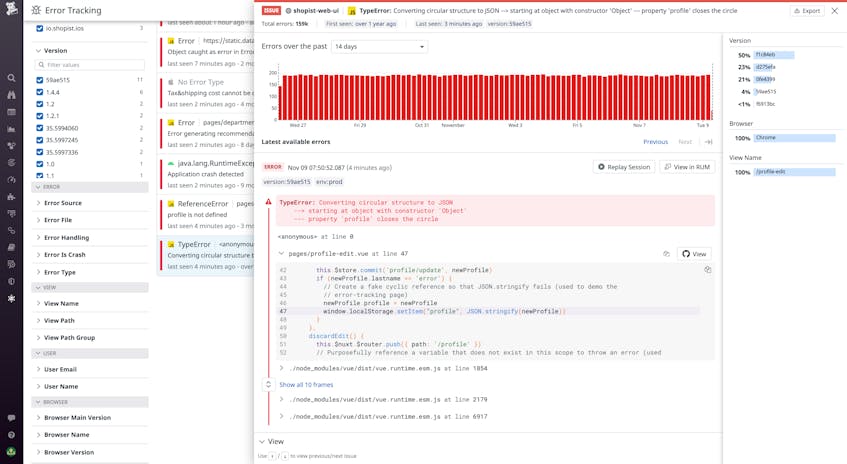
}When performing root-cause analysis of an issue in Error Tracking, for example, you now have a stacktrace of the error and a breadcrumbs trail identifying each component above the one that failed on the hierarchy and within your defined error boundary. This provides much more context into what path the user took that resulted in the error, as well as key state information to help you resolve the bug.
Add more context to user actions
By tracking user actions you can get a complete picture of what page elements a user clicked on or submitted input to and how long each of these actions took. This helps you quantify feature adoption, understand the performance of key UI elements, and identify the steps that led to a specific browser error. Datadog RUM tracks user clicks by default. But in a React application, where UI elements are often comprised of multiple nested components, it’s useful to have deeper context for exactly which components were invoked leading up to the action—especially when the action triggers an error. By instrumenting your components with our new RUM Component Context Provider, you get a full breadcrumb path of the components that the user traversed to form the overall context around the action. You can also define custom attributes to help you label your actions with key data (e.g., including the name of a button pressed, or appending the product ID of an item being purchased).
You can wrap any class components you’d like to instrument with the <RumComponentContextProvider /> component. Or use the <WithRumComponentContext /> HOC for any function components. Any components you wrap will show up in the breadcrumb trail for triggered errors or actions further down the chain. Then, using the included useRumAction and useRumError hooks, you can generate actions and errors in RUM for specific cases of your component logic.
MyApp.js
const App = WithRumComponentContext("AppComponent", () => {
  const addAction = useRumAction("trackingAppAction");
  const addError = useRumError();

  return (
    <div className="App">
        <Button
            onClick={() => addError('new Error from root.AppComponent')}
        >
            Generate Error from root.AppComponent
        </Button>
        <Button
            onClick={() => addAction('new Action from root.AppComponent')}
        >
            Generate Action from root.AppComponent
        </Button>
    </div>
  );
})
Using the built-in value and label fields as props in your declaration, you can also add custom attributes to help describe what the user is doing. For example, if you’re tracking an “Add to Wishlist” button on an e-commerce site, you can add Saved to wishlist as a label to ensure that this context is preserved when viewing the action within Datadog.
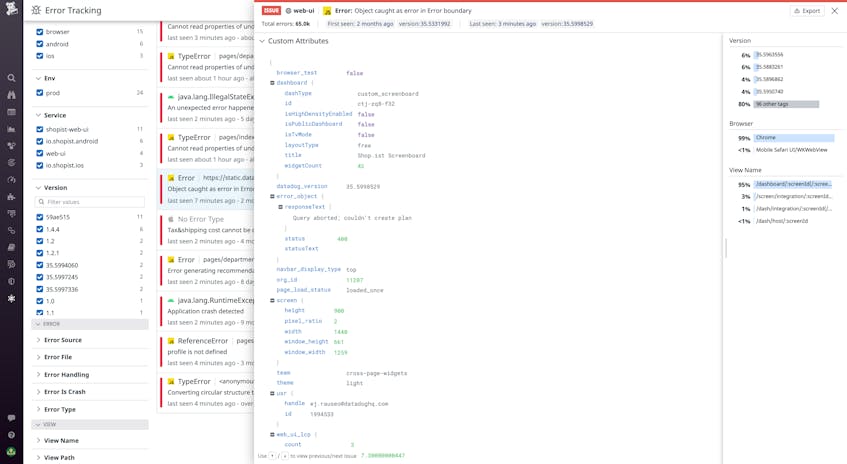
In Datadog RUM, you can easily view this data in the “Custom Attributes” of the action. You can also see a detailed performance waterfall, user info (such as device, browser, location), related backend traces and logs, and more. This way, you get all the context you need to understand the path your user took through the UI, as well as how your application performed in response.
Tune up your React data collection
With Datadog RUM’s React support, it’s easy to enrich your React app’s recorded route changes, user actions, and errors with comprehensive context to help you understand user behavior and track, triage, and debug issues. All three components are open source, and can easily be integrated with your existing applications. See our Github repository to view the source code, as well as detailed setup instructions. For more information about Datadog RUM, see our documentation. Or, if you’re brand new to Datadog, get started with a 14-day free trial.
