Casey Culligan

Meaghan Vella

Addie Beach
SQL Server AlwaysOn availability groups provide database clusters that streamline automatic failovers and disaster recovery. With AlwaysOn clusters, you can leverage reliable, high-availability support for your services. However, AlwaysOn groups can be problematically complex, spread over servers and regions with multiple points of failure in each cluster. This makes it difficult to understand what’s happening in your groups at any given time and troubleshoot when issues occur.
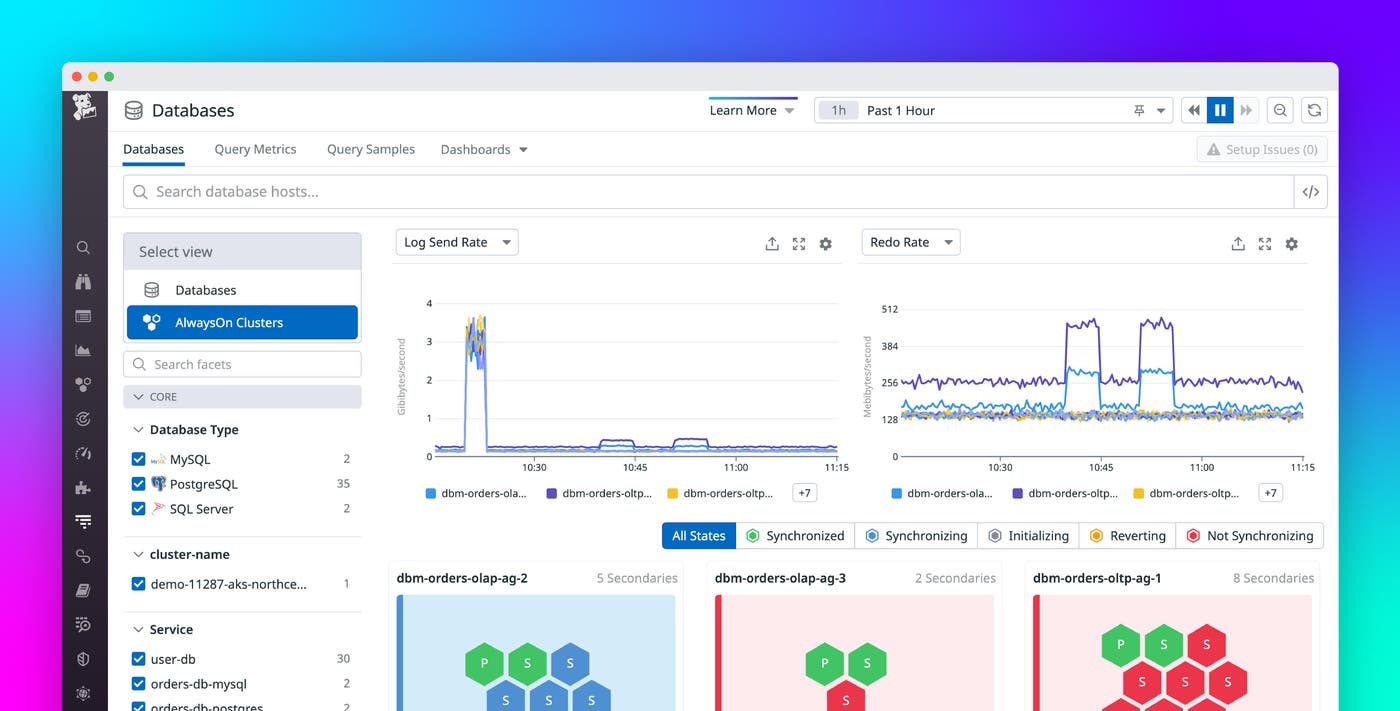
By using the AlwaysOn view in Datadog Database Monitoring, you can access high-level overviews of your SQL Server AlwaysOn availability groups to quickly assess database health at any given time. Color-coded visualizations help you monitor the state of your nodes and prepare for possible failovers, and historical data for each node in your AlwaysOn clusters provides additional context for troubleshooting. All of these features complement Datadog’s existing SQL Server support in Database Monitoring at no extra charge. In this post, we’ll explain how the AlwaysOn view enables you to:
- Prepare to handle failovers with node status details
- Analyze historical metrics to investigate cluster bottlenecks and failures
Prepare to handle failovers with node status details
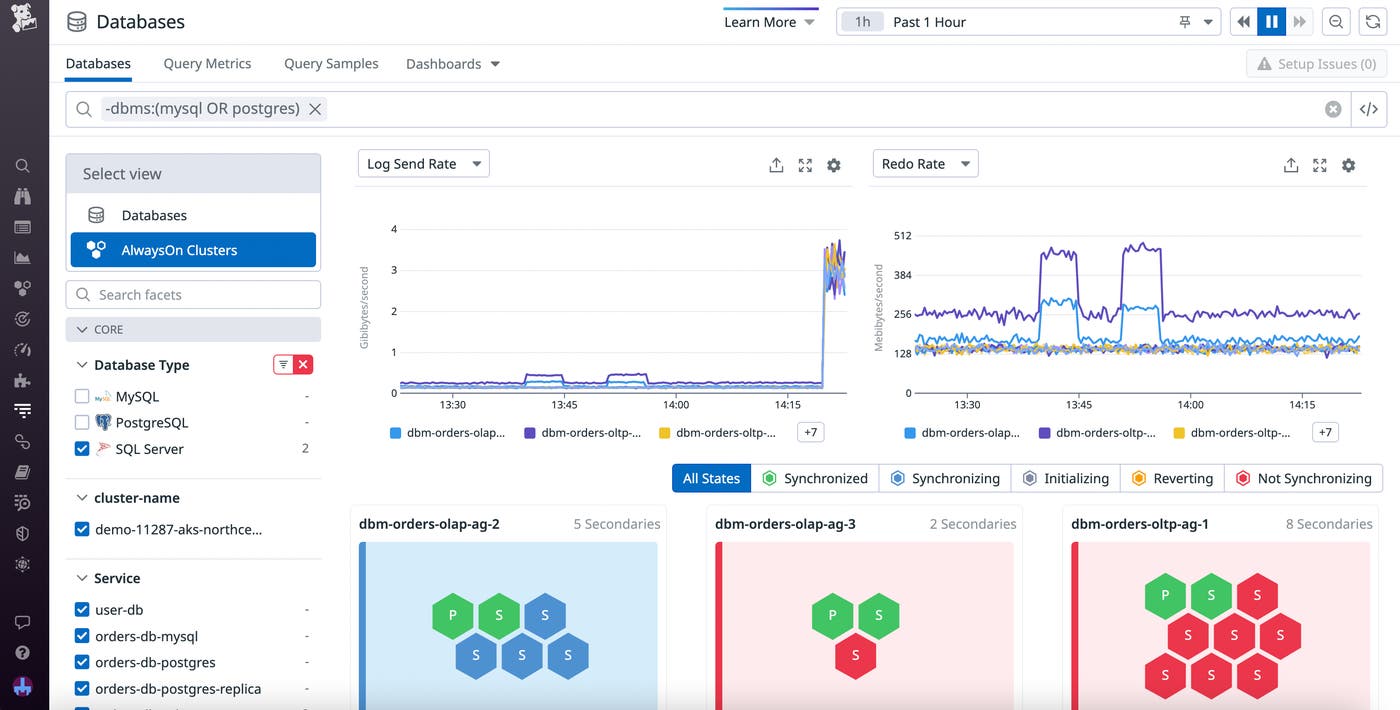
AlwaysOn availability groups consist of one set of read-write primary databases and up to eight sets of readable secondary databases, any of which can replace the primary node in the event of a failover. With the AlwaysOn view in Database Monitoring, you can quickly determine the state of all the nodes in your availability groups at once. As shown in the following screenshot, every node is clearly labeled as primary or secondary so you can understand its position in the cluster, and the nodes are color-coded according to their current status: synchronized, synchronizing, initializing, reverting, or not synchronizing.
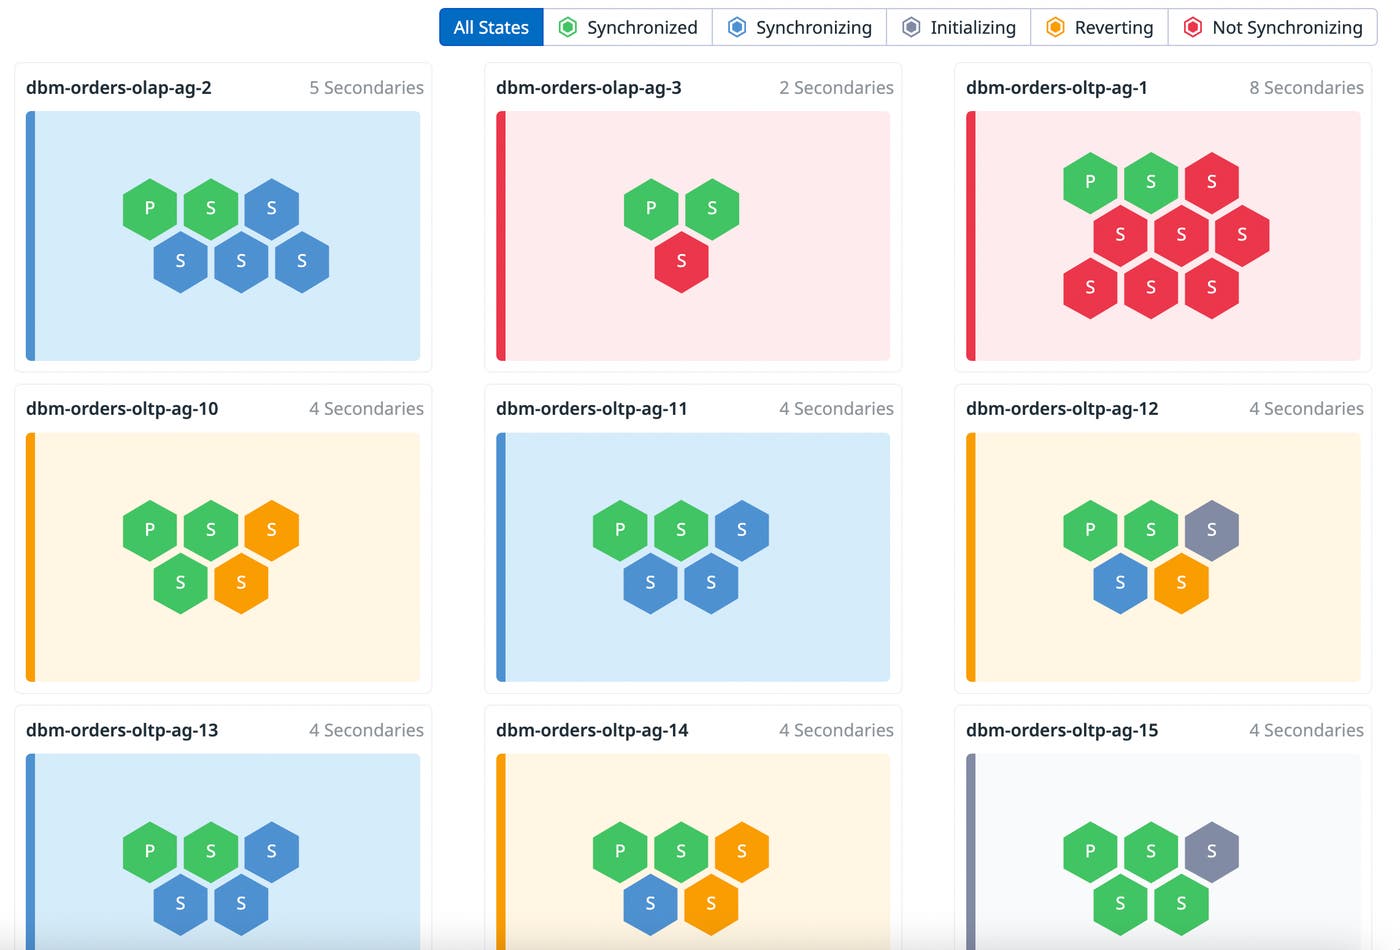
You can filter your availability groups based on node state, helping you quickly surface clusters that are experiencing issues. The AlwaysOn view also comes with out-of-the-box timeseries graphs for log, redo, and secondary lag time metrics, enabling you to spot unusual performance activity in your clusters.
Additionally, you can set up monitors to alert you when your nodes fall out of sync or when a key performance metric exhibits unusual behavior. This information helps you anticipate primary or secondary node issues and ensure that you have the resources to effectively handle them. For example, let’s say that you receive an alert that log send rates have suddenly dropped on one of your primary nodes, signaling a potential failover. By accessing the clusters in the AlwaysOn view, you can confirm that the secondary nodes are synchronized and ready to take over for the primary while you figure out what went wrong.
Analyze historical metrics to investigate cluster bottlenecks and failures
When you want a comprehensive picture of your database health, you can view historical metrics for every node in your AlwaysOn availability groups. By selecting a cluster, you can access a timeseries of past synchronization states for this availability group, categorized by node. You can also view send, redo, and lag metrics for each of the secondary nodes. This information (shown in the following screenshot) helps you spot nodes that have been experiencing issues, as well as perform investigations into failures and bottlenecks.
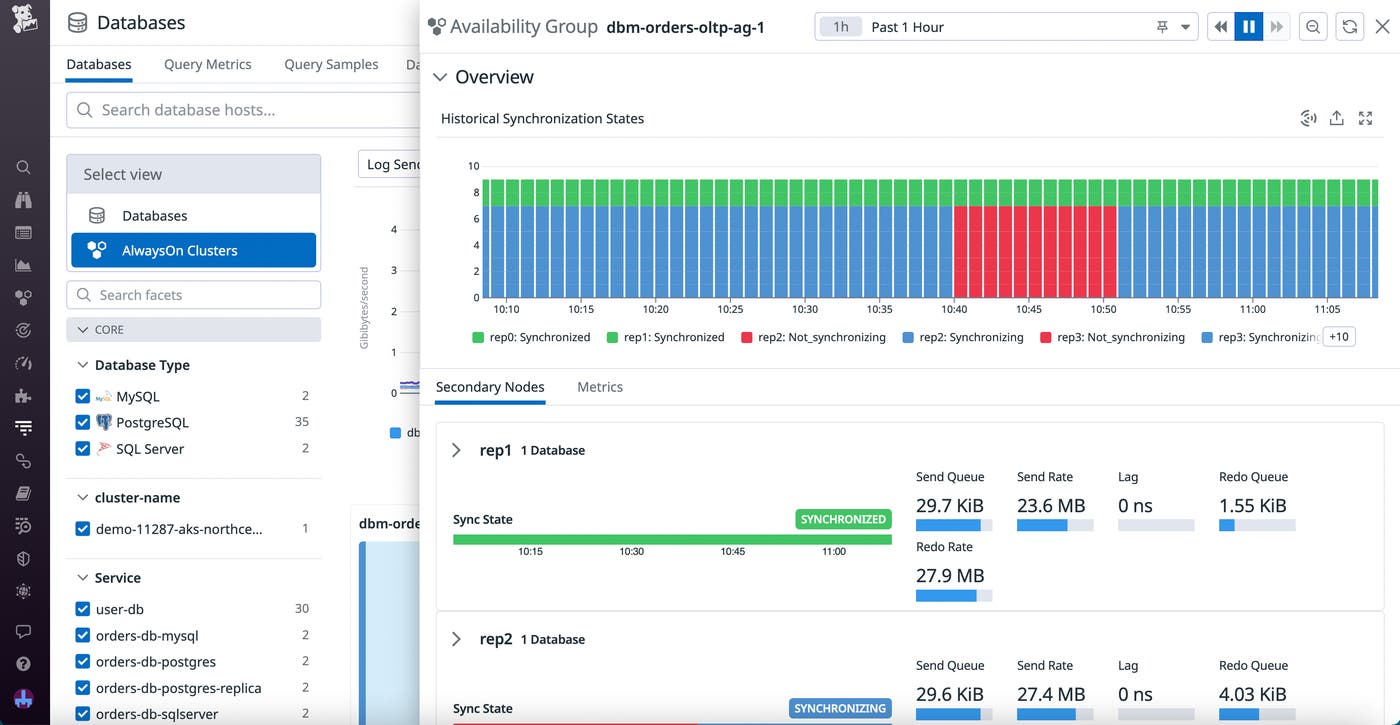
Let’s say that you’re analyzing a recent failover that resulted in data loss that exceeded your recovery point objective (RPO). You access historical metrics for this cluster using the AlwaysOn view and see that several of the nodes frequently fell out of sync. You note the host information for the nodes and decide to investigate whether there were recent issues with these servers. You can then bring these findings back to your team and come up with strategies for scaling your infrastructure, helping you prevent future latency and provide support for your databases.
Start monitoring your AlwaysOn availability groups with Datadog
With easy-to-read visualizations and historical metrics for every node in your AlwaysOn availability groups, the AlwaysOn view in Datadog Database Monitoring enables you to quickly determine the health of your clusters. This information helps you troubleshoot potential bottlenecks and ensure that your clusters are prepared to handle failovers at a moment’s notice.
If you’re an existing customer, use our documentation to get started. Or, if you’re not yet a customer, you can sign up for a 14-day free trial today.
