


Stephanie Niu

Paul Gottschling
When investigating a complex system—or learning about it for the first time—you need to explore metrics, traces, logs, and other kinds of data. But as you navigate across different views of your data in dashboards, alert notifications, flame graphs, and so on, it can be hard to keep track of what you have already seen. When a potential issue comes up and time is tight, the last thing you need is to spend time remembering a crucial graph or finding the right browser tab.
The Datadog Clipboard streamlines investigation by capturing relevant views of your infrastructure and applications in a single place. You can access the information you copied from the bottom of your screen as you navigate to other pages, and export items from the Clipboard to new or existing incidents, Notebooks, and dashboards.
The signals that you can copy to the Clipboard include:
- dashboard widgets with existing copy-paste functionality
- URLs of specific views within Datadog, such as the Log Explorer or an APM service page
The Clipboard works on all pages of Datadog, and it will automatically store up to 20 signals even when it is not open.
Context where you need it
The Datadog Clipboard helps you explore and troubleshoot more easily by letting you organize findings from your investigations in one place—without having to remember interesting signals or clutter your browser with tabs. You can select relevant signals, and then use them to:
- Contribute new findings to an ongoing incident—or declare a new incident
- Create resources that you can share with your team
- Streamline the process of building or editing dashboards
Frictionless troubleshooting
You can use the Datadog Clipboard to organize your findings while investigating an incident, so you can focus on discovering root causes. For example, if you see signs of an issue within a Watchdog story’s details panel, an alert status page, or a Security Signal Panel, you can copy the URL to the Clipboard, along with any helpful graphs, and declare an incident right away—with all of the signals you have selected.
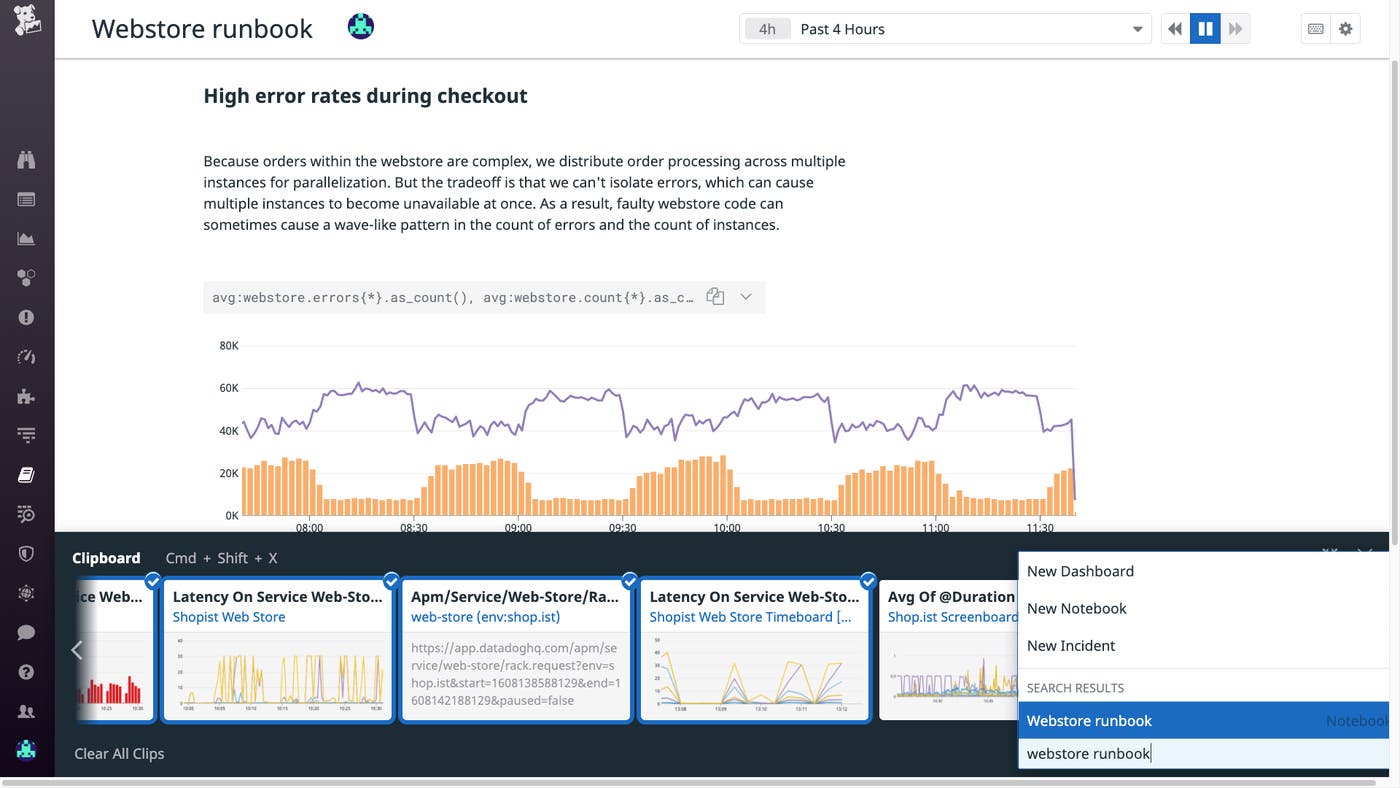
And as you’re investigating an ongoing incident, you can store signals in the Clipboard as you discover them. Use the search box to look up an incident to add signals to (as shown below). When you export signals to the incident, Datadog will automatically add them to the incident’s timeline.

From explorations to shared resources
Whether you have joined a new team or are designing a new service, you often need to gather data from different contexts while building an overall picture of your infrastructure and applications. The Datadog Clipboard streamlines this process by letting you gather relevant signals without leaving your current Datadog tab.
As you explore your team’s resources, any graphs you copy are automatically stored in the Clipboard. You can easily export these graphs to a Notebook. Notebooks can serve as personal guides or resources to share with your teammates, who can edit them in real time and add comments for discussion. This way, you can use the Clipboard to easily create runbooks, allowing teammates to benefit from your research when deploying a new service, scaling up a cluster, or verifying that a service can communicate with a new dependency.
In this example, we are adding signals to an existing runbook from the Clipboard as we learn more about one of our services.
Easier dashboard creation
You can also use the Datadog Clipboard to create dashboards more efficiently. For example, let’s say you are deploying a new feature and want to understand how your users interact with it. While browsing through Datadog—e.g., graphs of RUM analytics data or browser logs—you copy widgets to the Clipboard. Once you’ve amassed a complete picture of your data, you select the signals you want to export, then click “Add to a new dashboard.” Datadog will automatically create a dashboard from the selected signals.
Copy, paste, share
The Datadog Clipboard makes it possible to explore views of your data while keeping distractions to a minimum, so you can easily build an overall picture of your infrastructure and applications. You can open the Clipboard while using Datadog by pressing Cmd/Ctrl + Shift + K on your keyboard. The Clipboard is one of the many ways that Datadog visualizes metrics, traces, logs, security signals, and other data in a single platform. If you don’t have a Datadog account, you can sign up for a free trial.


