
To optimize its cloud investments, your organization needs internal stakeholders to act on shared knowledge about its cloud costs and cloud usage. But in practice, it’s difficult for organizations to gain a high degree of clarity about their cloud spending. The factors contributing to cost data are not normally visible to all stakeholders, and it’s often impossible to attribute costs to the teams, services, and applications that incurred them. Additionally, engineering teams have lacked a way to view cost data in the context of the telemetry they already use for maintaining the performance and reliability of their services. Without side-by-side visibility of metrics and cost data, engineers cannot readily associate changes such as code deployments, infrastructure modifications, or traffic spikes with the effect those changes have on cloud costs.
To solve these problems and help your teams gain a clear understanding of cloud costs, we are pleased to introduce Datadog Cloud Cost Management. Cloud Cost Management gives teams across your organization a holistic view of their cloud costs, fostering a collaborative understanding of those costs and helping to drive effective decision-making. For example, cloud cost managers can see and analyze changes in your cloud bill to explain current costs and reduce future costs through the strategic selection of discount programs. And engineering teams—who often spin up cloud resources and incur costs without a conventional purchasing workflow—gain the visibility they need to maximize the cost efficiency of their services.
In this post, we’ll show you how Cloud Cost Management can:
- Give your organization deep visibility into your cloud costs
- Get fast feedback on how application and infrastructure changes affect your cloud costs
- Build a culture of cost awareness within your engineering teams
Improve your cloud cost visibility
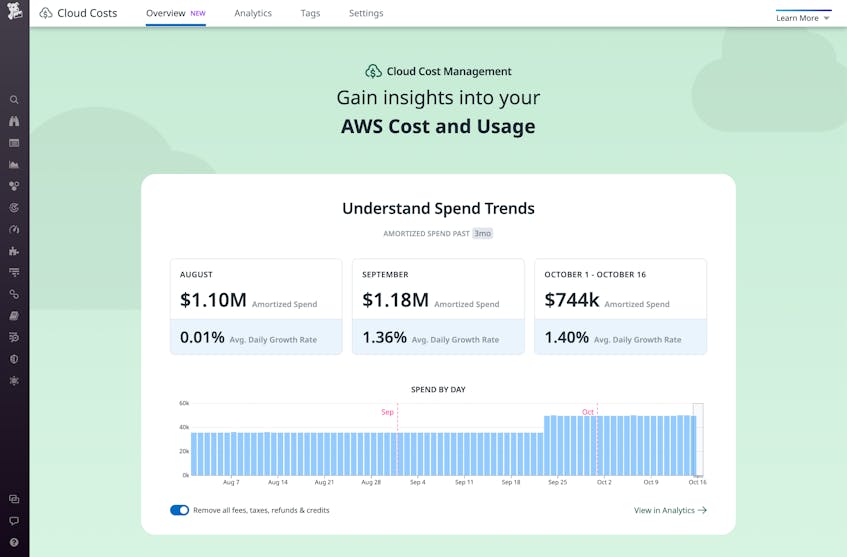
The cost information provided by AWS—including the Cost and Usage Report (CUR) and AWS Cost Explorer—shows you your costs for AWS resources over a given period of time. You’re able to view your AWS charges as different cost types, including:
- blended
- unblended
- net unblended
- amortized
- net amortized
- on-demand
These cost types present a picture of the fixed, variable, and discounted costs that make up your bill and give your FinOps team the visibility they expect according to standard accounting practices. But this cost breakdown doesn’t show you how your organization has used those AWS resources.
Cloud Cost Management automatically tags your cost data with your custom AWS Resource tags and your CUR. Thanks to this tagging of cost data, your organization can now allocate your costs to see which of your applications, services, and teams are responsible for them. For example, you can see how much a given AWS resource costs to operate and how much of your organization’s AWS costs are attributable to each team. You can also learn how each team uses shared AWS resources—such as an EKS cluster that’s used by several teams—and what percentage of the resource’s total cost is attributable to each team.
The screenshot below shows the Cloud Cost Analytics page, displaying amortized AWS costs (aws.cost.amortized) filtered to show costs related to RDS and grouped by the aws_resource_id tag. We can see that costs for this RDS resource in the current period have increased by $204,000—or 358 percent—from the previous three-month period.
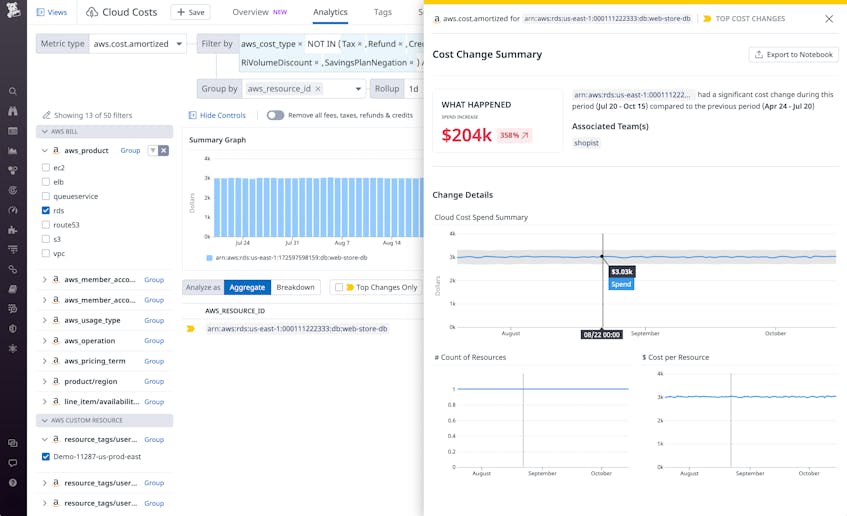
The Cloud Cost Analytics page provides additional advantages to both managers and engineers by giving them the ability to slice and dice cost data. For example, a visualization like the one shown above can help cloud cost managers plan purchases of RDS Reserved Instances. It can also help engineering teams understand how they can improve the cost efficiency of their services.
Quickly see how changes you make affect your cloud costs
When your engineering teams deploy a code revision or an infrastructure modification, they need quick, clear feedback to understand how that change affects their service’s key performance indicators—including its associated cloud costs. Datadog Cloud Cost Management allows you to visualize the change in your rate of cloud spending over time. You can use tags to filter your costs in the Analytics page and scope your data to any dimension you care about, such as team, service, AWS account, or AWS product.
This functionality gives engineering teams a tight feedback loop between their actions and their cost efficiency, enabling them to quickly identify root causes of changes in their cloud spend. A change that leads to increased cloud spending may need to be refactored or rolled back. Or—if that change also leads to an increase in successful checkouts or an improved user experience—the team may decide that the increased cost is an effective way to spend their cloud budget.
Visualize the cost impact of an infrastructure change
As an example of an engineering team making an infrastructure change, let’s assume a team operates a service called web-store that uses Amazon RDS as a data store. In an effort to improve query performance and the end-user experience, the team increases the number of RDS instances supporting the service and upgrades to a larger instance type.
Through Cloud Cost Management, team members can quickly see an accounting of these cloud infrastructure changes and how the changes have affected RDS costs. To view this information, on the Cloud Cost Analytics page, they group data by the service and aws_product tags and then select web-store with rds. As shown below, the Cost Change Summary view then shows the associated increase in recent spend, the number of RDS instances, and the cost per instance.
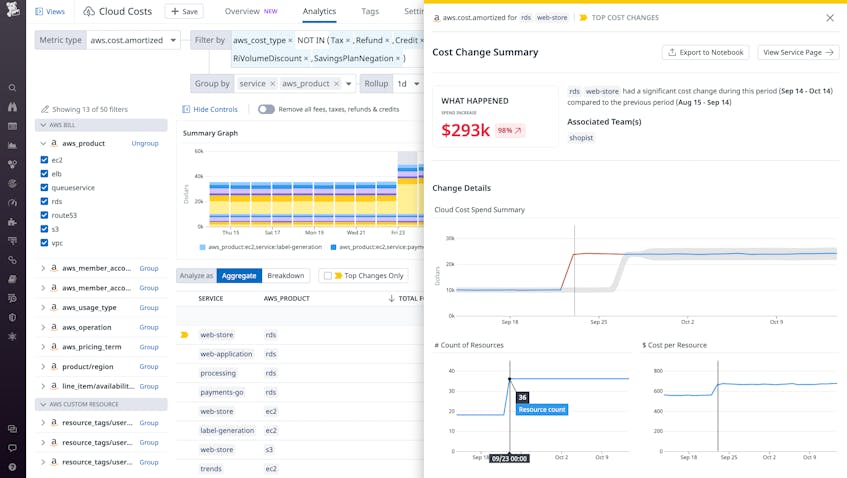
To ensure that the additional infrastructure expense is well-advised, the team can also monitor the service’s performance against an SLO that tracks query latency. For even more insight, they can monitor their customers’ journeys to watch for a decrease in abandoned shopping carts.
Map cost changes to usage patterns
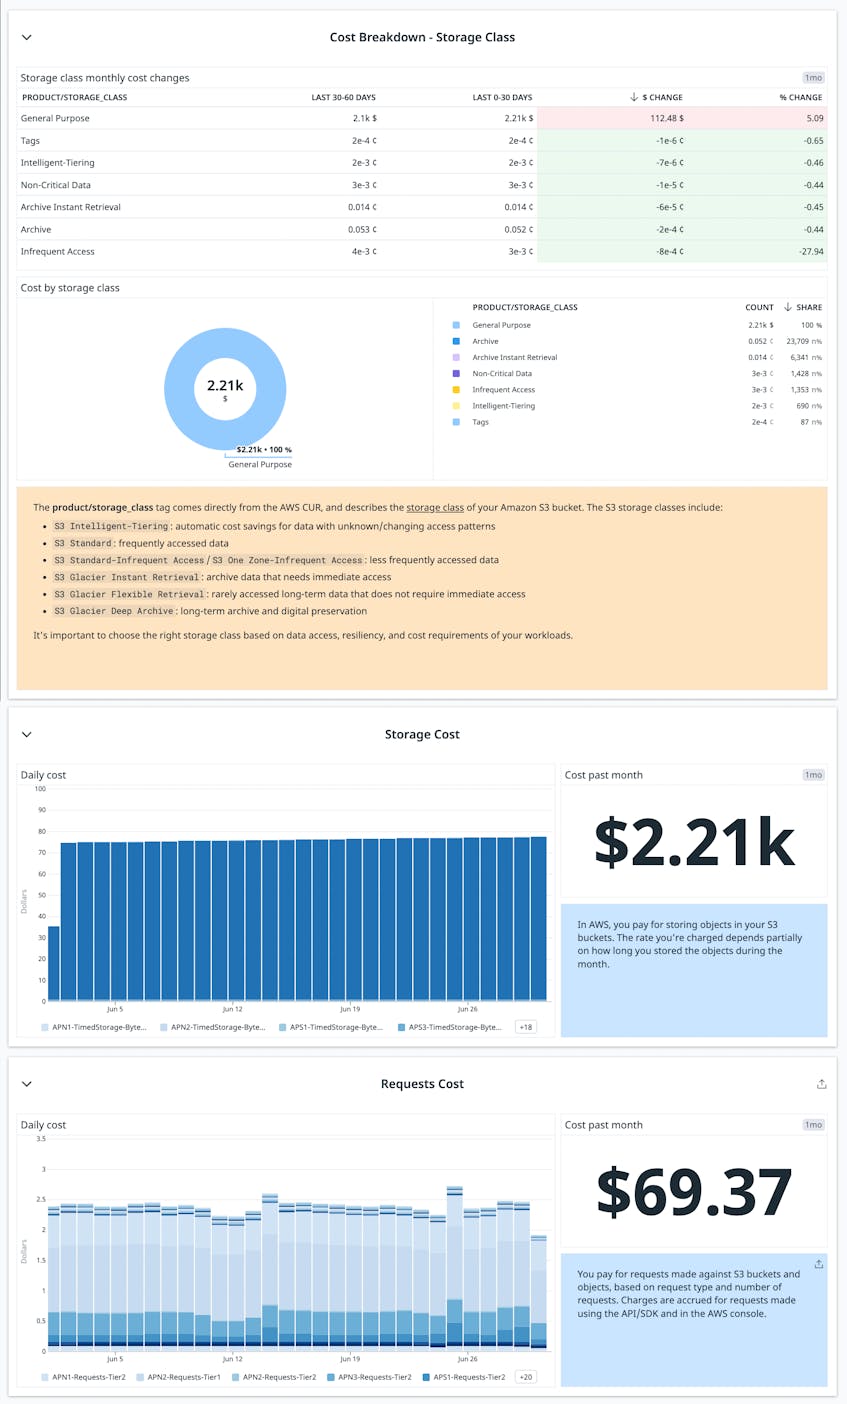
Cloud Cost Management also helps you see how usage affects a service’s costs. This aspect of cloud cost visibility is important because usage patterns can affect cloud costs even if you haven’t deployed changes to the code or the infrastructure. For example, Amazon S3 costs can fluctuate as changes in users’ data access patterns can cause S3 Intelligent-Tiering to shift data from one data access tier to another. This can cause a change in a team’s cloud costs that doesn’t correspond to any change the team has made.
Self-service access to cloud cost data can help the team understand and, if necessary, address the cause of cost variance of this sort. In the screenshot below, the S3 out-of-the-box dashboard shows a cost breakdown by storage class. The table makes it easy to see the difference in costs for each storage class over the last two months, and the pie chart visualizes the relative costs for each storage class.
Establish a culture of cost awareness
By giving engineering teams visibility into cost data, Cloud Cost Management empowers them to add accountability for cost efficiency to their operations and culture.
As part of the Datadog platform, Cloud Cost Management aligns with how your engineering teams already monitor their services. This natural integration enables teams to frictionlessly incorporate cost data as a measure of efficiency in the same way they use other metrics. For example, teams can create dashboards that combine cost data with custom metrics to track unit economics—the organization’s cost to accomplish a goal such as a checkout or a user signup. With deep visibility into cost data alongside the rest of your monitoring data, engineering teams can partner with your organization’s cloud cost owners to optimize costs, just as they partner with technical teams such as SRE to optimize performance.
As your engineering teams adopt cost efficiency as a team-wide focus, they can develop a culture of cost awareness, using cost metrics to guide their priorities and measure their gains. In this way, Cloud Cost Management gives teams the visibility they need to become as focused on cost optimization as they are performance and reliability.
Understand and optimize your AWS spend with Cloud Cost Management
Datadog Cloud Cost Management expands your organization’s ability to control cloud costs by giving your teams granular cost data and flexible dashboards to visualize your expenditures. FinOps and engineering teams can break down cloud costs by application, service, and team; determine the root cause of cost changes; and work together to optimize your services and ensure an effective cloud spend.
See our documentation to learn how you can leverage Cloud Cost Management in the Datadog platform, alongside the infrastructure, application, network, and security monitoring your teams already rely on. If you’re not already using Datadog, you can start today with a 14-day free trial.