


Paul Gottschling
In Part 1, we looked at metrics and logs that can give you visibility into the health and performance of your Consul cluster. In this post, we’ll show you how to access this data—and other information that can help you troubleshoot your Consul cluster—in four ways:
- Running CLI and API commands to retrieve information on demand
- Configuring sinks to collect and visualize Consul metrics
- Logging events from throughout your Consul cluster
- Using a browser-based UI as well as the Consul API to monitor the health of nodes and services running in your cluster
Commands for on-demand overviews
Consul provides a built-in CLI and API that you can use to query the most recent information about your cluster, giving you a high-level read into Consul’s health and performance. And you can use the consul debug command to produce a rich cross-section that includes logs, benchmarks, and telemetry data, including snapshots of the metrics we introduced in Part 1.
The /status endpoint and list-peers command
Each Consul agent runs a local API and CLI that allow you to perform management tasks and retrieve data about your cluster. Both techniques can help you troubleshoot disruptions to Raft and losses of cluster availability. One Consul API endpoint, <CONSUL_ADDRESS>/v1/status, provides information that can help diagnose Raft-related availability issues. In addition, Consul CLI commands can help you troubleshoot losses in Raft quorum—Raft-based consensus cannot take place when the number of Consul servers has become less than half the size of the peer set plus one.
You can send a GET request to the <CONSUL_ADDRESS>/v1/status/leader endpoint to return the network address of the current leader node and check whether Consul is currently leaderless:
curl localhost:8500/v1/status/leaderThe response is a single IP address followed by a port, such as:
206.189.229.121:8300In the case of a leaderless cluster, the response will be an empty string:
""You can also use the list-peers command to get insights into a loss of cluster quorum. Using the following command allows you to obtain a list of IP addresses for servers within the cluster, as well as the their node names and other information.
consul operator raft list-peersThe response will resemble the following, indicating that there are three servers in the cluster, and the cluster currently has a leader (consul-demo-server-1).
Node ID Address State Voter RaftProtocolconsul-demo-server-3 dba2dd26-f417-b3da-17c1-47bdc4c8a785 198.199.66.69:8300 follower true 3consul-demo-server-1 7cfd4df5-dd15-c191-e7db-d8128066f896 198.199.91.25:8300 leader true 3consul-demo-server-2 127aa843-78f5-7eb3-4b21-88c5ebeb7730 198.199.86.66:8300 follower true 3Go deep with consul debug
The consul debug CLI command monitors your Consul cluster for a configurable period of time (two minutes by default, over 30-second intervals) and writes the results to a tar.gz file. You can also specify the type of information to collect (e.g., agent configuration details, host resources, telemetry metrics, and DEBUG-level logs). consul debug gives you a trove of health and performance information, allowing you to gather as much context as possible when you notice an issue.
The consul debug command will return a link to a tar.gz file. The unpacked directory includes a number of files. Here is an example of the format you can expect (the actual list of files will be much longer):
consul-debug-1556041302consul-debug-1556041302/1556041302consul-debug-1556041302/1556041302/consul.logconsul-debug-1556041302/1556041302/goroutine.profconsul-debug-1556041302/1556041302/heap.profconsul-debug-1556041302/1556041302/metrics.jsonFiles ending in .json include both statistics and configuration details, depending on the file. For example, you can use the contents of metrics.json to get the values of Consul metrics collected during the debug interval. Files with the .prof extension include profiling information that you can use to visualize execution traces. And files ending in .log are standard Consul logs.
Metrics dumps for on-demand monitoring
As one result of consul debug, Consul will dump the values of metrics collected over the sampling interval to the file metrics.json, outputting all of the aggregates available for that metric from Consul’s in-memory sink. This is useful for getting a full complement of Consul metrics at a specific moment in time.
For example, this output shows the latency of requests to one Consul API endpoint as well as the number of Gossip messages broadcast to other nodes in the cluster.
{ "Name": "consul.http.GET.v1.status.peers", "Count": 1, "Sum": 0.22652000188827515, "Min": 0.22652000188827515, "Max": 0.22652000188827515, "Mean": 0.22652000188827515, "Stddev": 0, "Labels": {} }, { "Name": "consul.memberlist.gossip", "Count": 70, "Sum": 1.250169008038938, "Min": 0.007327999919652939, "Max": 0.06497199833393097, "Mean": 0.017859557257699114, "Stddev": 0.008475803353512407, "Labels": {} },You can view a similar metrics dump by sending a GET request to the <CONSUL_ADDRESS>/v1/agent/metrics endpoint of the Consul HTTP API. Note that this output shows only the most recently collected metrics, rather than those collected during a user-specified interval.
Profiling Consul for fine-grained performance monitoring
As part of the debug command, Consul can use the Golang pprof profiling package to get detailed information about the performance of Consul’s subsystems (e.g., Raft and Gossip). You can enable profiling by setting enable_debug to true within your Consul configuration file, then stopping and restarting Consul.
If you enable profiling, the debug command will output files ending in .prof, which represent profiles of heap memory usage, CPU utilization, and execution traces. These files need to be opened with the pprof visualization tool included in a standard Golang installation. After installing Golang, you can run this command to enter the interactive pprof console.
go tool pprof <PATH_TO_PROF_FILE>You can use pprof to benchmark function calls within the Consul agent (or any other Golang application), allowing you to identify performance issues at a granular level. pprof can complement the performance metrics we introduced in Part 1, such as consul.raft.commitTime, by illustrating the source of delays within a specific operation.
As shown below, pprof generates an image that visualizes the order in which Consul calls various Golang functions, as well as the duration of each function call. This example shows a profile of CPU utilization. You can generate GIF and SVG files, as well as text outputs in a variety of formats. To generate a GIF file that maps out the 15 most pivotal functions within the call tree (based on what pprof calls an entropyScore), enter this command in the pprof console:
gif 15This command will produce an image similar to the following.
You can also filter nodes (i.e., functions) in the image to only those matching a regular expression, making it easier to see into Consul subsystems (Raft, Gossip, the KV store, etc.) that metrics have shown to be underperforming.
The consul debug command provides detailed information that is useful for investigating issues. However, because consul debug collects data for a limited period (beginning when you run the command), it’s not possible to see trends within their full historical context or to gather performance data about an event that has already occurred.
Configure telemetry sinks for comprehensive monitoring
While ad-hoc commands can provide helpful information about your Consul cluster, they don’t provide comprehensive visibility into all of the metrics we introduced in Part 1. You can configure a metrics sink to retain your Consul metrics beyond the default one-minute window. By retaining metrics for a longer period, you can track your metrics over time, compare them to metrics and logs from other parts of your infrastructure, and get more comprehensive visibility into your Consul cluster.
Consul uses the go-metrics library to expose metrics, and gives you flexibility in choosing where to send them, destinations called metrics sinks. You can then use your sink of choice to filter metrics and construct visualizations. In Part 3, we’ll show you how to configure a Consul metrics sink to visualize all of your metrics in Datadog alongside logs and request traces for alerting and troubleshooting.
You can specify a metrics sink in the telemetry section of your Consul agent configuration, whether by configuring each agent separately or using a configuration management solution. Different key/value pairs are required to point your metrics toward different sinks—for example, you would use statsd_address to indicate the address of a local StatsD server as shown in the following JSON snippet:
{ "telemetry": { "statsd_address": "127.0.0.1:8125"}You will need to stop and restart each Consul agent to load the new telemetry section. Once you do, each agent will report metrics to your new sink, using that sink’s functionality to aggregate and retain metrics. In the case of StatsD, for example, the sink will push new metrics to a queue, then flush the queue via a UDP stream to a user-specified StatsD server every 100 ms.
Get more visibility with Consul logs
Consul and its dependencies (Serf, Raft, and Memberlist) log state changes and events, and tracking these logs can expose trends that Consul does not surface through metrics. Consul does not provide metrics to track failed remote procedure calls across datacenters, for example, but it does record each failure in a log.
Logs include a timestamp and the name of the package from which they originate, making it easier to localize issues. The example below illustrates the types of logs that Consul might generate when booting server nodes for the first time:
2019/04/26 17:55:22 [INFO] consul: Found expected number of peers, attempting bootstrap: 67.205.153.246:8300,67.205.157.176:8300,142.93.118.146:83002019/04/26 17:55:22 [INFO] consul: Adding LAN server consul-demo-server-2 (Addr: tcp/67.205.157.176:8300) (DC: dc1)2019/04/26 17:55:22 [INFO] serf: EventMemberJoin: consul-demo-server-2.dc1 67.205.157.1762019/04/26 17:55:22 [INFO] serf: EventMemberJoin: consul-demo-server-3.dc1 67.205.153.2462019/04/26 17:55:22 [INFO] consul: Handled member-join event for server "consul-demo-server-2.dc1" in area "wan"2019/04/26 17:55:22 [INFO] consul: Handled member-join event for server "consul-demo-server-3.dc1" in area "wan"2019/04/26 17:55:28 [WARN] raft: Heartbeat timeout from "" reached, starting election2019/04/26 17:55:28 [INFO] raft: Node at 142.93.118.146:8300 [Candidate] entering Candidate state in term 22019/04/26 17:55:28 [INFO] raft: Election won. Tally: 22019/04/26 17:55:28 [INFO] raft: Node at 142.93.118.146:8300 [Leader] entering Leader stateSome logs include dynamically updated fields. For example, the Consul agent automatically logs an error when it fails to set up a watch (an automatic handler for changes in Raft-managed data), using the %v format (from Go’s fmt package) to print the default format of the err message passed to it (e.g., an error surfaced within user-defined script used as a watch handler).
logger.Printf("[ERR] agent: Failed to setup watch: %v", err)Consul logs contain three standard fields (timestamp, level, and package name), and a message that communicates specific details about an event. Because each message has its own format, with different values that are dynamically updated with every log event, it can be challenging to aggregate Consul logs. We’ll show you one technique for processing and analyzing your logs in the next part of this series.
Consul will write logs to STDOUT by default. If Consul is running in the background, you can use the consul monitor CLI command to stream logs to STDOUT until the command exits. This command automatically displays logs at a minimum severity of INFO; you can use the -log-level flag to revise this if needed:
consul monitor -log-level traceThis command will output logs to STDOUT at all log levels (since TRACE is the lowest).
Writing your logs to a file makes it possible to retain your logs and ship them to a centralized platform so you can search, analyze, and alert on them. To log to a file, you can use the log_file key within a Consul configuration file, or the -log-file option when running the Consul agent on the command line, for example:
consul agent -log-file /var/log/consul/consul.logMonitor Consul health checks
Consul can provide visibility into the status of nodes and services in your cluster. Consul runs health checks to monitor node and service availability based on user-defined techniques such as custom scripts and HTTP requests to a certain endpoint. You can view summaries of these checks with the Consul browser UI and HTTP API.
Convenient visibility with the browser UI
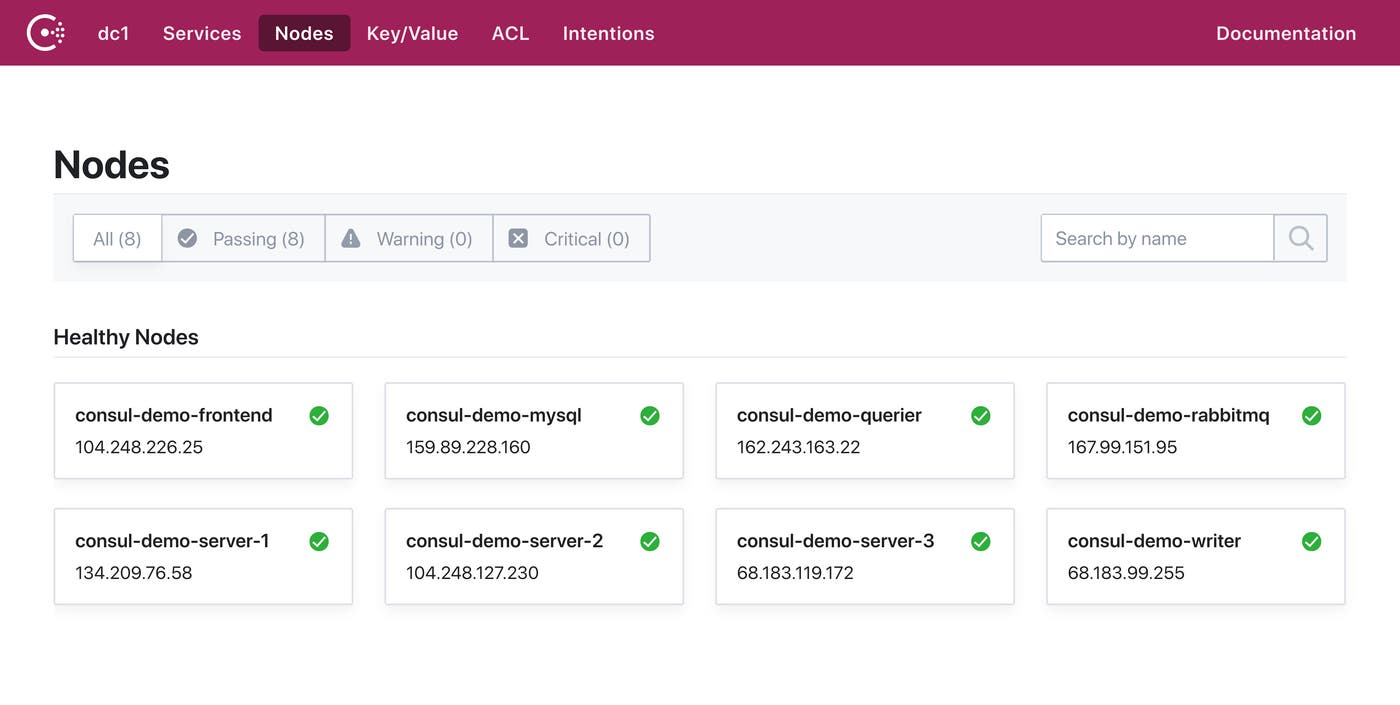
The Consul agent ships with a browser-based graphical user interface that provides a high-level overview of services and nodes running in your cluster, and allows you to edit cluster metadata and configuration details within the key-value store. You can use the UI to navigate between lists of services, nodes, and entries in the KV store, as well as intentions (rules regarding which services can connect to one another), and Access Control Lists, which restrict management tasks to certain Consul agents. The UI also has some benefit for monitoring, giving you a synopsis of your cluster’s status, including the results of health checks on Consul nodes and services (“Passing,” “Warning,” or “Critical”), and allowing you to discover issues quickly. You have the option of accessing each view separately for different datacenters.
For example, this UI view tells us the names and IP addresses of each node in our cluster, and shows us that all nodes are healthy.
To enable the UI, add the -ui option when starting a Consul agent from the command line:
consul agent -uiAs an alternative, you can add the pair "ui": true to your Consul configuration to enable the UI every time Consul starts.
Once an agent is running, you can access the UI from the same address as the HTTP API, <CONSUL_AGENT_HOST>:<API_PORT>/ui. Note that the server for the UI, DNS, and HTTP APIs listens on loopback (127.0.0.1) and port 8500 by default. You can specify another host address with the client_addr key in a Consul configuration file, which allows for multiple IP addresses separated by spaces (e.g., 127.0.0.1 <PUBLIC_IP>).
Note that the UI is less suited for monitoring the internal health and performance of Consul itself than for tracking the status of nodes and services deployed within your Consul cluster.
API endpoints
You can also access summaries of Consul health checks by using the HTTP API. You’ll find the same sort of information you can view with the UI, but with the machine readability of JSON.
To see the status of Consul health checks, you can query the /health API endpoint, which allows you to list health checks by node and service. You can filter by parameters such as the name, service name, and status of the check.
You can also interact with the checks registered with a particular Consul agent directly (rather than through the catalog) by using the /agent/checks endpoint, which returns similar information as the /health endpoint but allows you to register, deregister, and update health checks.
Many machines, one monitoring platform
In this post, we’ve shown you a number of built-in techniques for getting visibility into your Consul cluster. Consul exposes a variety of data from all of its components—to make the data meaningful, you’ll want a way to move easily between logs and metrics, both from Consul and from the applications running within your cluster. In Part 3, we’ll show you how to use Datadog to get full visibility into your Consul environment.
Acknowledgment
We wish to thank our friends at HashiCorp for their technical review of an early draft of this post.


