


Paul Gottschling
HashiCorp Consul is agent-based cluster management software that addresses the challenge of sharing network and configuration details across a distributed system. Consul handles service discovery and configuration for potentially massive clusters of hosts, spread across multiple datacenters. Consul was released in 2014, and organizations have adopted it for its service discovery capabilities, distributed key-value store, and automated health checks, among other features (including, recently, a service mesh).
Monitoring Consul is necessary for making sure that up-to-date network and configuration details are reaching all hosts in your cluster, allowing them to communicate with one another and perform the work of your distributed applications. In this post, we’ll walk you through the components of Consul you should be monitoring. Then we’ll introduce four categories of metrics that provide comprehensive visibility into your Consul clusters:
- The Raft algorithm, which ensures that information relevant to the cluster is available to nodes by replicating it across a set of Consul servers
- The Gossip protocol, which Consul uses to detect new or failed nodes within the cluster
- The application-layer network protocols Consul uses for communication between nodes: RPC, HTTP, and DNS
- Metrics for tracking Consul’s state management (changes to the data Consul stores and replicates via Raft), plus memory resources used for managing state
Consul from a monitoring point of view
Consul runs as an agent on each host. The Consul agent propagates information across a cluster, ensuring that cluster members have access to consistent network and configuration details. In general, monitoring Consul means tracking its consistency mechanisms for performance and success.
Ensuring cluster consistency
Consul allows cluster members to communicate across a dynamic, distributed architecture by giving them access to a consistent set of networking and configuration data. Consul uses two mechanisms to ensure consistency: the Raft algorithm and the Gossip protocol.
Consul agents can either act as a server or a client. Consul server nodes store information relevant to cluster management such as configuration details and lists of services, and use the Raft algorithm (discussed in more detail below) to ensure that this data achieves strong consistency. Client nodes send requests to server nodes to retrieve information about cluster state. As a result, maintaining consistency through Raft is one of the main forms of work that Consul servers do. Consul can only ensure that configuration details and other state information are consistent to the extent that Raft is working properly.
Meanwhile, the Gossip protocol is used among all Consul nodes to determine which other nodes are in the cluster. Nodes broadcast messages to other nodes in the cluster about changes in membership, allowing up-to-date information to eventually reach the entire cluster. Client nodes then use this information to locate and send requests to server nodes, making Gossip crucial to Consul’s cluster management capabilities. Because service discovery in Consul depends on the latency and reliability of Gossip messaging between nodes, Gossip is important to monitor alongside Raft.
Following cluster reads and writes
While Raft and Gossip are the two main mechanisms Consul uses to do its work, i.e., to achieve cluster consistency, you’ll also want to track the read and write requests that cluster members make to one another, both for throughput and for latency. This is to ensure that cluster members can access and modify the information they need to keep your distributed system running as expected.
Consul server nodes use Raft to ensure that they hold a consistent set of cluster information, such as a catalog of cluster components (e.g., nodes and services), and a key-value (KV) store containing metadata and configuration details. KV store data is exposed to clients through an HTTP API using the endpoint, /kv/<KEY>.
To perform read and write operations on information managed by each Consul agent, Consul uses three network protocols above the transport layer: HTTP for its API, RPC for communication between nodes, and DNS to expose network addresses to clients. By observing request throughput and latency of traffic for each protocol, you can monitor traffic volume within your Consul cluster, break down the traffic by type (e.g., requests to a given HTTP API endpoint), and track how well this traffic is being handled by Consul.
How Consul reports metrics
Consul makes most of the metrics outlined in this post available via the go-metrics library; in Part 2 of this series, we’ll walk through how to collect these metrics. go-metrics gives users flexibility in how and when metrics are aggregated by sending its data to pluggable metrics sinks (discussed in Part 2). By default, Consul stores metrics in memory, with an aggregation interval of 10 seconds and a retention period of one minute. Consul will then calculate aggregates for its in-memory metrics, including count, rate, sum, min, max, and mean.
These constraints only apply to the default in-memory sink; if you declare an additional sink, the features of that sink will apply instead. For example, you can send metrics directly to a StatsD server for remote aggregation, and integrate Consul with an external monitoring service for longer retention, as we’ll cover in Part 3 of this series.
As we introduce metrics throughout this post, we’ll suggest an aggregate to use (e.g., the mean). Whether you can use that aggregate in your own monitoring environment will depend on the metrics sink you have configured, and whether you are using only the default in-memory sink. Some metrics give you the most visibility as a percentile as well as an average—the in-memory sink does not support percentiles, but you can use a metrics sink that does. Consul sometimes exposes as durations metrics that are also useful as counts (but for different reasons), and we’ll make it clear when this is the case. In Part 2, we’ll show you how to set up metrics sinks with Consul.
Throughout this post, we’ll refer to terminology we introduced in our Monitoring 101 series.
Raft metrics
In the Raft algorithm, one server node assumes the role of leader while the rest become followers (this is settled through a vote). The leader sends a “heartbeat” message to followers periodically, and if a quorum of followers fail to acknowledge the message within a given time interval (the leader lease, which defaults to 500 ms), another leadership election takes place, ensuring (in theory) that a cluster leader is always available.
Server nodes maintain logs of changes to their state (e.g., any data Consul stores in the catalog or KV store), and when a leader node propagates a change via Raft, it first updates its own log, then broadcasts the updates so followers can update their logs as well. When a quorum of followers update their logs to sync with the leader, that update is called a commit. (You can learn more about Raft by viewing an animated presentation and various publications and talks.)
Because a reliable leadership system is necessary to ensure that cluster nodes have access to up-to-date network and configuration details, you’ll want to monitor various aspects of Consul leadership transitions. You’ll also want to make sure that Raft is doing its job—replicating network and configuration data across Consul servers—with metrics related to Raft commits.
Leadership transitions
Leadership transitions help Consul ensure availability, but frequently changing leadership can achieve the opposite—Raft can only replicate information consistently when a cluster has a leader. You can better understand your cluster’s leadership transitions by observing these metrics.
| Name | Description | Metric type | Recommended aggregation |
|---|---|---|---|
| Number of Raft peers | Number of servers participating in Raft within a given datacenter | Other | Mean |
| consul.raft.state.leader | Increments when a server becomes a leader | Other | Sum |
| consul.raft.leader.lastContact | How long it takes a leader node to communicate with followers during a leader lease check, in milliseconds | Work: Performance | Mean or percentile |
| CPU idle | Percentage of time the host CPU is in an idle state, i.e., available for additional utilization by Consul | Resource: Utilization | Mean |
Note that only the leader node tracks consul.raft.state.leader and consul.raft.leader.lastContact, so these metrics will stop reporting if the leader is down. You can alert on a sudden absence of these metrics, since they indicate that your Consul leader node is unavailable—a sustained lack of a leader can indicate a loss of quorum that will cause Raft to stop functioning.
Metric to watch: Number of Raft peers
Leadership transitions can only take place—and Raft can only ensure the consistency of cluster-relevant data—if a cluster has a quorum of available server nodes. You can see how many servers are running in your cluster by querying the Consul API, which we’ll explore in Part 2. The API endpoint that lists Raft peers is /status/peers. This metric is not available through Consul’s built-in telemetry feature.
Metric to watch: consul.raft.state.leader
When a Consul server becomes a leader, just before entering the “leader loop” of routine maintenance tasks, it increments the consul.raft.state.leader metric. Tracking the rate of this metric over time is a good high-level indicator of cluster leadership stability. Since Raft can only obtain consistency—and provide up-to-date information to cluster members—with a leader in place, leadership transitions should be infrequent (e.g., a maximum of once every day) .
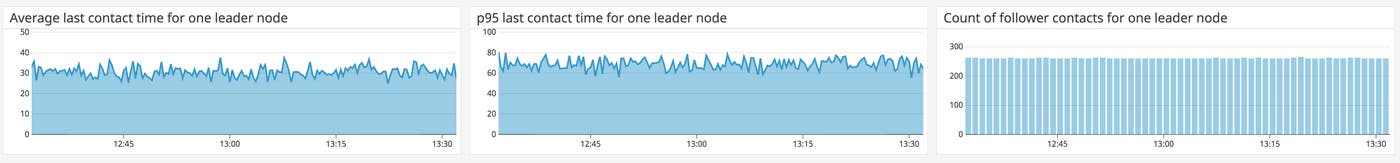
Metric to watch: consul.raft.leader.lastContact
The metric consul.raft.leader.lastContact measures how long it takes a leader node to communicate with followers in the course of checking its leader lease. A value of 200 ms or lower indicates healthy communication between servers. A high value can indicate network failure or CPU saturation on your servers, causing unreliable leadership transitions.
The leader node periodically checks its last contact time for each follower by iterating through its in-memory record of its followers’ statuses. After checking a follower, the leader sends one sample of raft.leader.lastContact to your chosen metrics sinks for aggregation. Because consul.raft.leader.lastContact comes from multiple followers, but does not expose any labels or tags that can help you filter the values by node, you’ll want to track this metric by percentile to reveal outliers (e.g., a single follower node that is particularly slow due to resource saturation).
Metric to watch: CPU idle
If the leader is taking too long to communicate with followers, causing frequent leadership transitions, a possible recourse is to scale your CPU resources. You can see the extent to which this is possible by monitoring the percentage of time the CPU is available for additional use by your Consul hosts, then comparing that CPU utilization metric to the frequency of leadership transitions (consul.raft.state.leader) and the latency of leader lease checks (consul.raft.leader.lastContact). The Consul documentation recommends provisioning at least two cores for the Consul agent.
Raft commits
Raft is complex, involving work from multiple servers within a cluster. You can monitor Raft at several stages of its lifecycle to check that Consul is working as expected.
| Name | Description | Metric type | Recommended aggregation |
|---|---|---|---|
| consul.raft.apply | Increments when a leader node begins to replicate state via Raft | Work: Throughput | Sum |
| consul.raft.commitTime | How long it takes to perform a single commit in Raft on the leader, in milliseconds | Work: Performance | Mean |
| consul.raft.rpc.appendEntries | How long it takes for a follower node to process Raft logs replicated from the leader, in milliseconds | Work: Performance | Mean or percentile |
| consul.leader.reconcile | Number of reconciliation events between a leader’s catalog and memberlist | Work: Throughput | Count |
| consul.raft.leader.dispatchLog | How long it takes a Raft leader to write a log to disk, in milliseconds | Work: Throughput | Mean |
| consul.raft.leader.dispatchLog | The number of times a Raft leader writes a log to disk | Work: Throughput | Count |
| consul.raft.snapshot.create | Number of times Consul has created a snapshot | Work: Throughput | Count |
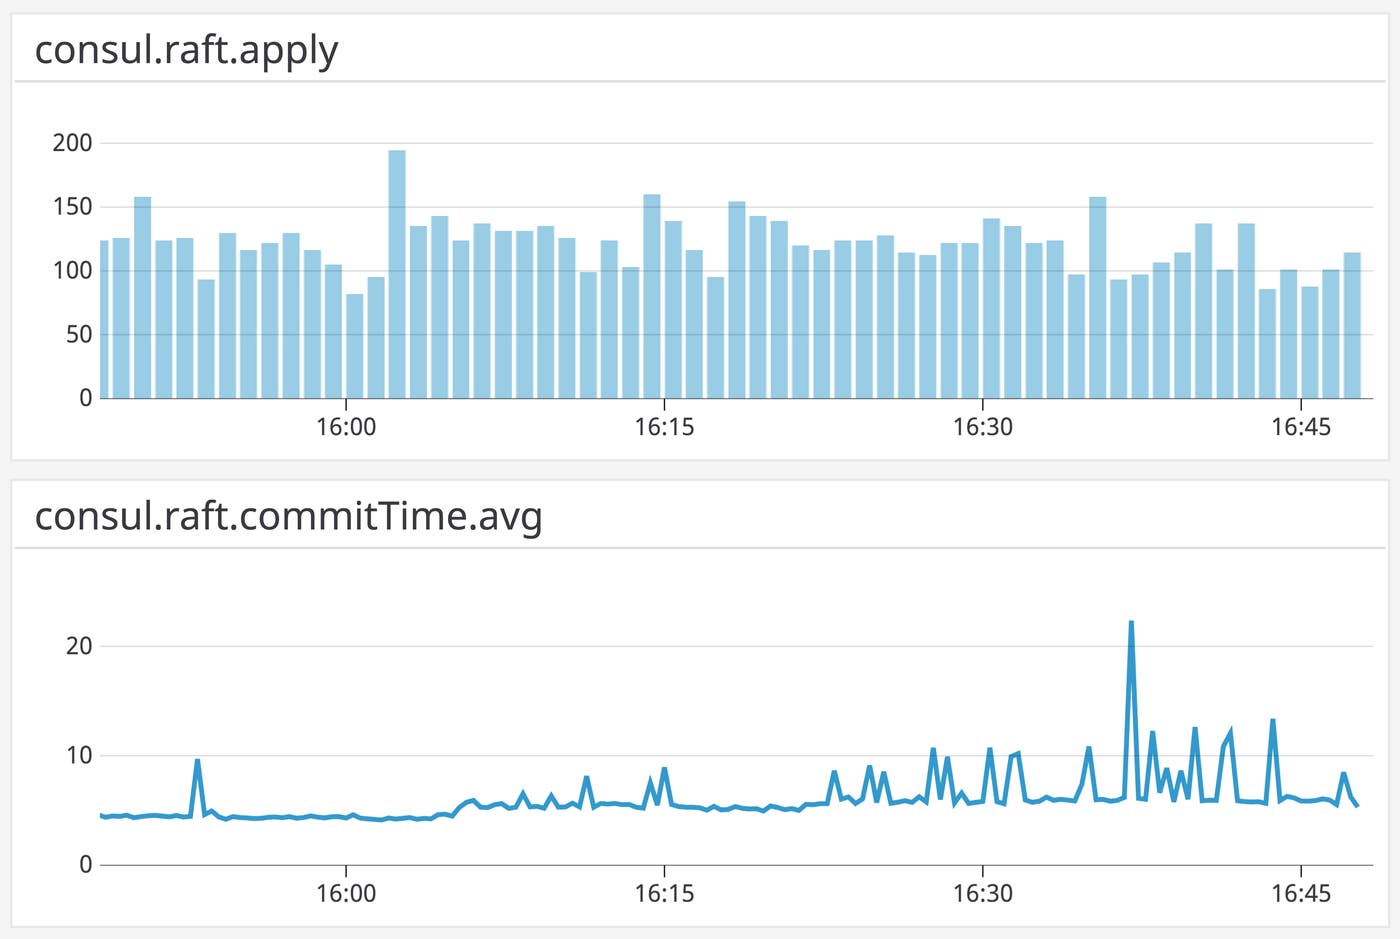
Metric to watch: consul.raft.apply
The metric consul.raft.apply is incremented whenever a leader first passes a message into the Raft commit process (called an Apply operation). This metric describes the arrival rate of new logs into Raft. You can correlate it with resource metrics to understand the write load on your Consul servers. Note that because the metric is incremented at the beginning of the operation, it says nothing about the success or failure of commits—if there is disk I/O saturation on your servers, for example, Raft will receive logs faster than it can replicate them.
Metric to watch: consul.raft.commitTime
This metric takes the time difference between when a message was first passed into Raft and when the resulting commit took place on the leader. A Raft log is committed on the leader when the leader updates its Raft logs, saves the new logs to disk, and confirms that the most recently saved log matches the most recent log in the leader’s memory. An increase in commit time can indicate heightened load on your Consul servers, and makes it more likely that clients are accessing stale data.
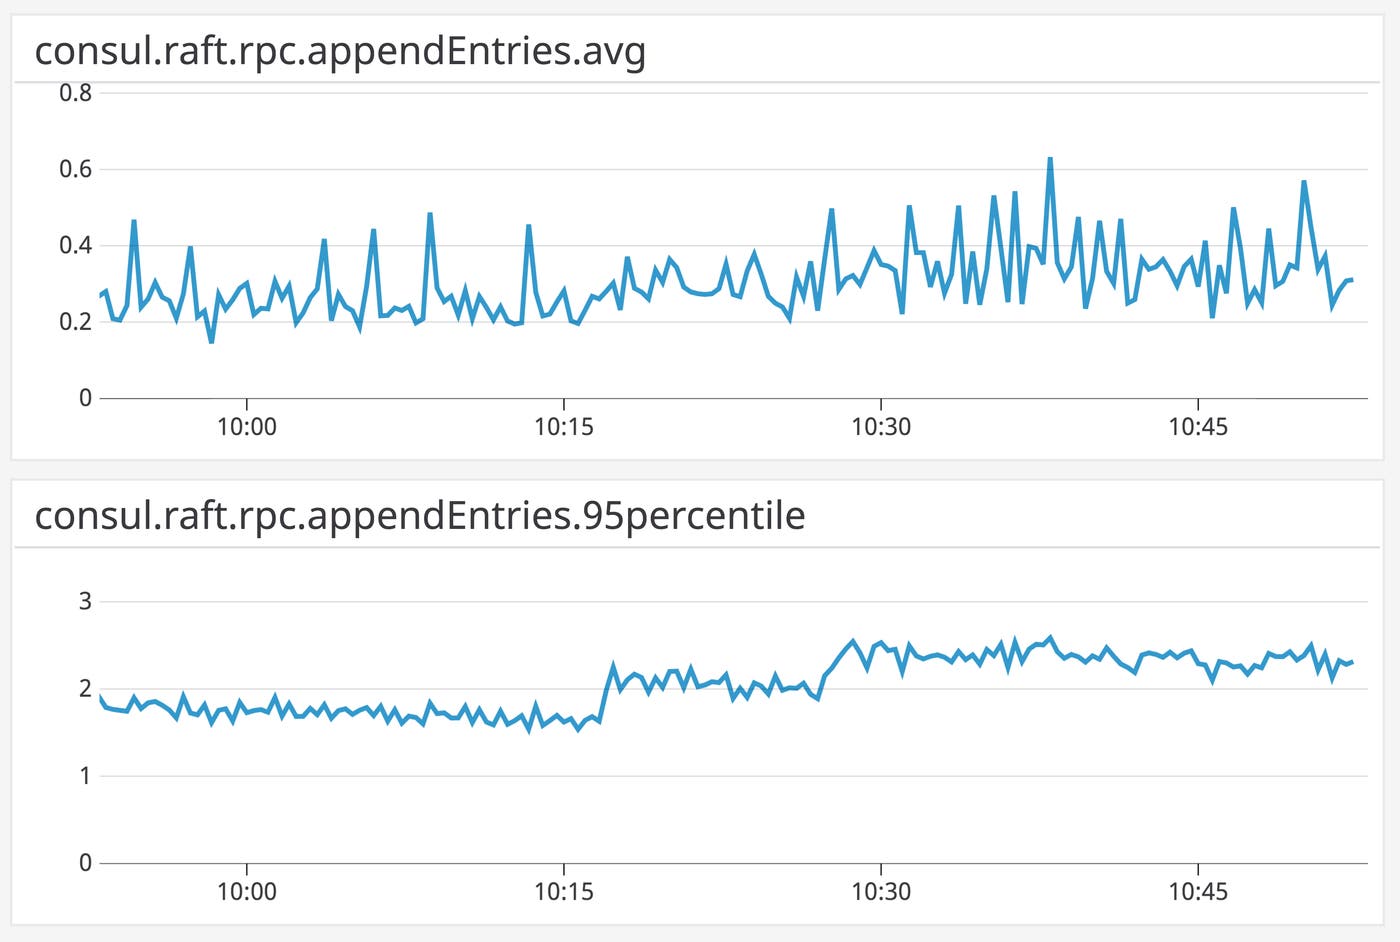
Metric to watch: consul.raft.rpc.appendEntries
Use consul.raft.rpc.appendEntries to understand how long it takes a follower node to process newly received Raft logs from the leader. Like consul.raft.commitTime, increases in this metric can indicate higher load on your Consul servers, and come with a risk of stale data. Since this metric is exposed within each follower, you should aggregate it as both an average (to track overall load on your Raft servers) and a percentile (to watch for outlier nodes). Also note that this metric reports whether or not the follower has replicated logs successfully—if you see a steep drop in the value of this metric, you should check your Consul logs for errors (e.g., the leader and followers are out of sync with regard to Raft election terms).
Metric to watch: consul.leader.reconcile
Consul leaders regularly reconcile the list of nodes they have obtained via the Gossip protocol (i.e., the memberlist) and the list of nodes they maintain within their catalog (as mentioned above). consul.leader.reconcile measures the duration of the reconciliation operation. The count of the metric indicates how often reconciliation takes place. Since reconciliation is part of Consul’s “leader loop”, or repeated maintenance jobs, the count of this metric should be flat, indicating a leader is in place and conducting reconciliation regularly.
Metric to watch: consul.raft.leader.dispatchLog
In the implementation of Raft that Consul uses, a leader writes logs to disk and begins the replication process on three occasions: just after a server has become a leader (before beginning the leader loop); when committing logs during an Apply operation; and when Consul configuration changes are added to the log. This metric can help you determine the cause of latency within Raft, since it measures a particular part of the process not covered by other Raft-related metrics: how long it takes a Raft leader to write a log to disk.
This metric can also help you understand the role disk performance plays in overall Raft performance, and indicate when you’ll want to tune Consul’s I/O operations. You can, for example, monitor I/O operations per second alongside consul.raft.leader.dispatchLog and other Raft metrics to determine if a slow disk is to blame for underperforming Raft commits.
Metric to watch: consul.raft.snapshot.create
Consul snapshots save to disk the information replicated through Raft, and let Consul restore state in the event of an outage. By default, Consul creates a snapshot after committing a minimum of 16,384 Raft entries, and checks whether to create a snapshot every 30 seconds. By taking the count of this metric, you can see how this metric correlates with disk performance (e.g., I/O wait) and whether your storage resources can accommodate the snapshot process.
Gossip metrics
| Name | Description | Metric type | Recommended aggregation |
|---|---|---|---|
| consul.serf.member.flap | Number of times Consul deems a node failed, then healthy, within a 60-second interval | Other | Sum |
Metric to watch: consul.serf.member.flap
Consul cluster members only know about the existence of other nodes as long as the Gossip protocol can function regularly. Consul implements Gossip using the Serf library, which follows changes in cluster membership and detects failures. When a member joins a cluster, Serf detects the node’s previous state. If that previous state was one of failure (StatusFailed), and the node had been out of the cluster for less than a certain interval (FlapTimeout, which is hardcoded to 60 seconds) before rejoining, Serf increments the metric consul.serf.member.flap. This metric can expose a variety of issues: node status usually flaps when there are network problems, saturated CPUs, and misconfigured connections.
Communication metrics
Because Consul performs work across a number of application-layer communication protocols (HTTP, DNS, and RPC), it’s a good idea to monitor various aspects of cross-node communication. Each server runs an HTTP API that supports read and write operations on the catalog (which tracks the status of nodes, services, and other state information, as explained earlier). Consul uses the remote procedure call (RPC) pattern for communication between client and server nodes. When a Consul client makes a request for data within another datacenter, a server forwards the RPC to a server in the appropriate datacenter. Consul also includes a DNS interface that returns the network addresses of nodes and services. As with requests to the HTTP API, Consul clients serve requests to the DNS interface by first making an RPC to the server for the desired information.
| Name | Description | Metric type | Recommended aggregation |
|---|---|---|---|
| consul.http.<VERB>.<ENDPOINT> | Number of Consul HTTP API requests with the specified verb (GET, PUT, DELETE) and URL path | Work: Performance | Count |
| consul.http.<VERB>.<ENDPOINT> | How long it takes to complete an HTTP request with the specified verb (GET, PUT, DELETE) and URL path, in milliseconds | Work: Performance | Mean |
| consul.rpc.request | Number of one-off RPC requests a server has handled | Work: Throughput | Mean |
| consul.rpc.query | Number of potentially blocking RPCs a server has received | Work: Throughput | Mean |
| consul.rpc.request_error | Number of errors a Consul server has encountered while serving a one-off RPC request | Work: Error | Mean |
| consul.client.rpc | Increments for each RPC between client and server nodes | Work: Throughput | Sum |
| consul.client.rpc.failed | Increments if an RPC has returned an error | Work: Error | Sum |
| consul.client.rpc.exceeded | Increments when a server has rate-limited RPCs from a client | Other | Sum |
| consul.rpc.cross-dc | Number of RPCs initiated between datacenters | Work: Throughput | Count |
| consul.dns.domain_query.<NODE> | How long it takes for a node to process a DNS query, including the response, in milliseconds | Work: Performance | Mean |
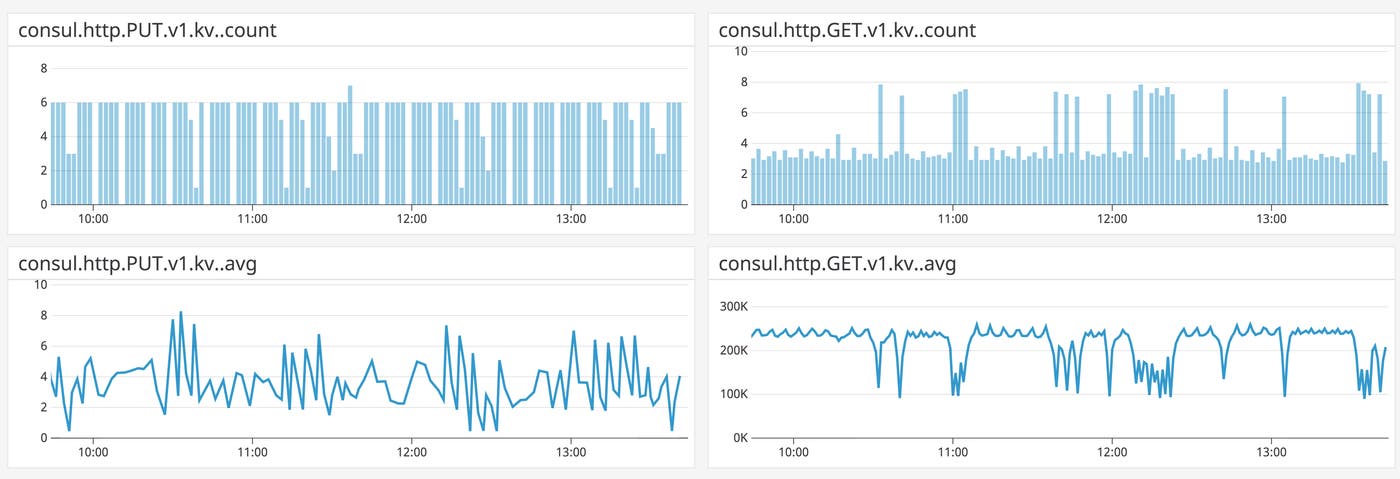
Metric to watch: consul.http.<VERB>.<ENDPOINT>
Consul makes cluster information available with a REST API, which you can use to perform a number of basic operations. You can register nodes, services, and checks with a PUT request to the /catalog/register endpoint, for example, or read cluster metadata from the key-value store using a GET request to /kv/. You can use the count of the metric consul.http.<VERB>.<ENDPOINT> to track the throughput of requests to different endpoints.
The count of consul.http.<VERB>.<ENDPOINT> is also useful for correlating demand on specific API endpoints to Consul resource utilization. If Consul servers are going through periods of high CPU utilization, for example, increases in requests to the HTTP API might be the cause, and you can use this metric to drill down to the specific API endpoints to investigate.
The average value of the consul.http.<VERB>.<ENDPOINT> metric, which shows you the time it takes to respond to the request, can be useful for tuning any automated scripts that access Consul’s Raft-managed data. For example, you can determine whether to bundle multiple API calls into a single transaction rather than making one request at a time.
Metrics to watch: consul.rpc.request, consul.rpc.query, consul.rpc.request_error
Consul clients retrieve Raft-managed cluster information by sending RPCs to Consul servers. Since these RPCs can be a significant source of load, you will want to track RPC-related metrics from Consul servers. Consul clients can make two types of RPC calls: either one-off requests—the client will request a resource and the server will return it—or blocking queries, a form of long polling in which a server will attempt to keep the connection open while waiting for changes in the requested data.
You can see how often a server receives single-request RPCs in comparison to blocking queries, and correlate this information with resource utilization, by tracking two metrics: consul.rpc.request, which increments after the server handles a single-request RPC without errors, and consul.rpc.query, which increments after the server receives a blocking query, just before the Consul server begins waiting for a resource.
Finally, consul.rpc.request_error increments if there’s an unexpected error when handling a single-request RPC (i.e., an error not related to closing the connection). If you see a drop in consul.rpc.request, you can check for a corresponding increase in this metric, then check your Consul logs for entries beginning [ERR] consul.rpc: RPC error.
Metrics to watch: consul.client.rpc, consul.client.rpc.exceeded, consul.client.rpc.failed, consul.rpc.cross-dc
Because Consul clients communicate with servers via RPC, you’ll want to watch for sudden drops in throughput or rises in RPC-related errors.
Consul increments the consul.client.rpc metric whenever a client attempts to make an RPC to a server. As a result, falls in consul.client.rpc can indicate a loss of node availability. For RPC-related errors, you can turn to consul.client.rpc.exceeded and consul.client.rpc.failed. After a Consul client finds a server to contact, it checks whether it has exceeded its locally configured RPC call limit—if it has, Consul will increment the metric consul.client.rpc.exceeded.
If a given RPC returns an error, you’ll see an increment in consul.client.rpc.failed. The client will then retry the RPC if two conditions are met: the first RPC attempt did not change Consul’s state and the RPC hold timeout has not yet expired. If the client retries the RPC, you’ll see an increase in consul.client.rpc right after consul.client.rpc.failed. If Consul cannot find a server to contact, no rpc metrics will increment.
When a Consul client node is making an RPC to a server within another datacenter, it will find a server to contact in the local datacenter first (that server will forward the RPC appropriately), then increment consul.rpc.cross-dc. Unlike metrics for RPCs between clients and servers within the same datacenter, there is no metric for failed cross-datacenter RPCs. However, a server will publish a warning log if it cannot find a datacenter to forward the RPC to:
[WARN] consul.rpc: RPC request for DC <DATACENTER>, no path foundConsul will also publish an error log if the RPC fails. For example, if you have misconfigured Consul’s RPC server to listen on a private network address, the server will log a message like this:
[ERR] consul: RPC failed to server <SERVER_ADDRESS> in DC <DATACENTER>: <ERROR_MESSAGE>You can find more details about Consul logging in Part 2 and Part 3 of this series.
Metric to watch: consul.dns.domain_query.<NODE>
This metric indicates how long a node takes to process and respond to a DNS query. Each Consul agent runs a DNS API that makes it possible to retrieve network details for services and nodes. The default Consul setting aims to reduce latency of DNS lookups by allowing for stale reads—DNS entries that haven’t been updated through Raft to reflect leader state—so that the cluster leader is no longer a bottleneck. If stale reads are disrupting service discovery, you can either disable stale reads or change the dns_config.max_stale setting to allow stale reads only up to a certain age, and watch consul.dns.domain_query.<node> to see how much these settings have affected latency.
You can use consul.dns.domain_query.<node> to determine whether to allow stale reads, and how long to allow entries to remain stale before referring to the leader.
State metrics
Consul stores much of its Raft-managed data in memory, including the catalog and KV store. You can register or deregister parts of your cluster (e.g., nodes and services) through the catalog, and get information about the entities in your cluster, all via an HTTP API. Monitoring changes in Consul’s state can help you ensure that updates are taking place when expected. And since Consul’s Raft-managed state is stored in memory, you’ll want to monitor each Consul agent’s use of this resource.
Preserving memory for Consul state management
Consul’s Raft-managed data (e.g., the catalog and KV store) is read and written to memory (with Raft logs written to disk before being committed, and the state of Consul’s Raft-managed data stored periodically as a snapshot). An out-of-memory error will cause Consul to crash, leading to delayed availability as Consul restores its data from disk—and, if this process involves more data than can fit in memory, it can lead to another out-of-memory error. To ensure that Consul remains within acceptable memory limits, you can track three memory-related metrics. Two of them (consul.runtime.alloc_bytes and consul.runtime.sys_bytes) are exposed within Golang’s built-in runtime library, which Consul’s metrics package uses to track the running Go process.
| Name | Description | Metric type | Recommended aggregation |
|---|---|---|---|
| consul.runtime.alloc_bytes | Amount of physical memory currently being used by Consul, in bytes | Resource: Utilization | Mean |
| Free system RAM | Physical memory available for use | Resource: Availability | Mean |
| consul.runtime.sys_bytes | Size of the virtual address space for the Go runtime, in bytes | Resource: Utilization | Mean |
Metric to alert on: consul.runtime.alloc_bytes, free system RAM
consul.runtime.alloc_bytes indicates the working set size for Consul. This is useful for estimating Consul’s memory requirements, as the Consul documentation recommends scaling your hosts to accommodate two to four times the value of this metric. You can monitor the physical RAM available to your system alongside consul.runtime.alloc_bytes to understand the fluctuations in free memory over time, and whether they can accommodate your Consul deployments.
Metric to watch: consul.runtime.sys_bytes
consul.runtime.sys_bytes indicates the virtual address space for the Go runtime. This is the same as the Sys metric within the runtime package. The Consul documentation recommends keeping consul.runtime.sys_bytes below 90 percent of total system memory to avoid a crash and the resulting loss of data.

Key-value store metrics
Along with information about nodes and services, Consul replicates arbitrary data, such as configuration details, across a cluster in the form of a key-value (KV) store. Monitoring the KV store helps you to guard against stale reads while helping you identify the cause of Consul resource usage by seeing how much is attributable to KV store reads and writes. Further, Consul’s KV store is designed for limited use—as a way of making a consistent set of cluster management data available to members of a cluster—rather than as a dedicated data store (for example, Consul’s maximum value size is 512 KB, versus 512 MB for a string within Redis). To make sure the KV store isn’t sustaining more load than it can handle, you should monitor how frequently you make updates if your system depends on the KV store, and how long KV store updates take.
| Name | Description | Metric type | Recommended aggregation |
|---|---|---|---|
| consul.kvs.apply | How long it takes to update and replicate the KV store within Raft, in milliseconds | Work: Performance | Mean |
| consul.kvs.apply | The number of updates to the KV store | Work: Performance | Count |
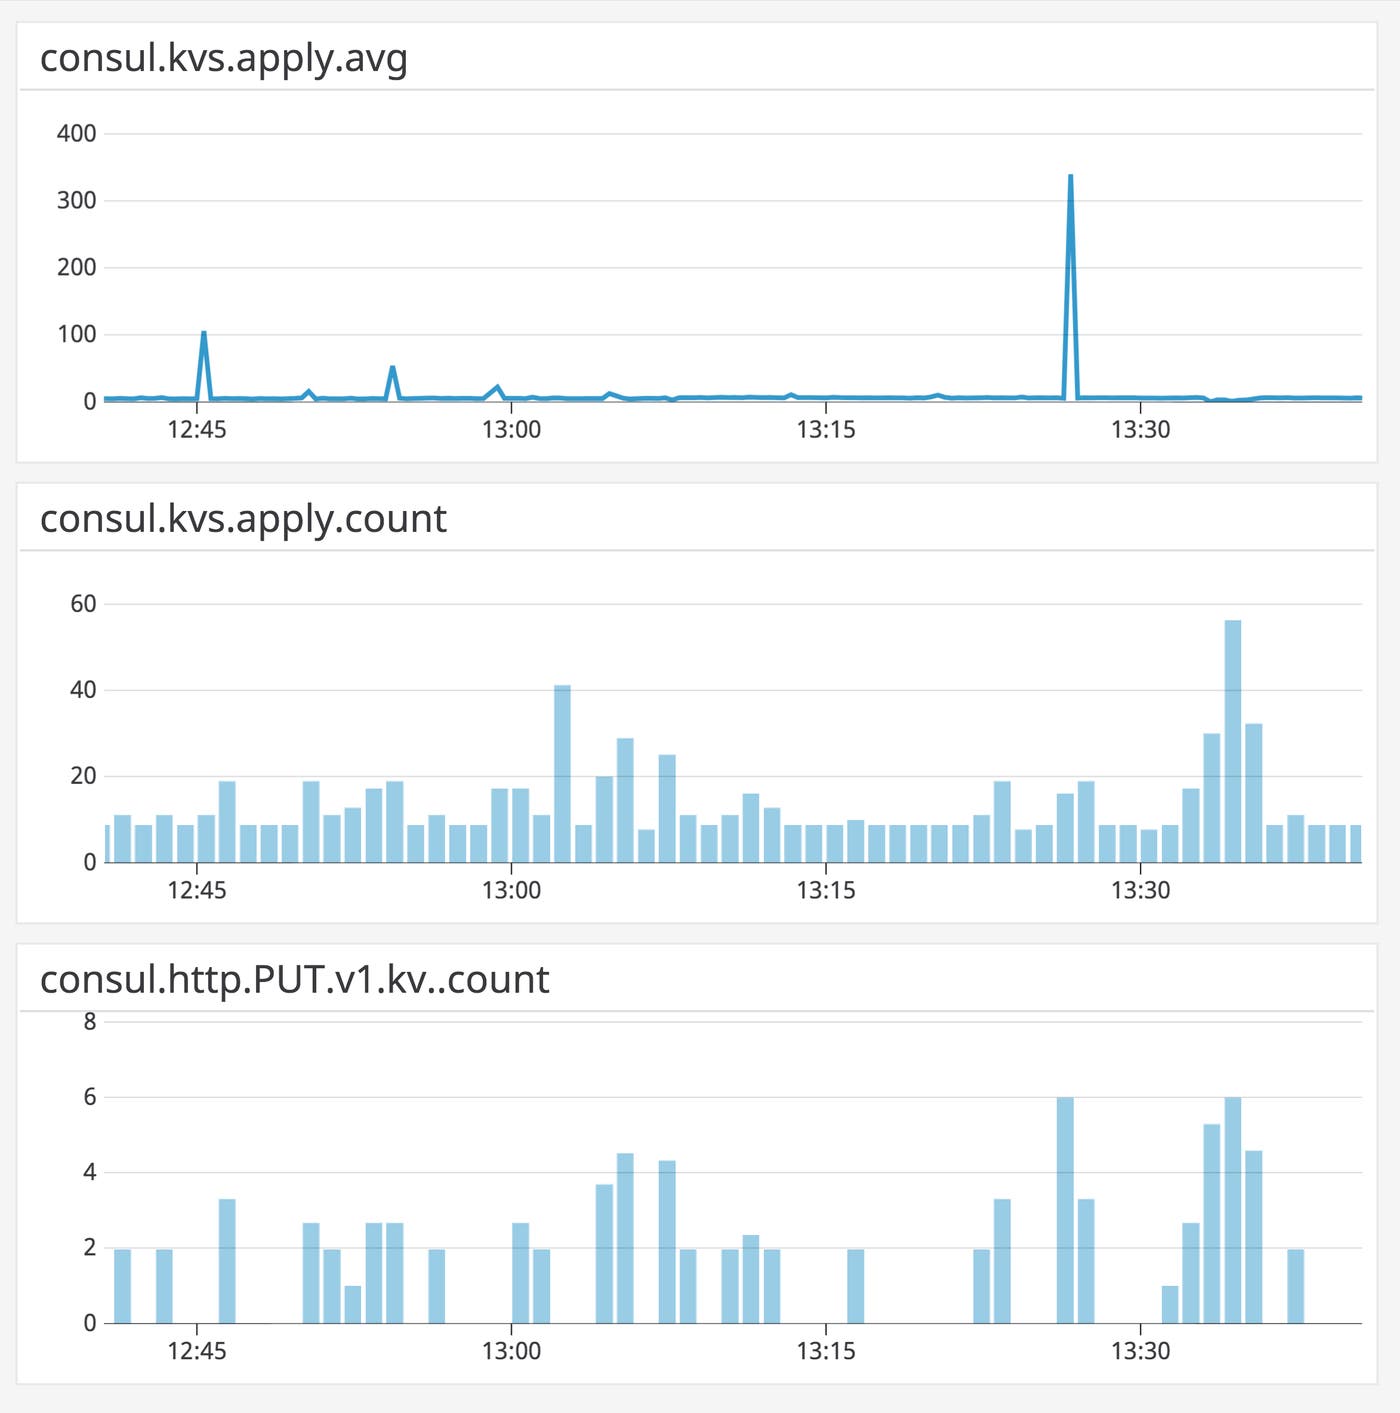
Metric to watch: consul.kvs.apply
The metric consul.kvs.apply measures how long it takes to carry out a KV store update and pass it into Raft. A drastic increase can indicate heavier write load on your Consul servers, and point to other issues (e.g., disk saturation, as disk I/O is often a bottleneck for Apply operations). It can also indicate a higher likelihood of preserving stale data in the KV store. consul.kvs.apply uses a defer statement to compare the time an operation begins with the time the operation ends, regardless of whether Consul has successfully updated its state.
The count of consul.kvs.apply indicates the number of updates to the KV store over a given timeframe. If your Consul deployment makes heavy use of the KV store, you can compare the count and duration of KV writes, allowing you to see if increases in throughput correlate with higher latency. And by correlating the count of consul.kvs.apply with resource metrics (e.g., memory and CPU utilization), you can understand how much demand the KV store can accommodate.
All KV store operations take place through the HTTP API. As a result, you can get more granularity into which KV operations are applied by tracking counts of specific API calls, such as consul.http.PUT.v1.kv._count (discussed above).
State change frequency
Consul watches are handlers such as scripts and HTTP requests that Consul triggers automatically when there are changes to the values of Raft-managed data, e.g., anything within the Consul catalog and KV store. You can use watches to monitor changes in state at a fine grain, such as modifications to a single key in the KV store. One way to use watches is to add a handler that writes the change to a log, then use a log analysis solution to see when and how frequently changes take place. You can use watches to drill down from API and KV store metrics to see what sorts of changes are taking place within Consul’s Raft-managed data, and how often these changes occur.
Observable Consul clusters
In this post, we’ve explored metrics that can help you understand Consul’s health and performance. In the next post, we’ll show you tools that can help you track these metrics, and in Part 3, we’ll explain how to set up Datadog to explore these metrics alongside traces and logs from Consul, plus data from the rest of your system.
Acknowledgment
We wish to thank our friends at HashiCorp for their technical review of an early draft of this post.


