

Confluent Cloud is a fully managed, cloud-hosted streaming data service. Enterprise customers use Confluent Cloud for real-time event streaming within cloud-scale applications. We’re excited to announce a new integration between Datadog and Confluent Cloud, which enables users to get deep visibility into their Confluent Cloud environment with just a few clicks. In this post, we’ll introduce how to set up the integration and start monitoring key metrics from your clusters.
Get real-time visibility into your data-in-motion
Confluent Cloud and Datadog are both cloud-native, managed services, which means it’s vital that users are able to connect them easily and seamlessly. Before this integration, you needed to run your own service to stream Confluent telemetry into Datadog. This method presented challenges around high availability, integrity of the telemetry, and API updates that brought about ongoing maintenance costs in addition to the extra overhead of running a separate service.
With our new integration, users running Confluent Cloud at any scale—from a proof of concept to production-grade—can start visualizing and alerting on key metrics on Datadog within minutes. Datadog and Confluent have designed this integration to give you full visibility into the most important metrics for your clusters out of the box, without any further configuration required.
Get full visibility into your Confluent Cloud environment in minutes
Next, we’ll walk through how to set up the integration.
Create a service account
First, you need to set up a Confluent Cloud service account to use for the integration. This will let you manage API keys that Datadog uses to crawl the Confluent Cloud Metrics API and obtain metrics. We’ll use the CLI to work in this demo, but you can also do the same operations through the Confluent Cloud UI.
# Log into your Confluent Clount account
confluent login
# Create the service account
confluent iam service-account create DatadogMetricsImporter --description "A service account to import Confluent Cloud metrics into Datadog"
You should see output similar to the following:
+-------------+--------------------------------+
| Id          |                         447311 |
| Resource ID | sa-zm6vgz                      |
| Name        | DatadogMetricsImporter         |
| Description | A service account to import    |
|             | Confluent Cloud metrics into   |
|             | Datadog                        |
+-------------+--------------------------------+
Next, you’ll need to add the MetricsViewer role to this service account so it can access the Metrics API. For the --principal User parameter, use the Resource ID value provided in the previous step.
confluent iam rbac role-binding create --role MetricsViewer --principal User:sa-zm6vgzFinally, create an API key for the new service account. In this case, the --service-account parameter is the Resource ID:
confluent api-key create --resource cloud --service-account sa-zm6vgzAdd your API key to Datadog
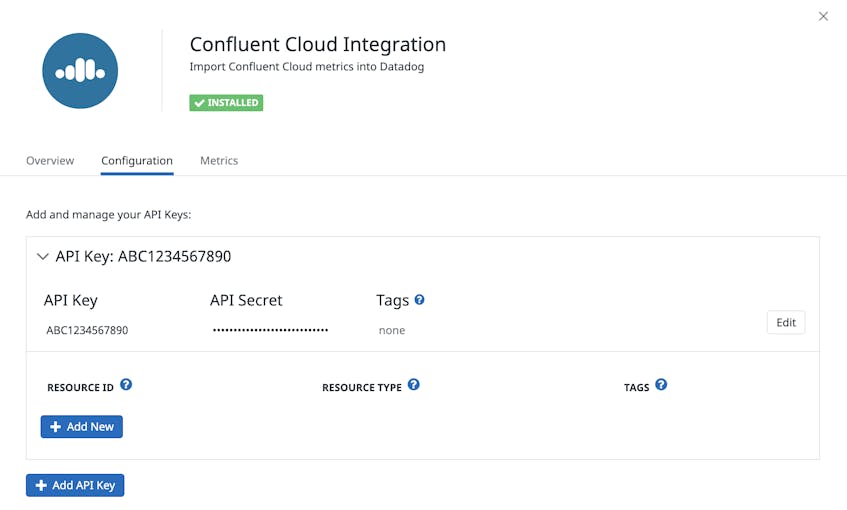
Now that you have created a service account and associated API key, you need to take that API key and add it to the Confluent Cloud integration tile in Datadog.
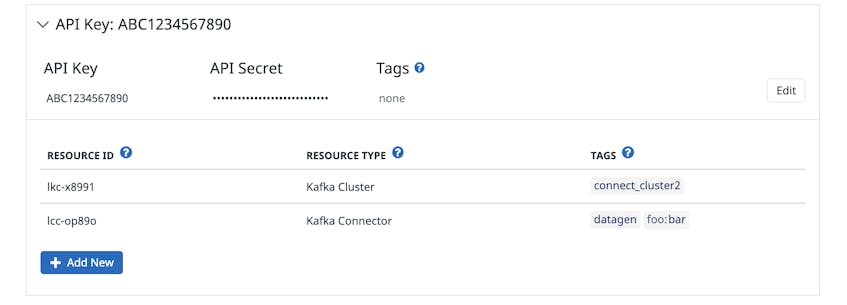
From here, specify which of your Confluent Cloud resources you want to monitor by adding their Cluster or Connector ID. Optionally, you can also specify custom tags to help identify the resources in Datadog using human-readable names.
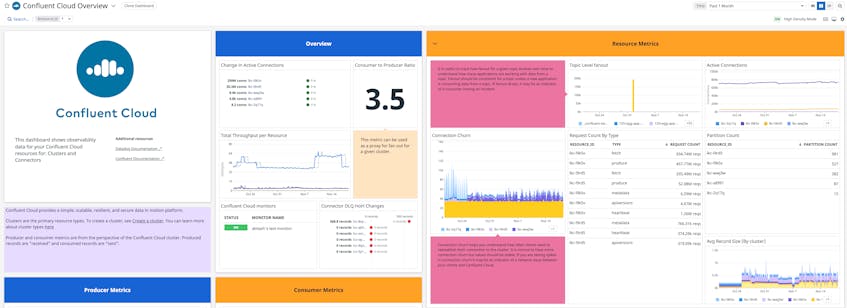
Within a few minutes of configuring the integration, Datadog will begin pulling in metrics from your Confluent Cloud resources, including backfilling the previous four hours of data. Datadog’s out-of-the-box dashboard visualizes key cluster metrics for monitoring the health and performance of your environment.
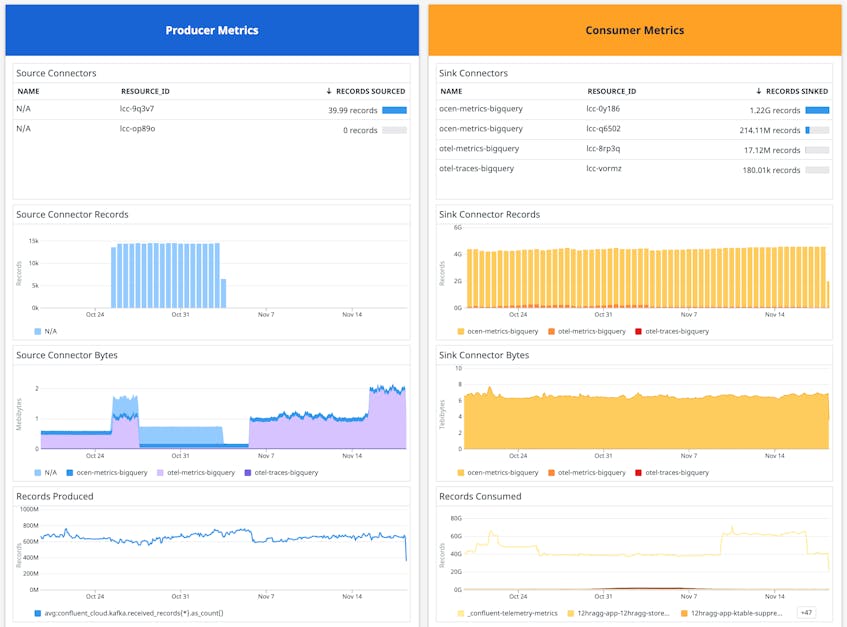
This dashboard is based on what we at Confluent use internally to monitor and operate our deployments and includes widgets that track important information like the rate of change in active connections and your ratio of average consumed to produced records.
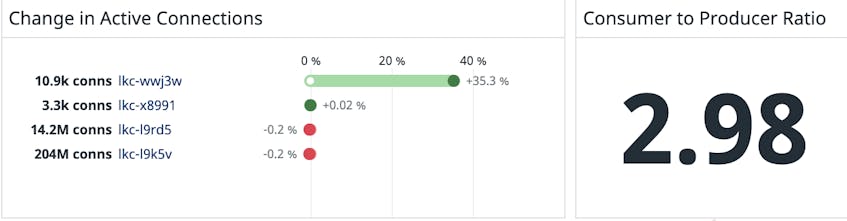
Monitoring the rate of change in active connections can alert you to things like a significant spike in cluster adoption. Or, if you see a sudden drop, it could mean that a set of clients are experiencing an incident that you should investigate. Tracking the ratio of consumed to produced data is important because a core value of Confluent Cloud is the ability to write data once and use it in multiple ways. A low ratio of consumers to producers can mean your environment is working inefficiently.
Metrics are just the start
Alongside Datadog’s integration for Confluent Platform, we’re excited about this new collaboration between Confluent and Datadog. The ability to collect metrics is an important first step toward fully integrating Confluent Cloud with Datadog. We plan to add more integration points, such as the ability to send Confluent Cloud audit logs to Datadog. We look forward to our continued partnership as we work together to help our mutual users set their data in motion. See Datadog’s documentation for details, or see Confluent Cloud’s demo for more information on getting started.
