If you’ve already read our guide to key Kafka performance metrics, you’ve seen that Kafka provides a vast array of metrics on performance and resource utilization, which are available in a number of different ways. This post covers some different options for collecting Kafka metrics, depending on your needs. For those with legacy deployments, we’ll also cover ZooKeeper metrics.
Like many JVM-based services, Kafka exposes metrics on availability and performance via Java Management Extensions (JMX).
Collect native Kafka performance metrics
In this post, we’ll show you how to use the following tools to collect metrics from Kafka (and, for legacy clusters, ZooKeeper):
- JConsole, a GUI that ships with the Java Development Kit (JDK)
- JMX, with external graphing and monitoring tools and services
JConsole and JMX can collect all of the native Kafka performance metrics outlined in Part 1 of this series. For host-level metrics, you should consider installing a monitoring agent.
Collect Kafka performance metrics with JConsole
JConsole is a simple Java GUI that ships with the JDK. It provides an interface for exploring the full range of metrics Kafka emits via JMX. Because JConsole can be resource-intensive, you should run it on a dedicated host and collect Kafka metrics remotely.
First, you need to designate a port that JConsole can use to collect JMX metrics from your Kafka host. Edit Kafka’s startup script—bin/kafka-run-class.sh—to include the value of the JMX port by adding the following parameters to the KAFKA_JMX_OPTS variable:
-Dcom.sun.management.jmxremote.port=<MY_JMX_PORT> -Dcom.sun.management.jmxremote.rmi.port=<MY_JMX_PORT> -Djava.rmi.server.hostname=<MY_IP_ADDRESS>Restart Kafka to apply these changes.
Next, launch JConsole on your dedicated monitoring host. If the JDK is installed to a directory in your system path, you can start JConsole with the command jconsole. Otherwise, look for the JConsole executable in the bin/ subdirectory of your JDK installation.
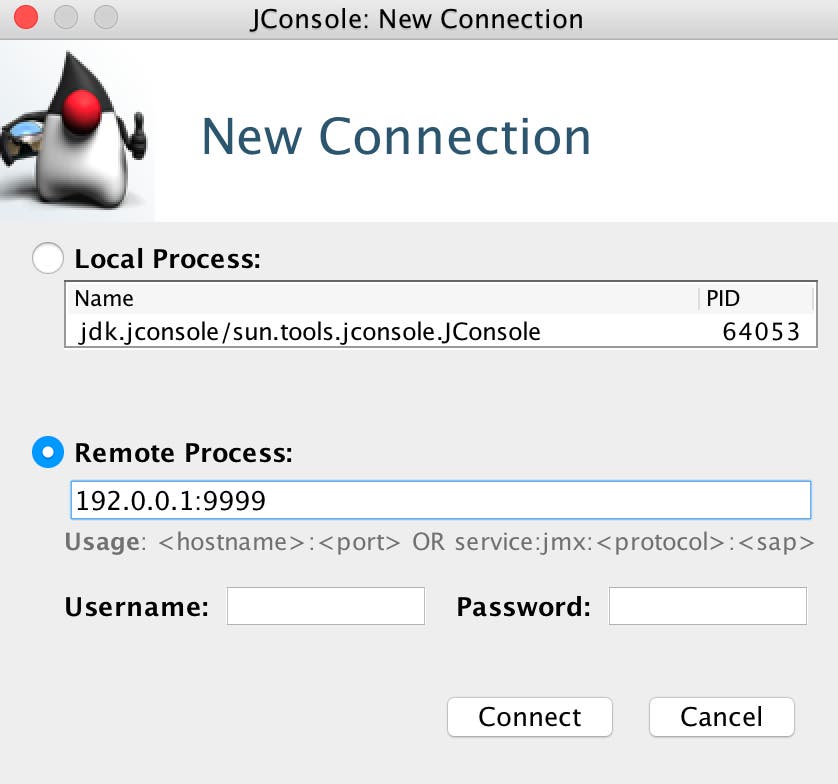
In the JConsole UI, specify the IP address and JMX port of your Kafka host. The example below shows JConsole connecting to a Kafka host at 192.0.0.1, port 9999:

The MBeans tab brings up all the JMX paths available:

As you can see in the screenshot above, Kafka aggregates metrics by source. All the JMX paths for Kafka’s key metrics can be found in Part 1 of this series.
Consumers and producers
To collect JMX metrics from your consumers and producers, follow the same steps outlined above, replacing port 9999 with the JMX port for your producer or consumer, and the node’s IP address.
Collect Kafka performance metrics via JMX
JConsole is a great, lightweight tool that can provide metrics snapshots very quickly, but it’s not so well-suited to the kinds of big-picture questions that arise in a production environment: What are the long-term trends for my metrics? Are there any large-scale patterns I should be aware of? Do changes in performance metrics tend to correlate with actions or events elsewhere in my environment?
To answer these kinds of questions, you need a more sophisticated monitoring system. Fortunately, many monitoring services and tools can collect JMX metrics from Kafka, whether via JMX plugins, pluggable metrics reporter libraries, or connectors that write JMX metrics out to StatsD, Graphite, or other systems.
The configuration steps depend greatly on the particular monitoring tools you choose, but JMX is a fast route to viewing Kafka performance metrics using the MBean names mentioned in Part 1 of this series.
Monitor Kafka’s page cache
Most host-level metrics identified in Part 1 can be collected with standard system utilities. Page cache reads ratio is an exception: Linux kernels earlier than 3.13 may require compile-time flags to expose this metric. Also, you’ll need to download the cachestat script created by Brendan Gregg :
wget https://raw.githubusercontent.com/brendangregg/perf-tools/master/fs/cachestatNext, make the script executable:
chmod +x cachestatThen you can execute it with ./cachestat <collection interval in seconds>. You should see output that looks similar to this example:
Counting cache functions... Output every 20 seconds. HITS MISSES DIRTIES RATIO BUFFERS_MB CACHE_MB 5352 0 234 100.0% 103 165 5168 0 260 100.0% 103 165 6572 0 259 100.0% 103 165 6504 0 253 100.0% 103 165 [...](The values in the DIRTIES column show the number of pages that have been modified after entering the page cache.)
Collect ZooKeeper metrics
As discussed in Part 1 of this series, if your Kafka deployment is not running in KRaft mode, you should monitor ZooKeeper’s health alongside Kafka’s. In this section, we’ll look at three tools you can use to collect metrics from ZooKeeper: JConsole, ZooKeeper’s “four-letter words,” and the ZooKeeper AdminServer. Using only the four-letter words or the AdminServer, you can collect all of the native ZooKeeper metrics listed in Part 1. If you are using JConsole, you can collect all but the followers and open_file_descriptor_count metrics.
(In addition to these, the zktop utility—which provides a top-like interface to ZooKeeper—is also a useful tool for monitoring your ZooKeeper ensemble. We won’t cover zktop in this post; see the documentation to learn more about it.)
Use JConsole to view JMX metrics
To view ZooKeeper metrics in JConsole, you can select the org.apache.zookeeper.server.quorum.QuorumPeerMain process if you’re monitoring a local ZooKeeper server. By default, ZooKeeper allows only local JMX connections, so to monitor a remote server, you need to manually designate a JMX port. You can specify the port by adding it to ZooKeeper’s bin/zkEnv.sh file as an environment variable, or you can include it in the command you use to start ZooKeeper, as in this example:
JMXPORT=9993 bin/zkServer.sh startNote that to enable remote monitoring of a Java process, you’ll need to set the java.rmi.server.hostname property. See the Java documentation for guidance.
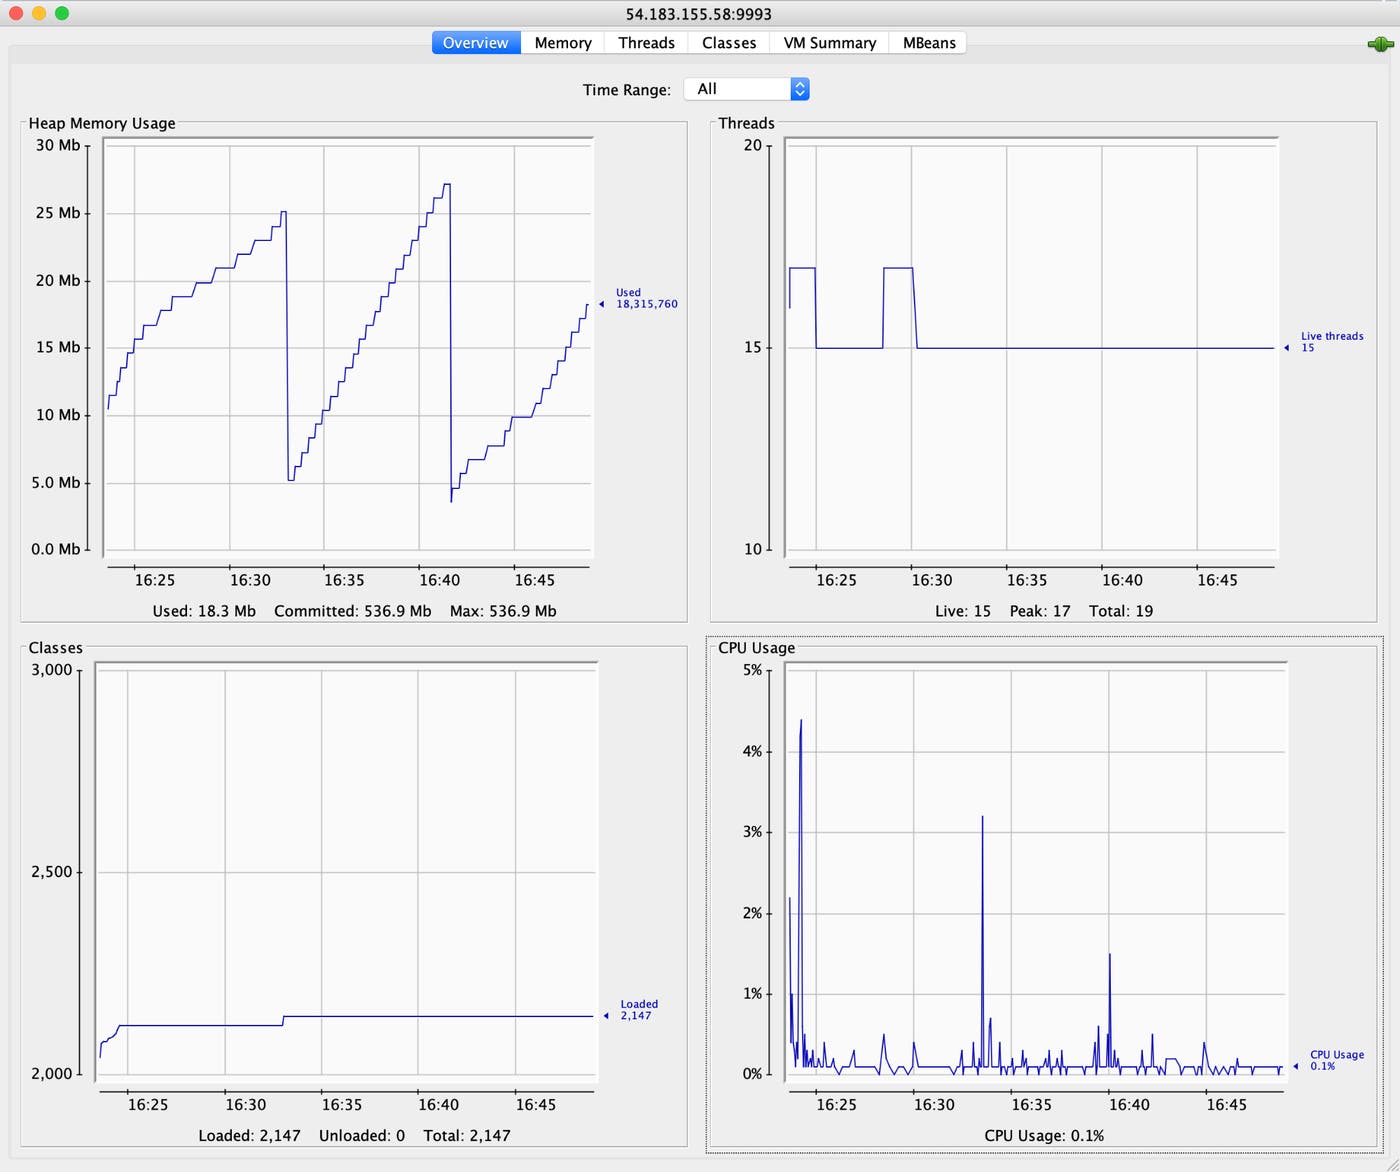
Once ZooKeeper is running and sending metrics via JMX, you can connect your JConsole instance to the remote server, as shown here:

ZooKeeper’s exact JMX path for metrics varies depending on your configuration, but invariably you can find them under the org.apache.ZooKeeperService MBean.

Using JMX, you can collect most of the metrics listed in Part 1 of this series. To collect them all, you will need to use the four-letter words or the ZooKeeper AdminServer.
The four-letter words
ZooKeeper emits operational data in response to a limited set of commands known as “the four-letter words.” Four-letter words are being deprecated in favor of the AdminServer, and as of ZooKeeper version 3.5, you need to explicitly enable each four-letter word in your configuration before you can use it. To enable one or more four-letter words, specify them in the zoo.cfg file in the conf subdirectory of your ZooKeeper installation.
You can issue a four-letter word to ZooKeeper via telnet or nc. For example, if we’ve enabled mntr in our configuration, we can use this word to get some details about the ZooKeeper server:
echo mntr | nc localhost 2181ZooKeeper responds with information similar to the example shown here:
zk_version 3.5.7-f0fdd52973d373ffd9c86b81d99842dc2c7f660e, built on 02/10/2020 11:30 GMTzk_avg_latency 0zk_max_latency 0zk_min_latency 0zk_packets_received 12zk_packets_sent 11zk_num_alive_connections 1zk_outstanding_requests 0zk_server_state standalonezk_znode_count 5zk_watch_count 0zk_ephemerals_count 0zk_approximate_data_size 44zk_open_file_descriptor_count 67zk_max_file_descriptor_count 1048576The AdminServer
As of ZooKeeper version 3.5, the AdminServer replaces the four-letter words. You can access all the same information about your ZooKeeper ensemble using the AdminServer’s HTTP endpoints. To see the available endpoints, send a request to the commands endpoint on the local ZooKeeper server:
curl http://localhost:8080/commandsYou can retrieve information from a specific endpoint with a similar command, specifying the name of the endpoint in the URL, as shown here:
curl http://localhost:8080/<ENDPOINT>AdminServer sends its output in JSON format. For example, the AdminServer’s monitor endpoint serves a similar function to the mntr word we called earlier. Sending a request to http://localhost:8080/commands/monitor yields an output that looks like this:
{ "version" : "3.5.7-f0fdd52973d373ffd9c86b81d99842dc2c7f660e, built on 02/10/2020 11:30 GMT", "avg_latency" : 0, "max_latency" : 0, "min_latency" : 0, "packets_received" : 36, "packets_sent" : 36, "num_alive_connections" : 0, "outstanding_requests" : 0, "server_state" : "standalone", "znode_count" : 5, "watch_count" : 0, "ephemerals_count" : 0, "approximate_data_size" : 44, "open_file_descriptor_count" : 68, "max_file_descriptor_count" : 1048576, "last_client_response_size" : -1, "max_client_response_size" : -1, "min_client_response_size" : -1, "command" : "monitor", "error" : null
}Production-ready Kafka performance monitoring
In this post, we have covered a few ways to access Kafka and ZooKeeper metrics using simple, lightweight tools. For production-ready monitoring, you will likely want a dynamic monitoring system that ingests Kafka performance metrics as well as key metrics from every technology in your stack. In Part 3 of this series, we’ll show you how to use Datadog to collect and view metrics—as well as logs and traces—from your Kafka deployment and gain end-to-end visibility into your data pipelines with Data Streams Monitoring.
Datadog integrates with Kafka, ZooKeeper, and more than 1,000 other technologies, so that you can analyze and alert on metrics, logs, and distributed request traces from your clusters. For more details, check out our guide to monitoring Kafka performance metrics with Datadog, or get started right away with a free trial.
Acknowledgments
Thanks to Dustin Cote at Confluent for generously sharing his Kafka expertise for this article.


