

This post is part 2 of a 3-part series on monitoring Amazon ElastiCache metrics. Part 1 explores its key performance metrics, and Part 3 describes how Coursera monitors ElastiCache metrics.
Many ElastiCache metrics can be collected from AWS via CloudWatch or directly from the cache engine, whether Redis or Memcached. When that’s the case, as discussed in Part 1, you should favor monitoring the native cache metric to ensure higher resolution and greater awareness and responsiveness. Therefore this article covers three different ways to access ElastiCache metrics from AWS CloudWatch, as well as the collection of native metrics from both caching engines:
- CloudWatch metrics
- Caching engine metrics
Using the AWS Management Console
Using the online management console is the simplest way to monitor your cache with CloudWatch. It allows you to set up basic automated alerts and to get a visual picture of recent changes in individual metrics. Of course, you won’t be able to access native metrics from your cache engine, but their CloudWatch equivalent is sometimes available (see Part 1).
Graphs
Once you are signed in to your AWS account, you can open the CloudWatch console and then browse the metrics related to the different AWS services.

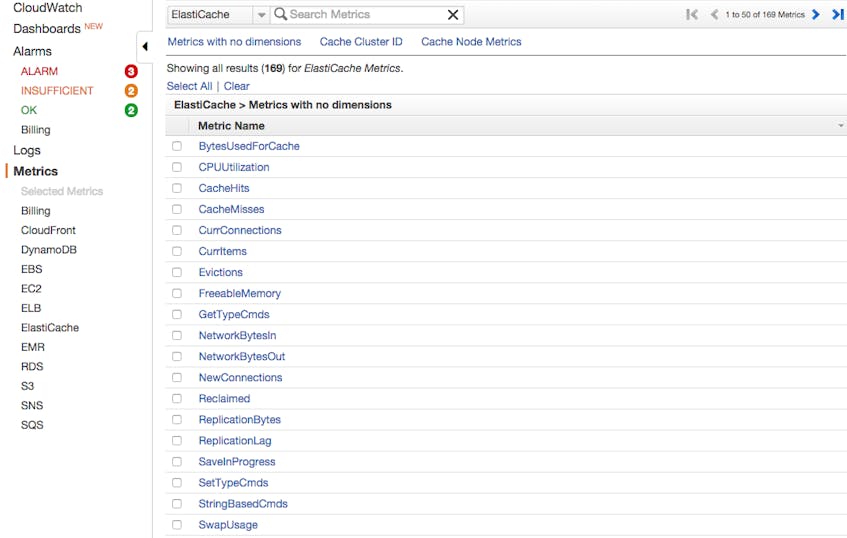
By clicking on the ElastiCache Metrics category, you will see the list of available metrics:
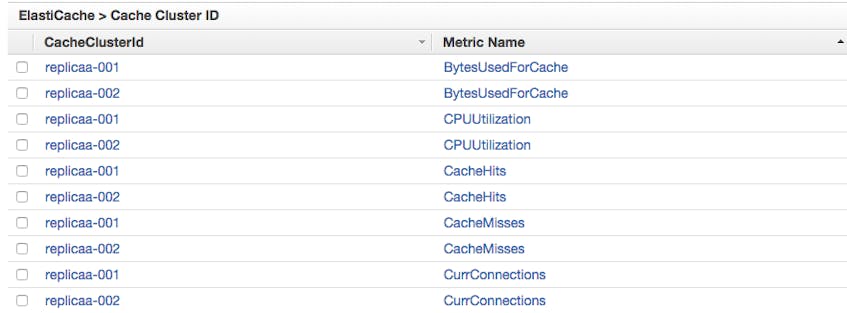
You can also view these metrics per cache cluster:
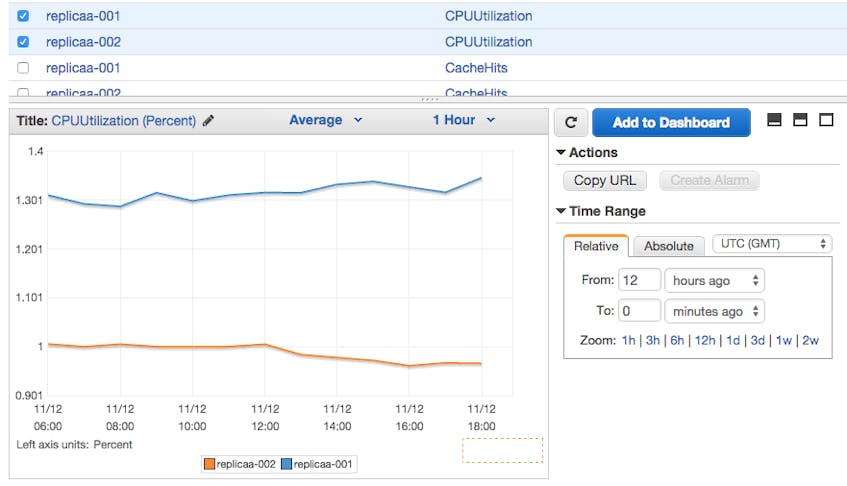
Just select the checkbox next to the metrics you want to visualize, and they will appear in the graph at the bottom of the console:
Alerts
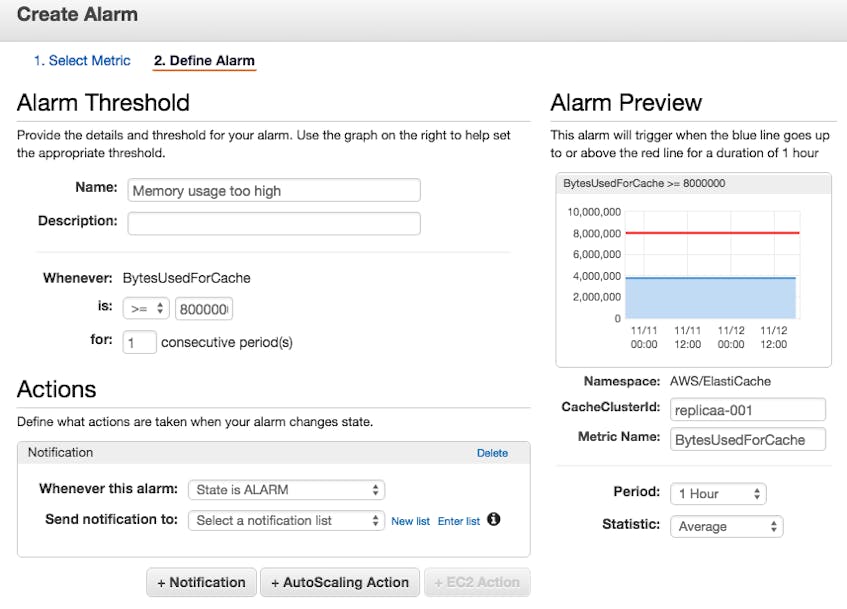
With the CloudWatch Management Console you can also create simple alerts that trigger when a metric crosses a specified threshold.
Click on the “Create Alarm” button at the right of your graph, and you will be able to set up the alert and configure it to notify a list of email addresses.
Using the AWS Command Line Interface
You can also retrieve metrics related to your cache from the command line. First you will need to install the AWS Command Line Interface (CLI) by following these instructions. You will then be able to query for any CloudWatch metric, using different filters.
Command line queries can be useful for spot checks and ad hoc investigations when you can’t, or don’t want to, use a browser.
For example, if you want to know the CPU utilization statistics for a cache cluster, you can use the CloudWatch command get-metric-statistics with the parameters you need:
(on Linux)
aws cloudwatch get-metric-statistics --namespace AWS/ElastiCache --metric-name CPUUtilization --dimensions="Name=CacheClusterId,Value=yourcachecluster" --statistics=Average --start-time 2019-10-02T00:00:00 --end-time 2019-10-02T20:00:00 --period=60Here are all the commands you can run with the AWS CLI.
Monitoring tool integrated with CloudWatch
The third way to collect CloudWatch metrics is via a dedicated monitoring tool that offers extended monitoring functionality, such as:
- Correlation of CloudWatch metrics with metrics from the caching engine and from other parts of your infrastructure
- Dynamic slicing, aggregation, and filters on metrics
- Historical data access
- Sophisticated alerting mechanisms
CloudWatch can be integrated with outside monitoring systems via API, and in many cases the integration only needs to be enabled once to deliver metrics from all your AWS services.
Collecting native Redis or Memcached metrics
CloudWatch’s ElastiCache metrics can give you good insight about your cache’s health and performance. However, as explained in Part 1, supplementing CloudWatch metrics with native cache metrics provides a fuller picture with higher-resolution data.
Redis
Redis provides extensive monitoring out of the box. The info command in the Redis command line interface gives you a snapshot of current cache performance. If you want to dig deeper, Redis also provides a number of tools offering a more detailed look at specific metrics. You will find all the information you need in our recent post about collecting Redis metrics.
For spot-checking the health of your server or looking into causes of significant latency, Redis’s built-in tools offer good insights.
However, with so many metrics exposed, getting the information you want all in one place can be a challenge. Moreover, accessing data history and correlating Redis metrics with metrics from other parts of your infrastructure can be essential. That’s why using a monitoring tool integrating with Redis, such as Datadog, will help to take the pain out of your monitoring work.
Memcached
Memcached is more limited than Redis when it comes to monitoring. The most useful tool is the stats command, which returns a snapshot of Memcached metrics. Here is an example of its output:
stats

  STAT pid 14868
  STAT uptime 175931
  STAT time 1220540125
  STAT version 1.2.2
  STAT pointer_size 32
  STAT rusage_user 620.299700
  STAT rusage_system 1545.703017
  STAT curr_items 228
  STAT total_items 779
  STAT bytes 15525
  STAT curr_connections 92
  STAT total_connections 1740
  STAT connection_structures 165
  STAT cmd_get 7411
  STAT cmd_set 28445156
  STAT get_hits 5183
  STAT get_misses 2228
  STAT evictions 0
  STAT bytes_read 2112768087
  STAT bytes_written 1000038245
  STAT limit_maxbytes 52428800
  STAT threads 1
  END
If you need more details about the commands you can run with Memcached, you can check their documentation on Github.
Obviously, you can’t rely only on this snapshot to properly monitor Memcached performance; it tells you nothing about historical values or acceptable bounds, and it is not easy to quickly digest and understand the raw data. From a devops perspective, Memcached is largely a black box, and it becomes even more complex if you run multiple or distributed instances. Other basic tools like memcache-top (for a changing, real-time snapshot) are useful but remain very limited.
Thus if you are using Memcached as your ElastiCache engine, like Coursera does (see Part 3), you should use CloudWatch or a dedicated monitoring tool that integrates with Memcached, such as Datadog.
Conclusion
In this post we have walked through how to use CloudWatch to collect, visualize, and alert on ElastiCache metrics, as well as how to access higher-resolution, native cache metrics from Redis or Memcached.
In the next and final part of this series we take you behind the scenes with Coursera’s engineering team to learn their best practices and tips for using ElastiCache and monitoring its performance with Datadog.
Source Markdown for this post is available on GitHub. Questions, corrections, additions, etc.? Please let us know.
