
Maxim Brown
In Part 1 of this series, we looked at key metrics for tracking the performance and health of your EKS cluster.
Recall that these EKS metrics fall into three general categories: Kubernetes cluster state metrics, resource metrics (at the node and container level), and AWS service metrics.
An EKS cluster consists of multiple parts and services working together. That is, because it is a Kubernetes cluster hosted on and using AWS services, the important metrics to monitor come from a variety of sources. As a result, there are multiple ways to collect them.
In this post, we will go over methods for accessing these categories of metrics, broken down by where they are generated:
- Kubernetes metrics, including cluster state and node-, pod-, and container-level resource metrics
- AWS service metrics
Finally, we’ll look at how a dedicated monitoring service can aggregate metrics from all sources and provide more complete visibility into your cluster.
Before diving into specific ways of accessing and viewing Kubernetes metrics, it’s useful to understand how the different types of metrics are exposed or generated, because that can affect how you view them.
Where Kubernetes metrics come from
Methods for accessing information about your cluster differ depending on the type of information.
- Information about the state of the objects in your cluster is available from the main Kubernetes API
- Resource usage metrics for your containers, pods, and nodes are available through the core metrics pipeline
Kubernetes API
Information about the state of your cluster is available by default through the primary Kubernetes API via a RESTful interface. This includes control plane metrics and information that is stored in the etcd data stores about the state of the objects deployed to your cluster, such as the number and condition of those objects, resource requests and limits, etc.
Control plane metrics
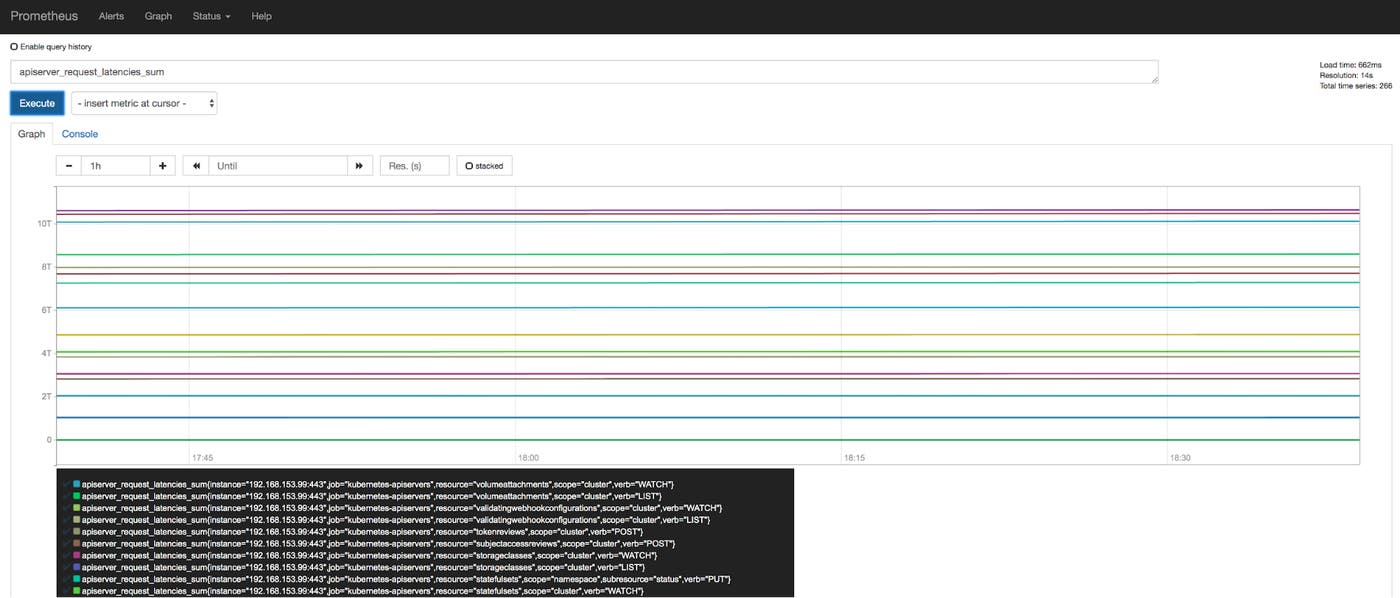
The API servers emit control plane metrics in Prometheus format, which means you can monitor these metrics with Prometheus (an open source monitoring monitoring system) or any other backend that supports this exposition format. AWS provides documentation on deploying Prometheus to your cluster, which allows you to start visualizing your cluster’s control plane metrics in graphs like the one shown below.
Cluster state information
Unlike control plane metrics, the API servers do not emit cluster state information in the form of metrics. Instead, data about the cluster state is maintained in key-value format in the etcd data stores. Tools that interact with the Kubernetes API servers through their RESTful interface, like kubectl, can access this information for monitoring purposes.
This is also where kube-state-metrics becomes useful. This service generates cluster state metrics from the state information from the core API servers, and exposes them through the Metrics API endpoint so that a monitoring service can access them. You can find steps for deploying kube-state-metrics here.
Metrics about the actual resource usage of your containers, pods, and nodes are aggregated and available through a mechanism called the core metrics pipeline.
Core metrics pipeline
The core metrics pipeline consists of a set of components that expose resource usage metrics through the Metrics API, which extends the core Kubernetes API. Each node’s kubelet uses cAdvisor to aggregate resource usage data from the containers running on that node. You can monitor these metrics by deploying a service that aggregates, stores, and exposes them through the Metrics API.
Up to Kubernetes version 1.13, this service was Heapster. Heapster has been deprecated as of Kubernetes version 1.11, and removed as of version 1.13. From version 1.8, Heapster has been replaced by Metrics Server (a pared down, lightweight version of Heapster).
Note that EKS currently runs Kubernetes versions 1.10 or 1.11, so both services are supported. Future releases of EKS will likely require you to use Metrics Server instead of Heapster to collect monitoring data from your cluster. You can find steps for deploying Heapster or Metrics Server on GitHub.
Once deployed onto your cluster, Heapster or Metrics Server will expose core resource usage metrics through the Metrics API, making them available to services like the Horizontal Pod Autoscaler; certain internal monitoring tools; and dedicated monitoring services. We will cover monitoring services in more detail below, but note that a monitoring agent on your nodes can also directly collect metrics from the node, separately from the core metrics pipeline.
Next, we will look at Kubernetes-native methods for querying cluster state metrics and resource metrics from the Kubernetes API servers (both the core API and the Metrics API).
Monitoring Kubernetes metrics
In this section, we will look at the following methods that you can use to monitor Kubernetes cluster state and resource metrics:
- Command line checks with
kubectl - The Kubernetes Dashboard web UI
Essentially, these are ways of interacting with the Kubernetes API servers’ RESTful interface to manage and view information about the cluster. (This includes metrics available through the Metrics API.) Both of these methods give you access to much of the same information in different formats. As we explore these monitoring interfaces, we will also note when either Heapster or Metrics Server is required to access all the available metrics. In any event, make sure that you have installed the kubectl command line tool and have configured it to communicate with your EKS cluster.
It is possible to gather certain resource usage metrics about your cluster directly from AWS services. For example, you can view EC2 instance CPU utilization for your worker nodes. However, monitoring them via native Kubernetes methods will provide a more accurate picture of your Kubernetes objects. In part this is because CloudWatch gathers metrics from AWS services through a hypervisor rather than reading directly from each EC2 instance. Also, CloudWatch won’t provide any insight into pod- or container-level metrics, nor does it include disk space utilization information. So, monitoring metrics emitted by Kubernetes can give you a fuller view of resource usage and activity.
Viewing Kubernetes metrics with kubectl
Once installed, you can use kubectl, the standard Kubernetes command line tool, to perform spot checks on the status and resource utilization of the objects running on your cluster. Objects can be pods and their constituent containers or the various types of pod controllers, such as Deployments. Three commands that are particularly useful for monitoring are:
You can also view logs from individual pods using the kubectl logs <POD> command, which is useful for troubleshooting problems.
Viewing object state with kubectl get
The kubectl get <OBJECT> command will retrieve cluster state metrics for the requested object or type of object. For example:
# Get a list of all Deployments$ kubectl get deployments
NAME DESIRED CURRENT UP-TO-DATE AVAILABLE AGEapp 3 3 3 0 17snginx 1 1 1 1 23mredis 1 1 1 1 23mThe above example shows three Deployments on our cluster. For the app Deployment, we see that, although the three requested (DESIRED) pods are currently running (CURRENT), they are not ready for use (AVAILABLE). In this case, it’s because the Deployment configuration specifies that pods running in this Deployment must be healthy for 90 seconds before they will be made available, and the Deployment was launched 17 seconds ago.
Likewise, we can see that the nginx and redis Deployments request one pod each and that both of them currently have one pod running. We also see that these pods reflect the most recent desired state for those pods (UP-TO-DATE) and are available.
Viewing resource usage metrics with kubectl top
The command kubectl top will show current CPU and memory usage for the pods or nodes across your cluster, or for a specific pod or node if one is requested. Note that this command queries the Metrics API and so only works if you have deployed Metrics Server or Heapster to your cluster.
For example:
# Display resource metrics by node$ kubectl top nodes
NAME CPU(cores) CPU% MEMORY(bytes) MEMORY%ip-195-174-159-154.us-west-2.compute.internal 96m 4% 1774Mi 46%ip-195-174-203-72.us-west-2.compute.internal 85m 4% 2067Mi 53%ip-195-174-218-22.us-west-2.compute.internal 73m 3% 2098Mi 54%ip-195-174-60-154.us-west-2.compute.internal 95m 4% 2225Mi 57%This output shows the four worker nodes in our EKS cluster. Each line displays the total amount of CPU (in cores, or in this case m for millicores) and memory (in MiB) that the node is using, and the percentage of the node’s allocatable capacity that number represents. That is, kubectl top shows actual resource usage instead of requests and limits.
Likewise, if we wanted to see resource utilization by pod, we could use the command:
# Display resource metrics by pod$ kubectl top pods
NAME CPU(cores) MEMORY(bytes)app-659bc95bf5-9jrhg 35m 127Miapp-659bc95bf5-c5zgx 31m 128Miapp-659bc95bf5-d3krr 28m 141Miapp-659bc95bf5-7ptew 39m 129Mimongo-0 5m 156Mimongo-1 6m 138Mimongo-2 6m 138Minginx-69cb46b4db-clkhz 0m 15Miredis-775cf646c-xlzj2 0m 2MiYou can also display the resource usage broken down by container across all pods or for a specified pod by adding a --containers flag:
# Display metrics for containers in the pod `mongo-0`$ kubectl top pod mongo-0 --containersPOD NAME CPU(cores) MEMORY(bytes)mongo-0 mongo 4m 58Mimongo-0 mongo-sidecar 1m 62MiViewing details with kubectl describe
This command provides more detail about—or describes—a specific pod or node. This can be particularly useful to see a breakdown of the resource requests and limits of all of the pods on a specific node. We can see details of a node by providing its hostname. For example, if we have an EC2 worker node called ip-123-456-789-101.us-west-2.compute.internal, we would view it with:
# Display information about the specified node$ kubectl describe node ip-123-456-789-101.us-west-2.compute.internal
Name: ip-123-456-789-101.us-west-2.compute.internalRoles: <none>Labels: beta.kubernetes.io/arch=amd64 beta.kubernetes.io/instance-type=t3.medium beta.kubernetes.io/os=linux failure-domain.beta.kubernetes.io/region=us-west-2 failure-domain.beta.kubernetes.io/zone=us-west-2a kubernetes.io/hostname=ip-123-456-789-101.us-west-2.compute.internalAnnotations: node.alpha.kubernetes.io/ttl: 0 volumes.kubernetes.io/controller-managed-attach-detach: trueCreationTimestamp: Fri, 22 Feb 2019 20:34:18 -0500Taints: <none>Unschedulable: falseConditions: Type Status LastHeartbeatTime LastTransitionTime Reason Message ---- ------ ----------------- ------------------ ------ ------- OutOfDisk False Thu, 21 Mar 2019 14:24:12 -0400 Tue, 12 Mar 2019 17:38:33 -0400 KubeletHasSufficientDisk kubelet has sufficient disk space available MemoryPressure False Thu, 21 Mar 2019 14:24:12 -0400 Tue, 12 Mar 2019 17:38:33 -0400 KubeletHasSufficientMemory kubelet has sufficient memory available DiskPressure False Thu, 21 Mar 2019 14:24:12 -0400 Tue, 12 Mar 2019 17:38:33 -0400 KubeletHasNoDiskPressure kubelet has no disk pressure PIDPressure False Thu, 21 Mar 2019 14:24:12 -0400 Fri, 22 Feb 2019 20:34:18 -0500 KubeletHasSufficientPID kubelet has sufficient PID available Ready True Thu, 21 Mar 2019 14:24:12 -0400 Tue, 12 Mar 2019 17:38:33 -0400 KubeletReady kubelet is posting ready statusAddresses: InternalIP: 123.456.789.101 ExternalIP: 34.233.1.62 InternalDNS: ip-123-456-789-101.us-west-2.compute.internal ExternalDNS: ec2-34-233-1-62.us-west-2.compute.amazonaws.com Hostname: ip-123-456-789-101.us-west-2.compute.internalCapacity: cpu: 2 ephemeral-storage: 20959212Ki hugepages-1Gi: 0 hugepages-2Mi: 0 memory: 3980352Ki pods: 17Allocatable: cpu: 2 ephemeral-storage: 19316009748 hugepages-1Gi: 0 hugepages-2Mi: 0 memory: 3877952Ki pods: 17System Info: Machine ID: ec284685218339a0e77c09df69f51012 System UUID: EC284685-2183-39A0-E77C-09DF69F51012 Boot ID: e91314fc-a4d9-4e67-b25a-c49bd3cbcbf4 Kernel Version: 4.14.88-88.76.amzn2.x86_64 OS Image: Amazon Linux 2 Operating System: linux Architecture: amd64 Container Runtime Version: docker://17.6.2 Kubelet Version: v1.11.5 Kube-Proxy Version: v1.11.5ProviderID: aws:///us-west-2a/i-0e9c4440d50d8cd6dNon-terminated Pods: (9 in total) Namespace Name CPU Requests CPU Limits Memory Requests Memory Limits AGE --------- ---- ------------ ---------- --------------- ------------- --- default dd-agent-kpp52 200m (10%) 200m (10%) 256Mi (6%) 256Mi (6%) 26d default fan-6c948597c6-7hhtp 1 (50%) 2 (100%) 0 (0%) 0 (0%) 19s default mongo-1 0 (0%) 0 (0%) 0 (0%) 0 (0%) 4h1m default nginx-58d9d765d9-h4vzg 0 (0%) 0 (0%) 0 (0%) 0 (0%) 3h58m default redis-768579489d-c4tf9 0 (0%) 0 (0%) 0 (0%) 0 (0%) 3h58m default warped-mongoose-mysql-97d64d8b9-6zr9l 100m (5%) 0 (0%) 256Mi (6%) 0 (0%) 8d helm phpfpm-mariadb-59f5cc6dc4-6dmsx 250m (12%) 0 (0%) 256Mi (6%) 0 (0%) 8d kube-system aws-node-5j86v 10m (0%) 0 (0%) 0 (0%) 0 (0%) 26d kube-system kube-proxy-rcpsk 100m (5%) 0 (0%) 0 (0%) 0 (0%) 26dAllocated resources: (Total limits may be over 100 percent, i.e., overcommitted.) Resource Requests Limits -------- -------- ------ cpu 1660m (83%) 2200m (110%) memory 768Mi (20%) 256Mi (6%) ephemeral-storage 0 (0%) 0 (0%)Events: <none>There is a lot of information included in the return output. We can see various metadata for the node, including labels and annotations; condition checks reporting things like whether the node is out of disk space; overall and allocatable resource capacity, and a breakdown of memory and CPU requests and limits by pod.
Note that the output includes the percent of total available capacity that each resource request or limit represents. These statistics are not a measure of actual CPU or memory utilization, as would be returned by kubectl top. In the above example, we see that the pod fan-6c948597c6-7hhtp has a CPU request of one core, and that this represents 50 percent of the node’s capacity, which is two cores. Likewise, for the node summary at the bottom, we see that the total CPU requests of all pods on the node is 1,660 millicores, or 1.66 cores, which is 83 percent of the total available capacity.
Viewing pod logs with kubectl logs
Viewing metrics and metadata about your nodes and pods can alert you to problems with your cluster. For example, you can see if replicas for a Deployment are not launching properly, or if your nodes have little remaining resource capacity. But troubleshooting a problem may require more detailed information. This is where logs can come in handy.
The kubectl logs command dumps or stream logs written to stdout from a specific pod or container:
$ kubectl logs <POD_NAME>$ kubectl logs <POD_NAME> -c <CONTAINER_NAME>By itself, this command will simply dump all stdout logs from the specified pod or container. And this does mean all, so trying to filter or reduce the log output can be useful. For example, the --tail flag lets you restrict the output to a set number of the most recent log messages:
$ kubectl logs --tail=25 <POD_NAME>Another useful flag is --previous. This will return logs for a previous instance of the specified pod or container, which can be useful for viewing logs of a crashed pod:
kubectl logs webapp-659cd65bf5-c5zgx --previousKubernetes Dashboard
Kubernetes Dashboard is a web-based UI for administering and monitoring your cluster. Essentially, it is a graphical wrapper for the same functions that kubectl can serve; you can use Kubernetes Dashboard to deploy and manage applications, monitor your Kubernetes objects, and more. It organizes and provides visualizations of the information about your cluster that you can access through the command line, including cluster state and resource metrics.
In order to use Kubernetes Dashboard, you must deploy it and a few supporting services to your cluster. This includes an InfluxDB timeseries database, which is used to store the metric information for persistence. (Kubernetes Dashboard will retain and display resource usage metrics for the past 15 minutes.)
Next, while Kubernetes Dashboard will display cluster state metrics by default, in order to view resource usage metrics from the Metrics API, you must make sure that you have already deployed Heapster. Note that Kubernetes Dashboard does not currently support Metrics Server. So even if you have already deployed Metrics Server, you will still need to deploy Heapster in order to view resource utilization metrics in Kubernetes Dashboard.
See AWS’s documentation for detailed steps on deploying Dashboard and its supporting services, creating the necessary eks-admin service account, and then accessing Dashboard.
Once you’ve signed in to Kubernetes Dashboard, the main page will show you the overall status of your cluster:
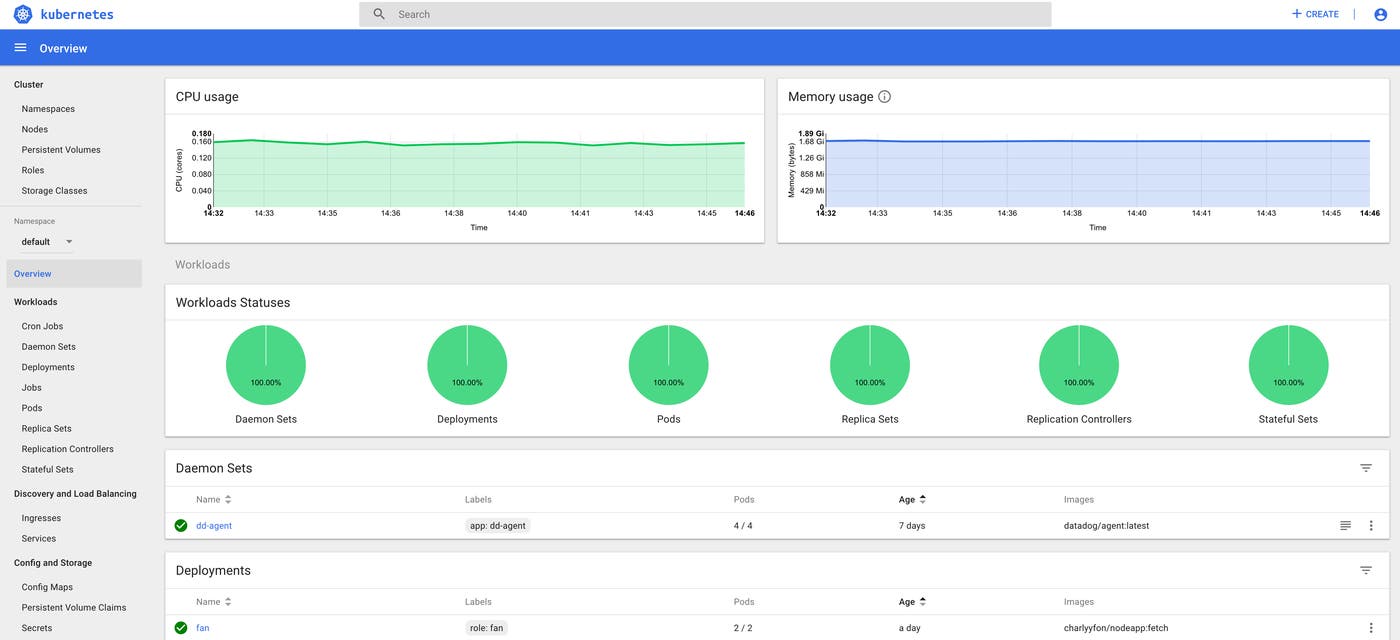
Here you can view much of the same information about the objects in your cluster as we saw from queries through kubectl. For example, selecting Pods in the sidebar shows an overview of pod metadata as well as resource usage information—if you have deployed Heapster—similar to what kubectl top pods would return. You can also view logs from a specific pod by clicking the icon to the far right in the pod’s row.

Viewing a single node displays, among other information, CPU and memory allocation and usage data. This visualizes similar data available from kubectl describe <NODE>:
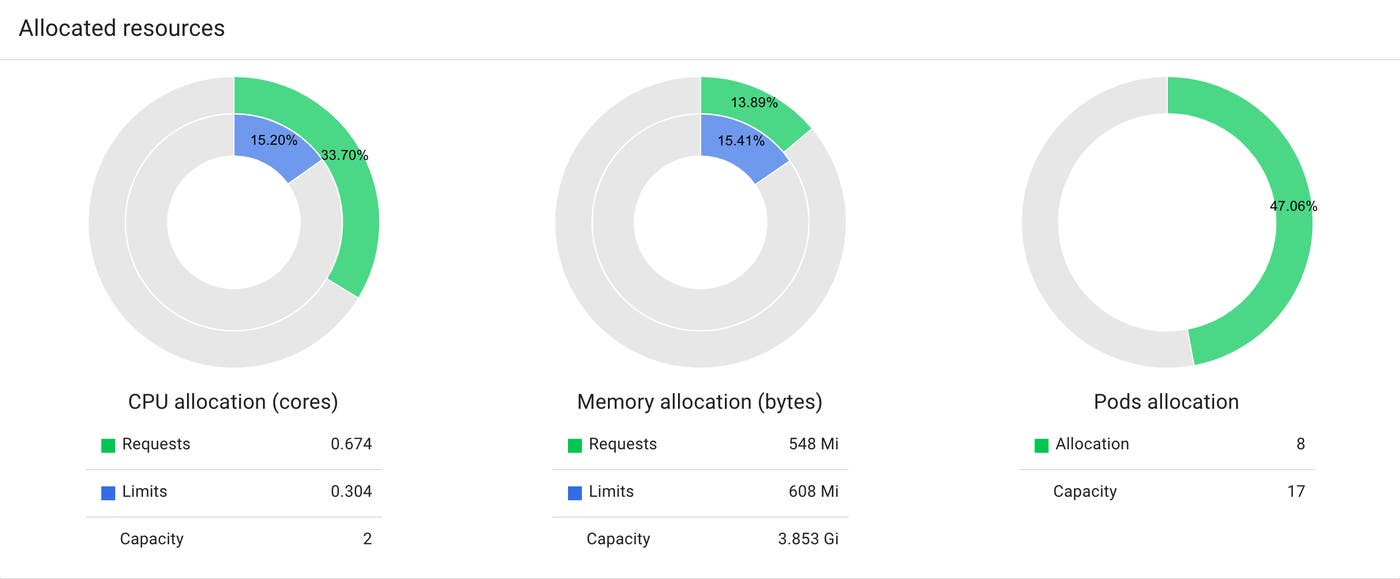
In this case we see the requests and limits of CPU and memory for that node, and what percentage of the node’s allocatable capacity those requests and limits represent. We also see how many pods the node can hold and how many pods are currently running. Note again that, like kubectl describe, this information is different from what’s returned by something like kubectl top, which reports that node or pod’s actual CPU or memory usage.
So far, we have covered two primary tools for monitoring Kubernetes metrics: Kubernetes Dashboard and the kubectl command line tool. But if you are running an EKS cluster, Kubernetes metrics are likely only part of the story because you are using AWS services to provision components of your infrastructure. Since metrics for these services are not available from Kubernetes, we will look at how to monitor them to get greater visibility into your cluster’s performance. This is primarily done using AWS CloudWatch.
Monitoring AWS services with CloudWatch
CloudWatch is Amazon’s built-in monitoring platform for AWS services. In other words, it aggregates and exposes metrics, logs, and events from AWS resources. As such, it is one of the easiest ways to collect metrics for the AWS services that your EKS cluster uses. This includes, for example, overall resource utilization metrics for your EC2 instances, disk I/O metrics for your persistent EBS volumes, latency and throughput metrics for your load balancers, and others.
You can collect metrics from CloudWatch with:
- the CloudWatch web console
- the AWS command line tool, or
- a separate library or monitoring tool that accesses the CloudWatch API
In each case, you’ll need to configure secure access to the CloudWatch API. The permissions required to access CloudWatch are different from those attached to the EKS service role needed to administer your EKS cluster—see the AWS documentation for more information.
Using the CloudWatch web console
The AWS CloudWatch web console lets users visualize and alert on metrics from most AWS services. CloudWatch provides a number of prebuilt dashboards for individual services, and a cross-service dashboard that shows select metrics from across your services. You can also create custom dashboards to correlate metrics that are most important to you.
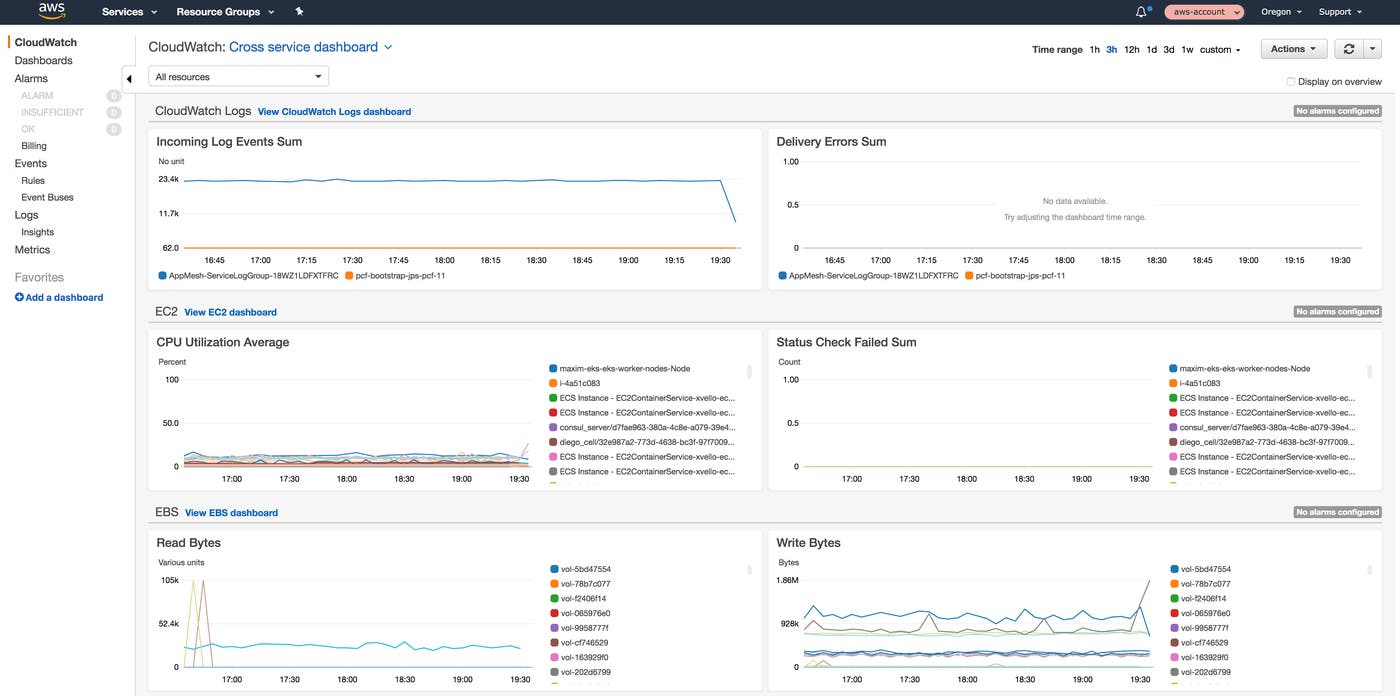
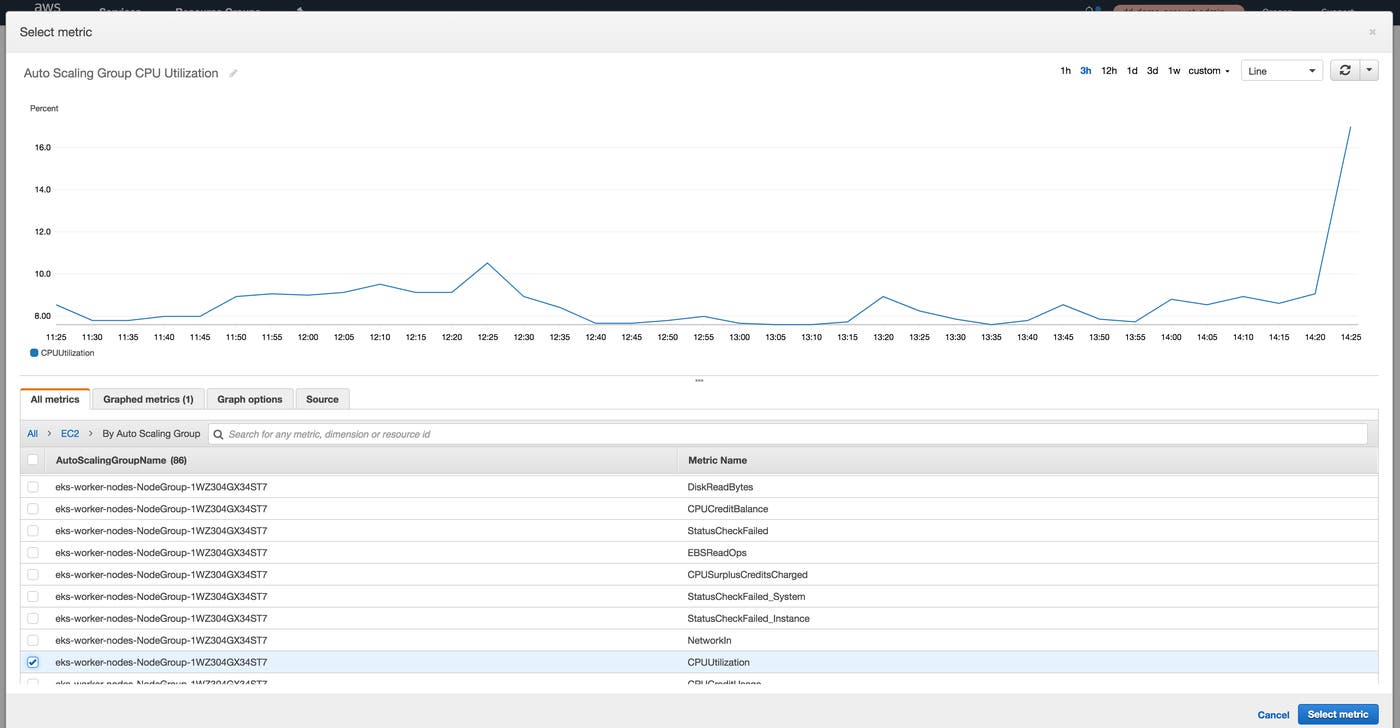
The Metrics tab of the web console lets you select individual AWS services and then view metrics for specific resources within that service. Resources are identified via various CloudWatch dimensions, which act as tags. For example, you can use the AutoScalingGroupName dimension to view CPU utilization for the EC2 instances that are part of a specific Auto Scaling group.
Setting alarms
Actively monitoring your AWS resources all the time isn’t really feasible, so CloudWatch lets you set alarms that will trigger when a specific metric from an AWS service exceeds or falls below a set threshold. For an EKS cluster, which is a potentially very dynamic environment, setting proper alarms can make you aware of problems sooner. For example, you might want to be alerted if the CPU load on your instances rises above a certain point, perhaps due to a surge in usage or maybe because of a problem with the pods running on the nodes.
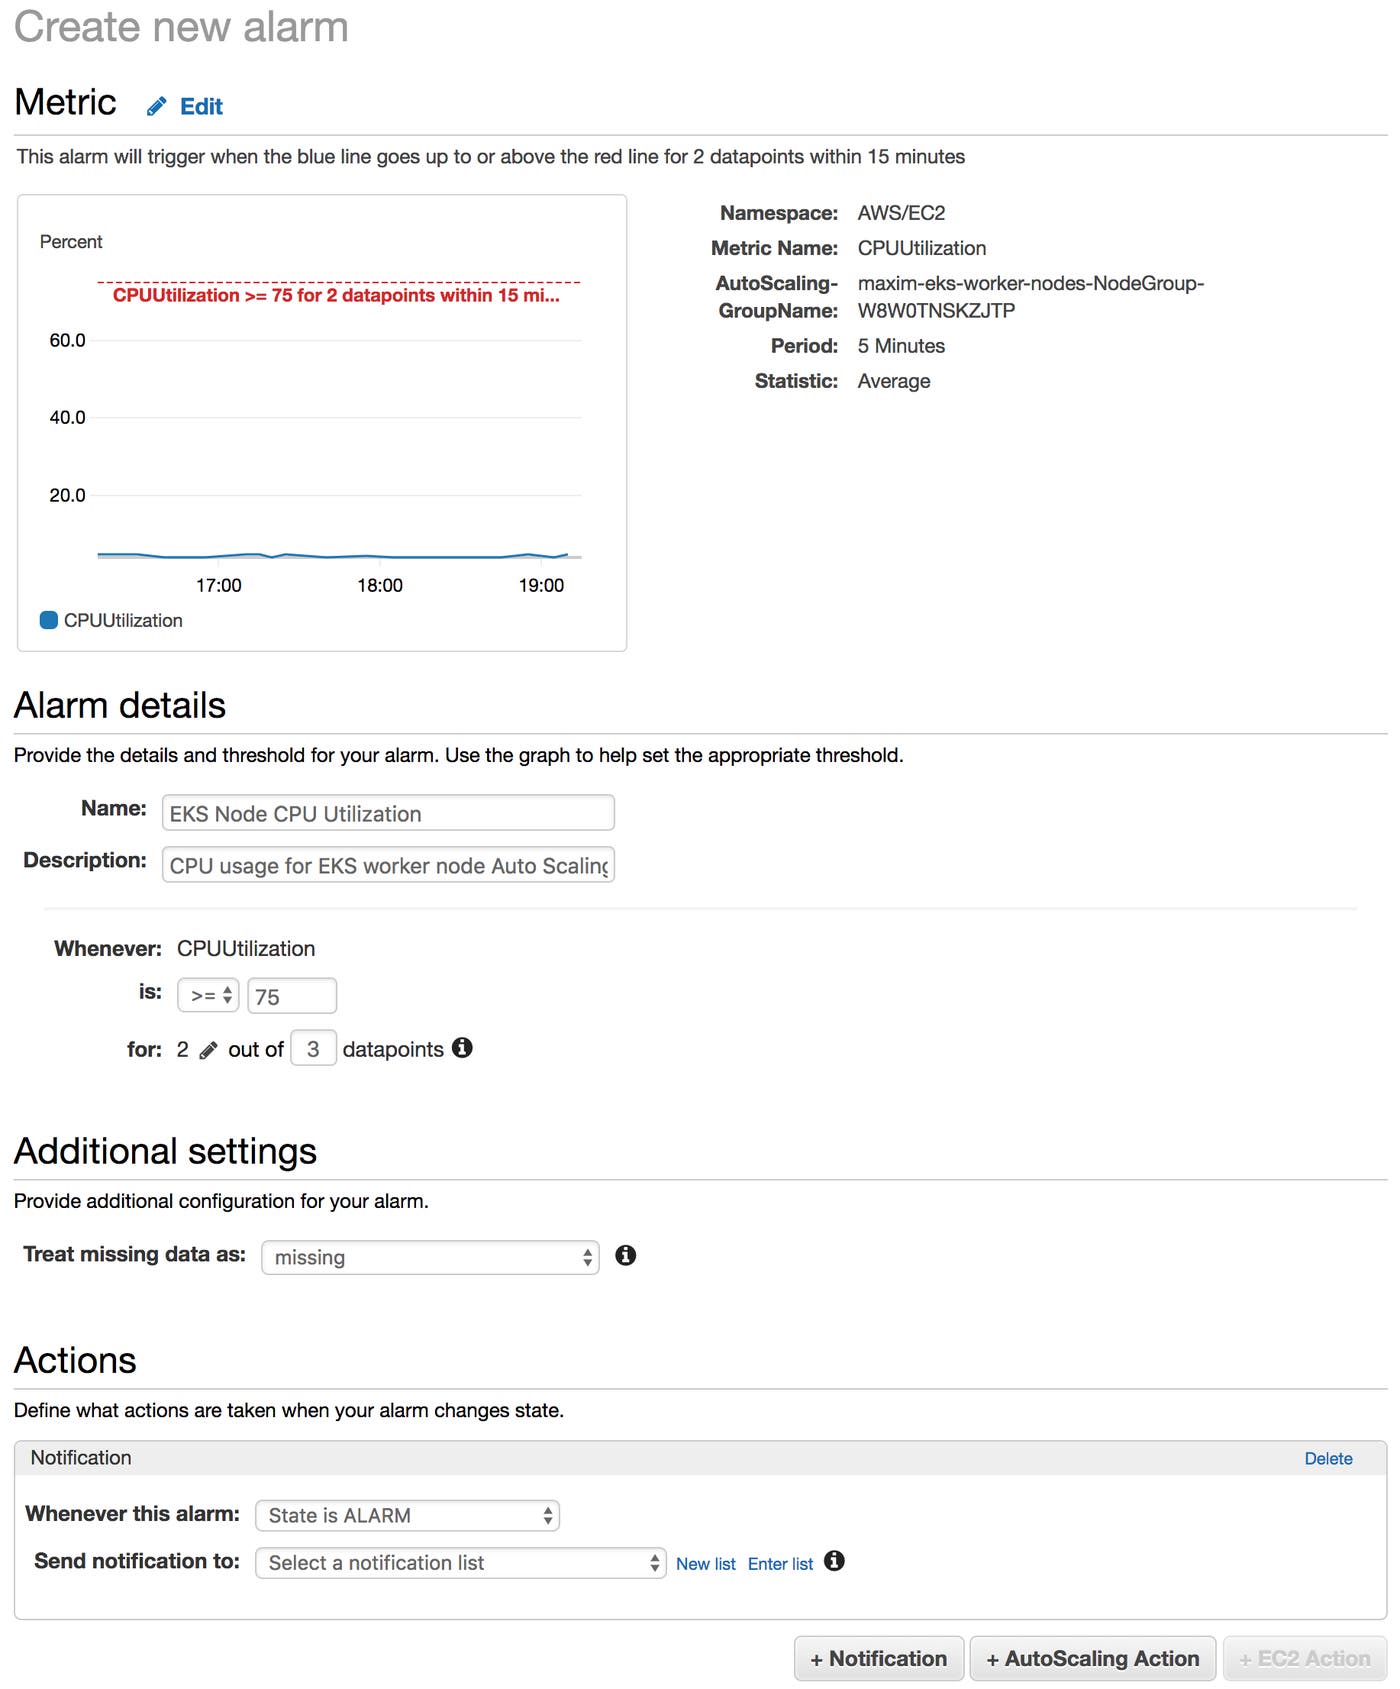
Below, we’re creating an alarm that triggers if the average CPU utilization of EC2 instances in our Auto Scaling group is 75 percent or greater for two out of three measured datapoints. (In this case, datapoints are aggregated at five-minute intervals, so this metric would have to be above the threshold for two datapoints within a 15-minute period.)
You can configure your triggered alarms to send a notification to the appropriate team, or even initiate actions like starting or rebooting an EC2 instance.
If you created an Auto Scaling policy for your worker node group, for example to scale up your node fleet to maintain a specified average CPU utilization, AWS will automatically add that policy as a CloudWatch alarm to alert you if the policy is triggered.
Using the AWS command line interface (CLI) tool
The AWS CLI tool gives you full access to the AWS API from the command line. You can query CloudWatch metrics and statuses of your AWS resources using available commands. In particular, you can use the CloudWatch get-metric-statistics command to request metrics for a specific service.
When using get-metric-statistics, you must include parameters for:
- the service you are querying (i.e., the namespace, such as ELB or EC2)
- the metric you are requesting
- the start and end times for the period you want to see
- the data aggregation period in seconds
- what aggregation method you want to see (e.g., average, sum, etc.)
For example, the query below requests average latency across available load balancers for a one-hour period at a resolution of 900 seconds (15 minutes):
aws cloudwatch get-metric-statistics --namespace AWS/ELB --metric-name Latency --start-time 2018-11-15T12:30:00 --end-time 2018-11-15T13:30:00 --period 900 --statistics AverageThe JSON response would look like:
{ "Label": "Latency", "Datapoints": [ { "Timestamp": "2018-11-15T13:15:00Z", "Average": 1.050143682656168e-05, "Unit": "Seconds" }, { "Timestamp": "2018-11-15T12:30:00Z", "Average": 1.0529491636488173e-05, "Unit": "Seconds" }, { "Timestamp": "2018-11-15T13:00:00Z", "Average": 1.0495480423268203e-05, "Unit": "Seconds" }, { "Timestamp": "2018-11-15T12:45:00Z", "Average": 1.0344941737288135e-05, "Unit": "Seconds" } ]}Using the AWS API
In addition to the CloudWatch web console and the CLI tool, Amazon provides SDKs to interact with AWS APIs. You can see AWS’s developer documentation for more information on supported languages and platforms for developing a custom solution. Many third-party monitoring products and services use these to access, for example, the CloudWatch API and aggregate metrics automatically.
For more details about monitoring AWS services using CloudWatch, see our guides for EC2, EBS, and ELB.
Viewing your cluster from every angle
We’ve now looked at methods for collecting the key EKS cluster metrics we discussed in Part 1. To access Kubernetes cluster state metrics and resource metrics from your nodes and pods, you can use a variety of kubectl commands, or Kubernetes Dashboard for a graphical version. And you can use AWS CloudWatch to visualize, monitor, and alert on metrics emitted by the AWS services that power your EKS cluster.
However, these methods do have some drawbacks. While you can get Kubernetes pod-level information, it’s difficult to get resource metrics on a container level. Nor will these tools or services let you monitor the applications or technologies running on your cluster. Plus, using multiple monitoring solutions to look at different parts of your infrastructure can make correlating metrics more difficult.
Putting it all together with a dedicated monitoring service
A dedicated monitoring service gives you a more complete picture of your EKS cluster’s health and performance. It can centralize all of these sources of data into the same platform, and it can use an agent to access resource metrics directly from the node and its kubelet, without requiring you to install Metrics Server or Heapster. By deploying kube-state-metrics, you can also aggregate cluster state information, letting you view cluster state metrics, resource usage metrics, and AWS metrics all in one central monitoring platform.
Datadog’s Kubernetes, Docker, and AWS integrations let you collect, visualize, and monitor all of these metrics and more. In the final post of this series, we will cover how to use Datadog to monitor your entire EKS cluster—from the AWS components it relies on, to the state of its deployments, to the applications running on it—from a unified platform.
Acknowledgment
We wish to thank our friends at AWS for their technical review of this series.
Source Markdown for this post is available on GitHub. Questions, corrections, additions, etc.? Please let us know.


