

Google Cloud Run is a managed platform for the deployment, management, and scaling of workloads using serverless containers. Datadog’s integrations for Google Cloud Run and Google Cloud Platform enable you to collect and visualize metrics from your containerized workloads, as well as application and platform logs from Google Cloud Run.
You can now deploy the Datadog Agent with your Google Cloud Run applications to collect traces, logs, and custom metrics directly from your managed Cloud Run services. Our serverless Agent is specifically built to run as a process within each application container, enabling you to collect and deliver telemetry data in near-real time.
In this post, we’ll explore how to:
- Visualize your Cloud Run services with the Datadog Serverless view
- Investigate issues in your serverless workloads with metrics, traces, and logs
- Monitor enhanced and custom Cloud Run metrics
Visualize your Cloud Run telemetry with the Datadog Serverless view
Collecting request traces and logs from your serverless containers helps you better understand their performance, quickly locate bottlenecks, and investigate potential root causes of issues. By instrumenting your Cloud Run services, you can ensure that traces and logs are sent directly from your containerized workloads to Datadog. As you deploy new workloads or update existing ones, the Serverless view continuously gathers key telemetry within a single location to give you comprehensive visibility into Cloud Run services and the rest of your serverless stack. You can visualize request throughput, latency, and error rates from your serverless applications, and quickly filter your workloads by service, environment, version, and other tags to inspect any subset of your environment.
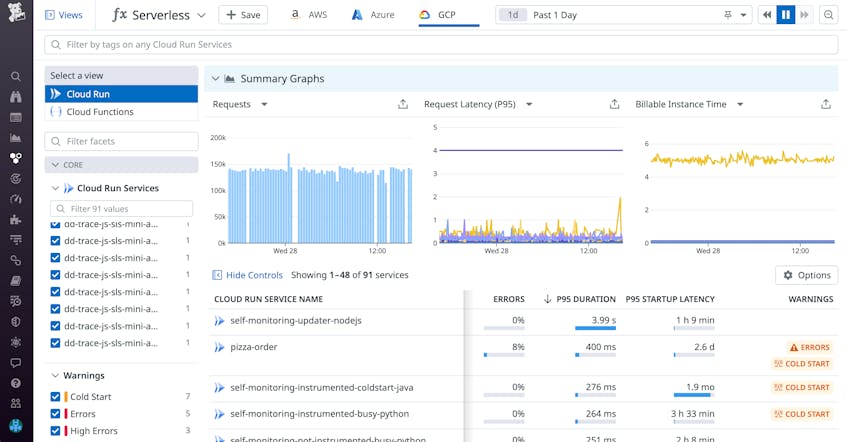
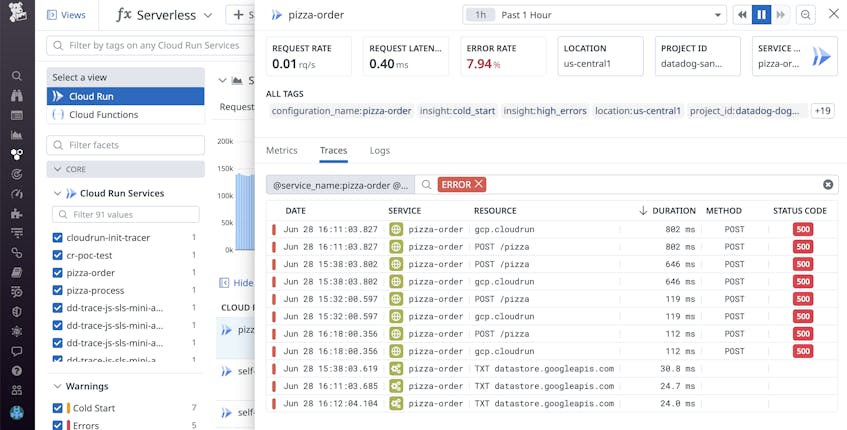
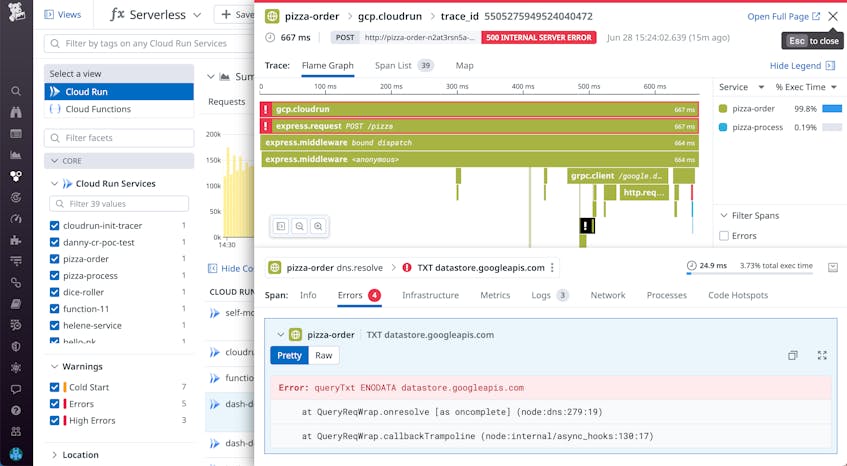
For example, the pizza-order service shown above exhibits a high error rate. By inspecting the service, you can pivot directly to its associated traces (shown below) and logs. You can then sort errorful traces by duration and status code to identify slow requests or client/server HTTP errors that can help narrow down the root cause of the issue you’re facing.
Investigate your serverless workloads with metrics, traces, and logs
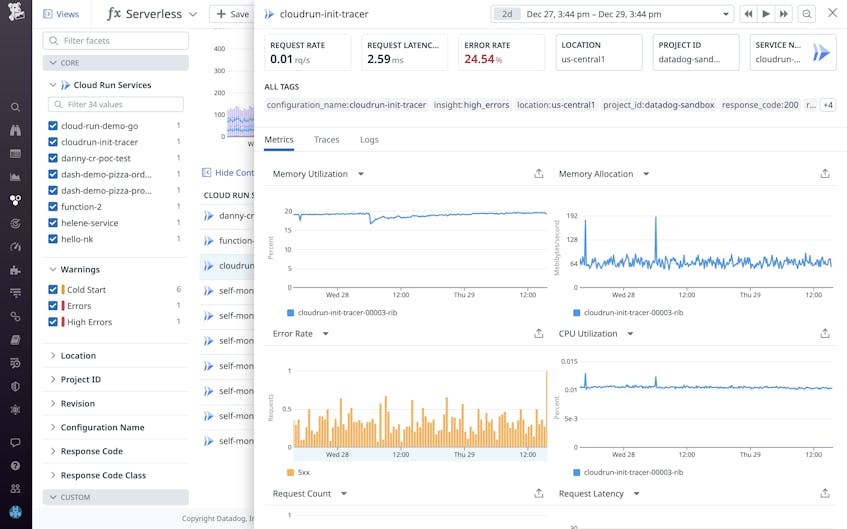
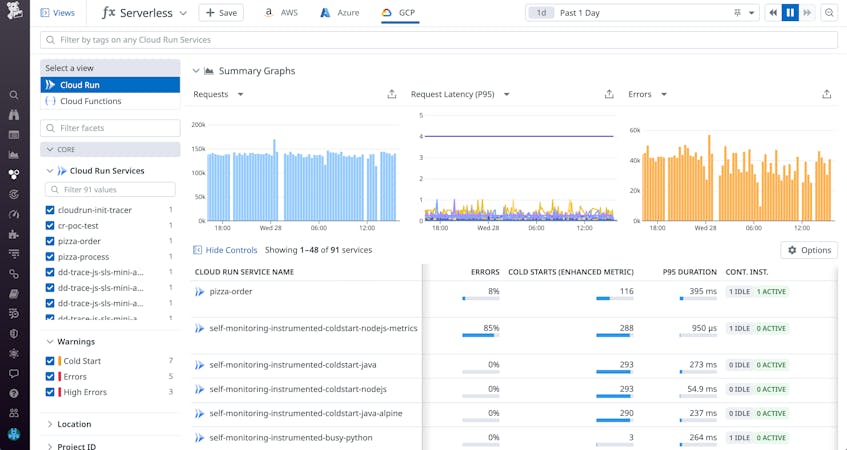
When errors arise in your serverless workloads, the Serverless view provides the perfect launching point to begin troubleshooting. You can view metrics that are specific to each service (e.g., CPU utilization, memory usage, and billable instance times from Cloud Run services, or failed executions from Cloud Functions), that can help you debug performance issues. For example, the error rate graph is broken down by response code, so you can easily determine whether issues are occurring on the client (4xx) or server side (5xx). You can also correlate error spikes with other performance metrics and resource utilization metrics, allowing you to pin down potential sources of errors.
While metrics can give you a glimpse into the health of a service, traces and logs can further help you pinpoint the root cause of an error or service slowdown. If, for example, you identify a service with an elevated error rate, you can then drill into a relevant trace and inspect its flame graph to begin troubleshooting. You can immediately look at relevant service metrics for the span that experienced the error and observe a latency spike.
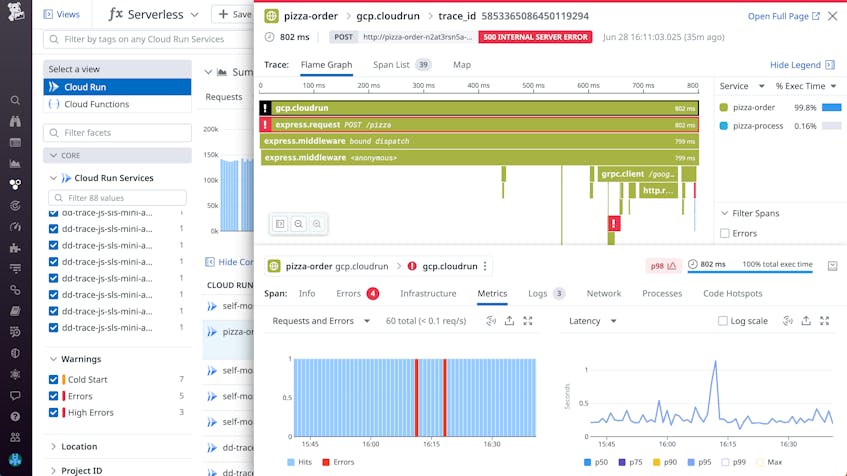
From an errorful trace, you can easily troubleshoot by pivoting to logs or errors. In the example shown below, the Errors tab displays the full error message and a stack trace, which reveal that the request is not resolving properly when attempting to access a particular Google API endpoint. This gives you a solid starting point for further investigation.
Monitor enhanced and custom Cloud Run metrics
Cold starts and shutdowns are two key events that can affect your overall workload performance and resource consumption. Datadog generates enhanced Cloud Run metrics for cold starts and shutdowns, enabling you to track their prevalence within your workloads. Cold starts occur when there are no provisioned containers available to run your function—Cloud Run must then create a new container to execute the request, leading to startup delay. Depending on the memory allocated and runtime (among other variables), your function’s cold start can add an impactful amount of latency to your invocations and ultimately degrade customer experience. Inversely, shutdowns result from Cloud Run terminating containers that are idle, that encounter an application error, or that exceed their memory limits.
Datadog automatically tags your Cloud Run traces of function calls that experience a cold start or shutdown. This enables you to track whether their volume is appropriate for your application’s request throughput, since high-throughput applications should have a steady supply of available containers. If you notice that your application is experiencing a high volume of cold starts, you may need to scale up the number of containers running. Alternatively, a high volume of shutdowns may indicate an application error causing forced exits, or that your provisioned workloads are exceeding their container’s memory limit. You can use the Serverless view to pinpoint any problematic trends in your services’ enhanced metrics (e.g., high errors or cold starts), as shown below.
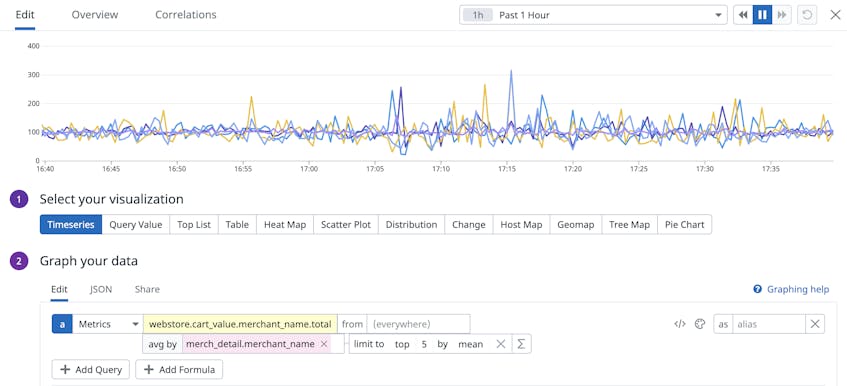
You can also instrument your Cloud Run functions to send custom metrics to Datadog. With custom metrics, you can monitor KPIs specific to your business, such as the value of each order processed by your web store or the volume of seasonal coupons applied at checkout. Once Datadog begins receiving your metric, you can use it as you would any standard metric to set alerts and SLO targets, or visualize them as dashboard widgets. In the example below, we’ve instrumented our web store application to track the cart value for each checkout. By graphing the cart values from our top merchants, we can visualize the impact of our sales platform and customer purchase trends.
Get deep insights into your Google Cloud Run workloads
With enhanced invocation metrics and the ability to collect custom metrics, traces, and logs, Datadog provides even deeper insights into your managed Cloud Run workloads. Instrument your Cloud Run application with Datadog so you can begin exploring your data in the Serverless view today.
If you aren’t already a Datadog customer, sign for up for a free 14-day trial.
