For most organizations, GitHub is mission critical. Your GitHub repositories likely also contain some of your organization’s most sensitive data. GitHub provides tools to help you protect and govern this data, with tools such as audit logs, code scanning alerts, and secret scanning alerts. However, analyzing these logs and alerts through GitHub’s UI can be challenging. For example, looking for trends in your code scanning alerts over time through GitHub’s UI is just not possible. Similarly, it can be hard to identify which user activity triggered what workflow and measure the success rate of these workflows. With Datadog’s updated GitHub integration, you can now pull your GitHib audit logs and alerts into Datadog—where you can visualize, alert on, and analyze them for key insights into your organization’s GitHub activity.
In this post, we’ll show how Datadog enables you to:
- Monitor and audit GitHub activity across your organization
- Set alerts on potential code vulnerabilities
Audit activity across your organization
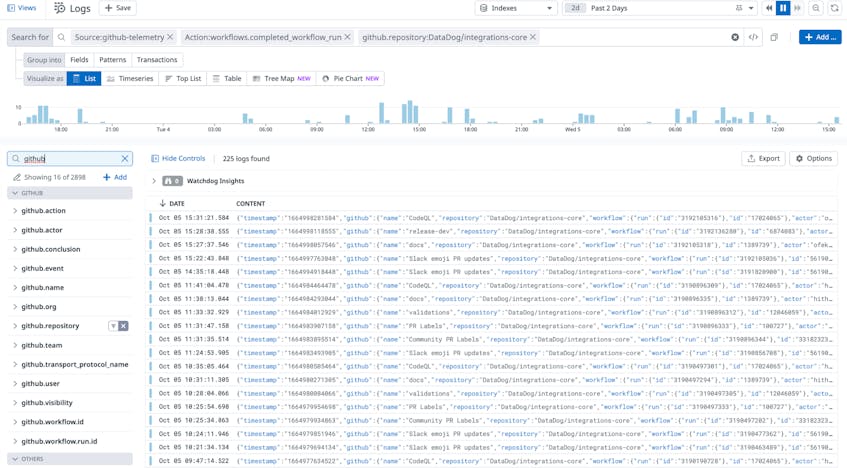
Once you’ve set up the integration, Datadog begins ingesting audit logs from your GitHub organization. Datadog automatically tags these logs with source:github-telemetry, so you can filter them with the Datadog Log Explorer to see every action taken across your GitHub organization in a single view. Once you’ve filtered your logs to this source, you can use the GitHub group in the left sidebar to dive deeper by using other facets such as github.event, github.action, or github.workflow.id.
With Datadog Log Analytics, you can group your logs by these facets to gain more insights into your GitHub usage. For example, grouping the logs by github.repository shows the breakdown of events in your repositories. By counting the unique evt.categories, you get a breakdown of specific counts of events. This level of granularity can be powerful; for example, after a code freeze, you may want to set monitors on your sensitive repositories to ensure new commits are not getting added at a fast pace during the thaw.
Set monitors on GitHub code scanning alerts
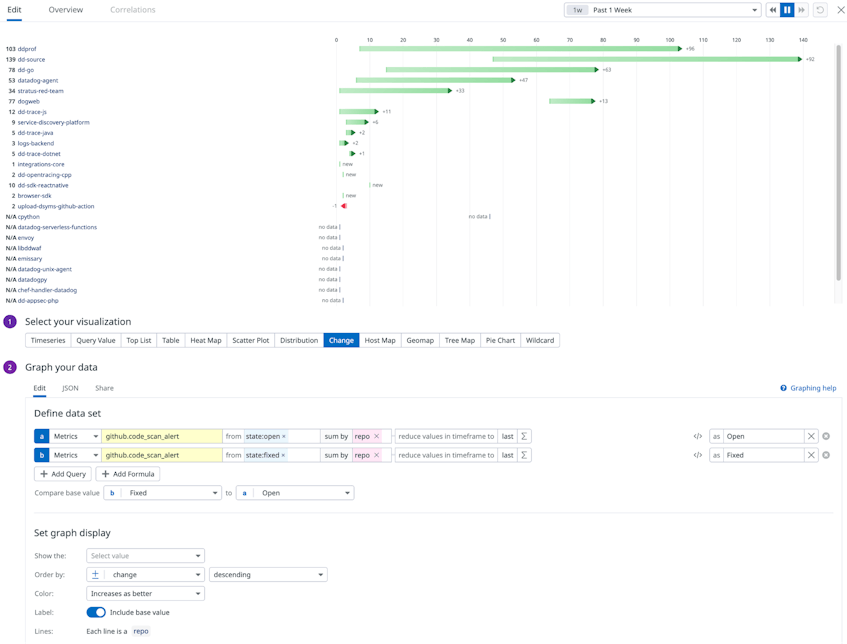
GitHub’s code scanning enables you to analyze the code in a repository to find security vulnerabilities and coding errors. Any problems identified by the analysis are shown in GitHub. With our enhanced integration, you can now collect your code scanning alerts with Datadog to more easily surface and identify code-level issues. For example, you can create a visualization that shows you how many new code vulnerabilities GitHub has detected compared with the previous week.
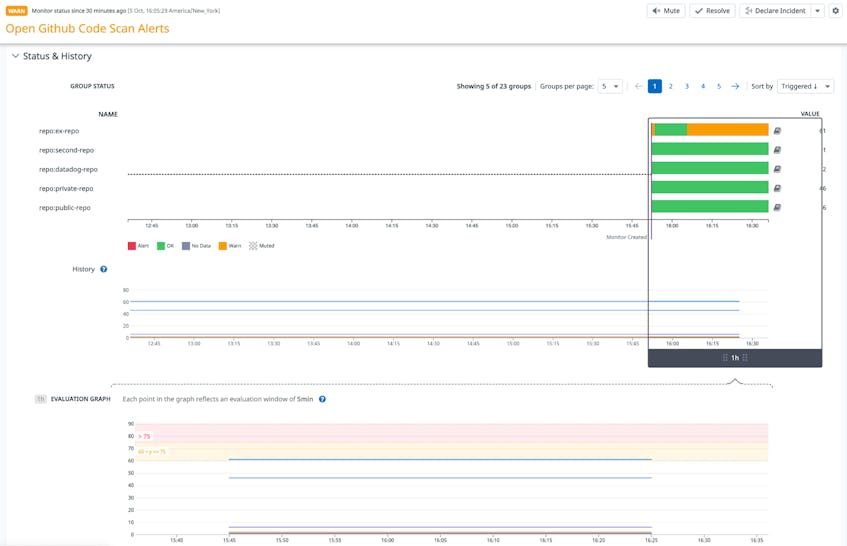
Datadog automatically tags these metrics with the relevant repository. This means you can easily set monitors on specific repositories that your team operates on to ensure all new alerts are tracked by your team. You can route alerts fired from these monitors straight to Slack or Jira so that your team can take immediate action, or you can have a ticket to track these alerts for the long term.
Get started with the new GitHub integration today
GitHub’s audit stream and event-monitoring capabilities provide key insight into platform activity across your entire GitHub organization. With Datadog’s new integration, you can aggregate all of your audit logs to get deep insight into user activity, API usage, and potential threats or vulnerabilities. And you can correlate that data with telemetry from more than 750 other technologies. If you’re already signed up with Datadog, you can connect your GitHub org today. Or, sign up for your 14-day free trial.


