
Amazon CloudFront is a content delivery network (CDN) that minimizes latency by caching your content on AWS edge locations around the world. With CloudFront real-time logging, you can understand how efficiently CloudFront is distributing your content and responding to requests. You can collect CloudFront real-time logs in Datadog—in addition to CloudFront metrics—to get deep visibility into the health and performance of your CloudFront distribution.
In this post, we’ll show you how to configure CloudFront to send real-time logs to Datadog, and how to organize, analyze, and alert on your logs.
From CloudFront to Datadog
CloudFront sends real-time logs to Amazon Kinesis, a managed streaming data service. You can configure Kinesis to forward your logs to a destination of your choice, such as Datadog. The diagram below shows the flow of your logs from CloudFront, through Kinesis—including Kinesis Data Streams and Kinesis Data Firehose—and into Datadog.

In this section, we’ll show you how to create and configure a real-time log configuration for an existing CloudFront distribution, plus a Kinesis Data Stream and a Kinesis Data Firehose delivery stream to send your logs to Datadog.
Configure CloudFront to send real-time logs
A CloudFront real-time log configuration specifies the source and destination of your logs, as well as the fields they contain. To create your log configuration, provide a name for the configuration and specify its log sampling rate—the percentage of logs generated by CloudFront that you want to send to Kinesis. Next, select the fields to include in your logs. By default, your log configuration will include all of the available CloudWatch log fields, as shown in the screenshot below. You can easily configure Datadog to parse this format automatically.
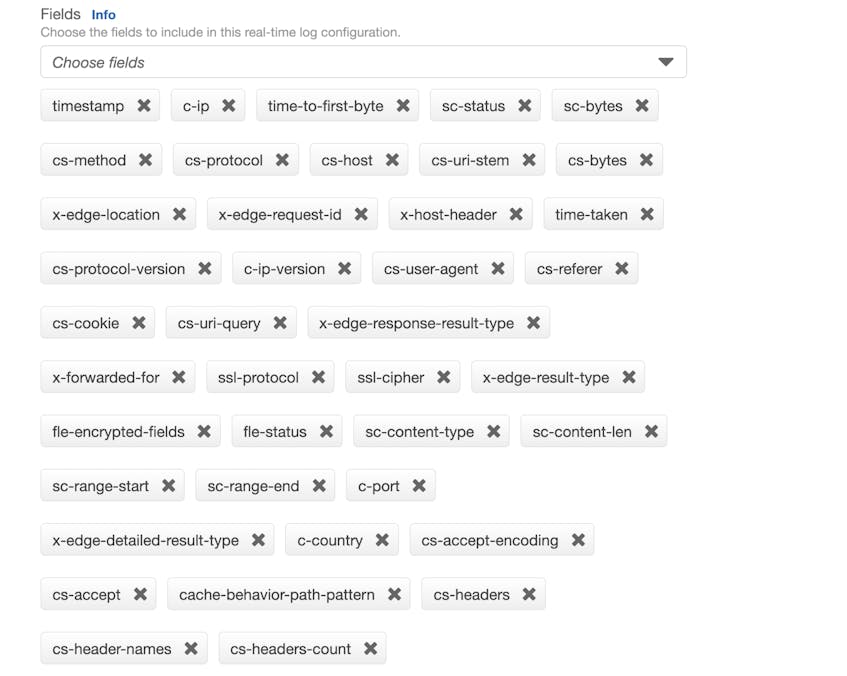
If you only want to log a subset of the available fields—for example, to reduce the amount of data in your stream—you can modify the log configuration’s Fields list and then create a custom log pipeline to parse your modified log format.
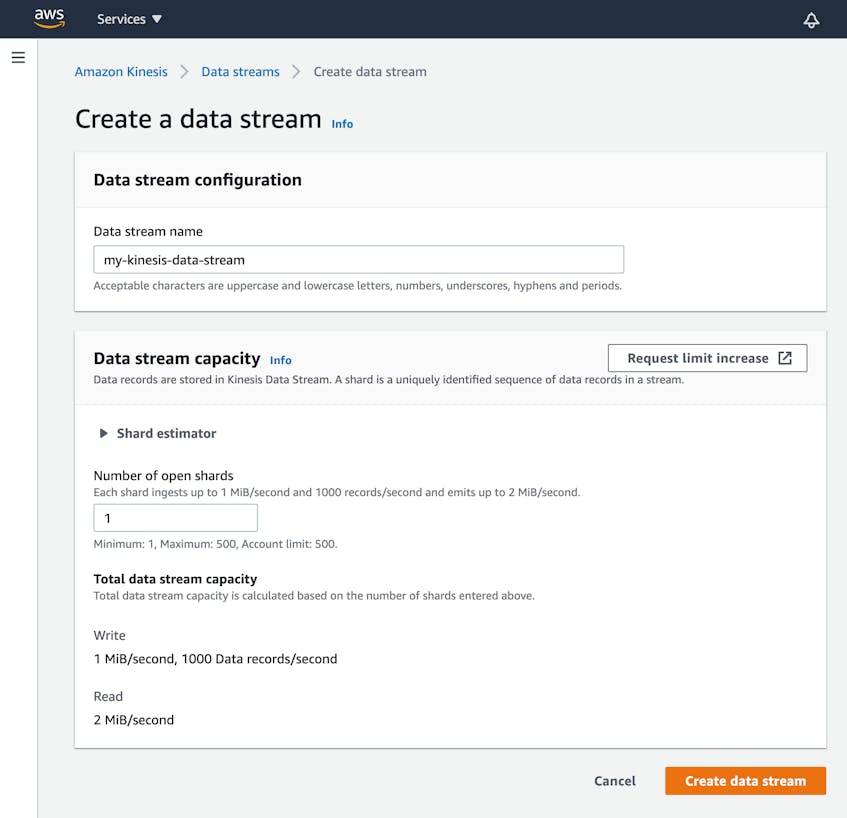
Next, designate a Kinesis Data Stream as the endpoint to which CloudFront will send your logs. If you already have a stream you want to use, enter its Amazon Resource Name (ARN) in the Endpoint field. Or to create a new stream, click the Kinesis link, then fill in the fields shown in the screenshot below.
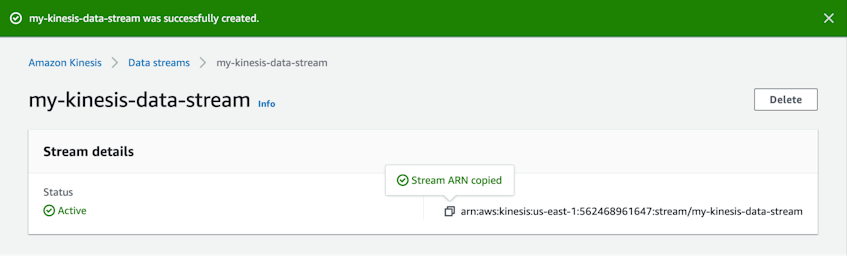
Once Kinesis has created your data stream, copy its ARN as shown here, then navigate back to the Create real-time log configuration page and paste the ARN into the Endpoint field.
To finish creating your real-time log configuration, specify the IAM role CloudFront will use to send your logs to Kinesis. Finally, select the CloudFront distribution and cache behaviors that will generate the logs, and click Create configuration.
Route logs through Kinesis Data Firehose to Datadog
Kinesis Data Firehose is a managed service that can route streaming data in near real time to AWS services, HTTP endpoints, and third-party services like Datadog. Kinesis Data Firehose makes it easy to stream AWS service logs into Datadog—including real-time logs from CloudFront.
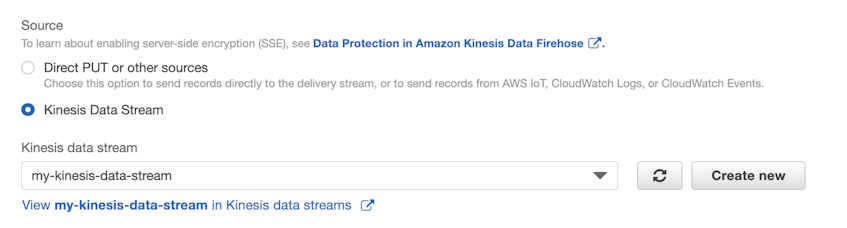
To route your logs into Datadog, create a Kinesis Data Firehose delivery stream and choose the Kinesis Data Stream you created above as the source:
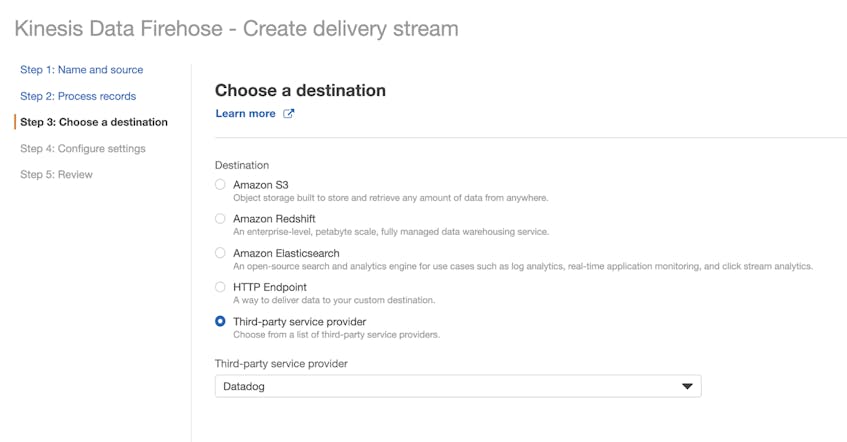
Next, specify Datadog as your delivery stream’s destination, as shown in the screenshot below.
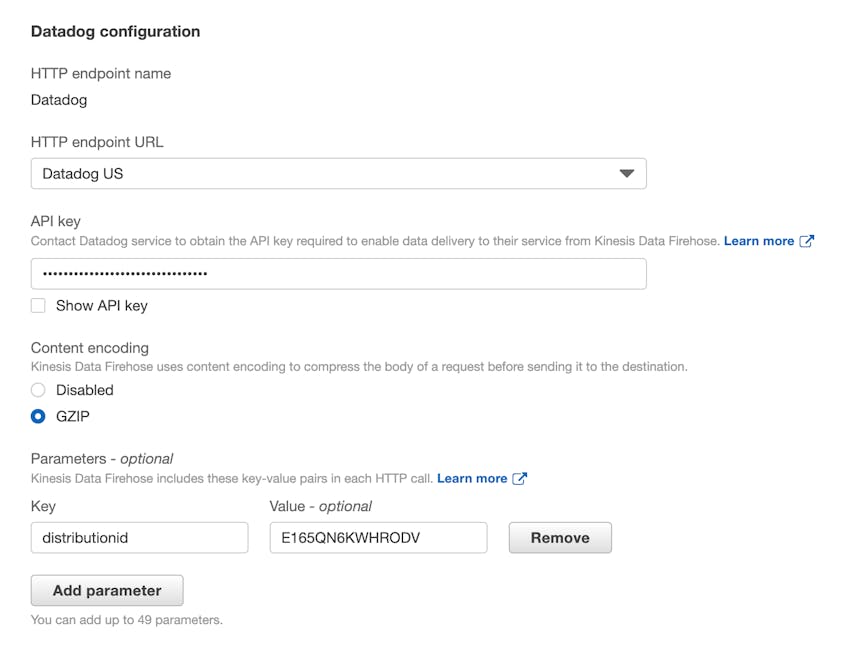
Finally, enter your Datadog API key, select the appropriate HTTP endpoint URL, and provide the required additional configuration details. See the AWS documentation to learn more about how to configure Datadog as a Kinesis Data Firehose destination.
Look to your logs
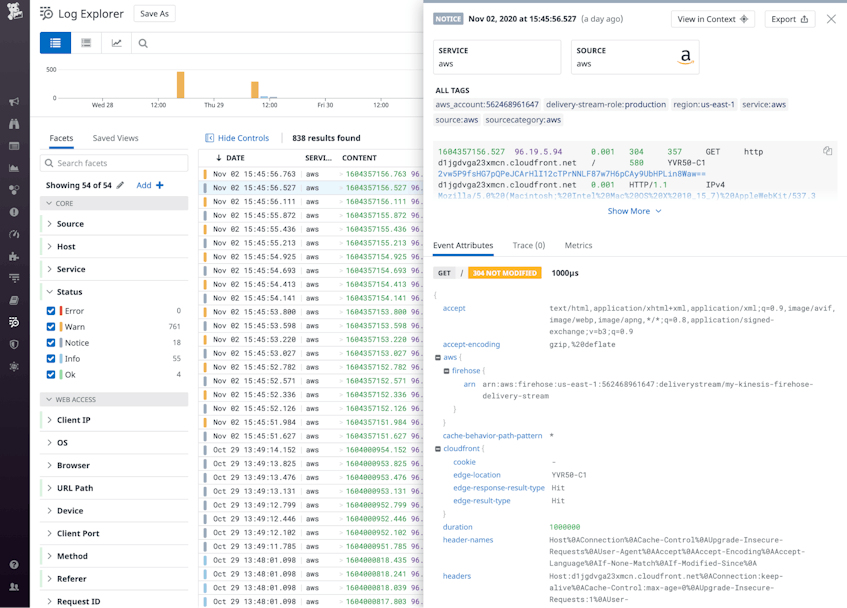
Once Datadog is ingesting your CloudFront real-time logs, you can use the Log Explorer to view, search, and filter your logs to better understand the performance of your CloudFront distribution. In this section, we’ll show you examples of CloudFront log fields you can use to investigate the source of errors and latency. But first, we’ll explain how you can use tags to make it easy to explore your CloudFront logs.
Tag your CloudFront logs
Tags give you the ability to group and filter your logs on multiple dimensions and correlate them with data from other services you’re monitoring. Datadog automatically applies AWS tags like region and aws_account to your CloudFront logs, and you can add your own tags to associate your logs with related metrics from CloudFront and other AWS services like Amazon RDS or Elastic Load Balancing.
To apply a custom tag to your CloudFront logs, create a parameter on your Kinesis Data Firehose delivery stream. In the screenshot below, we’ve added a parameter with a key of distributionid so we can isolate log data by distribution.
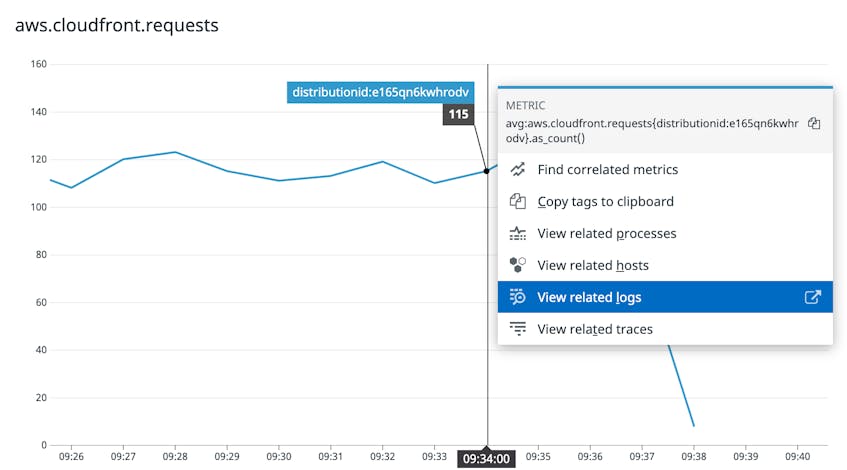
If you’ve created a Kinesis Data Firehose delivery stream for each of your CloudFront distributions, then you can use the distributionid tag to easily correlate your logs with metrics from the same distribution. The screenshot below shows a graph of a CloudFront metric and includes a link to view logs tagged with the same distributionid.
Log analytics
Now that you’re collecting and tagging your real-time CloudFront logs, you can analyze them in Datadog to monitor your distributions’ performance. You can create facets and measures based on the data in your logs to help you improve user experience by tuning parameters like cache size and time to live (TTL). For example, the x-edge-response-result-type field in your logs shows values such as Hit and Miss that describe how an edge location responded to each request. To track responses that required the edge location to refresh the object before returning it—in other words, requests for objects that have expired from the cache—you can create a facet based on x-edge-response-result-type and monitor logs that contain a RefreshHit value, as shown below.
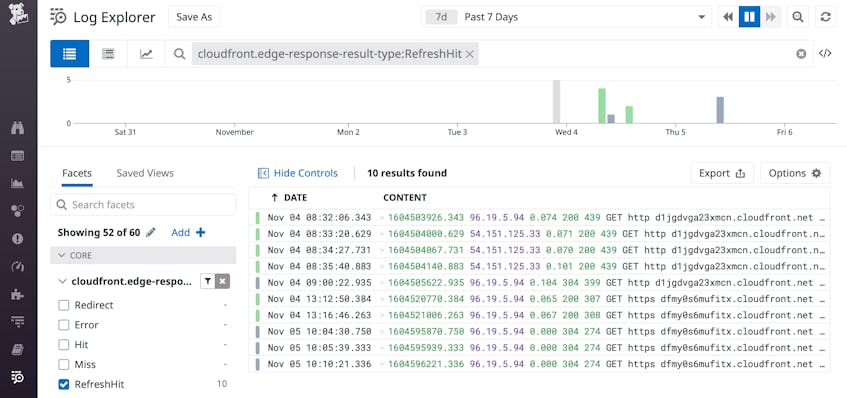
Monitoring the rate of RefreshHit values in your real-time logs can help you optimize your cache hit ratio by adjusting the TTL values of the relevant cache behaviors.
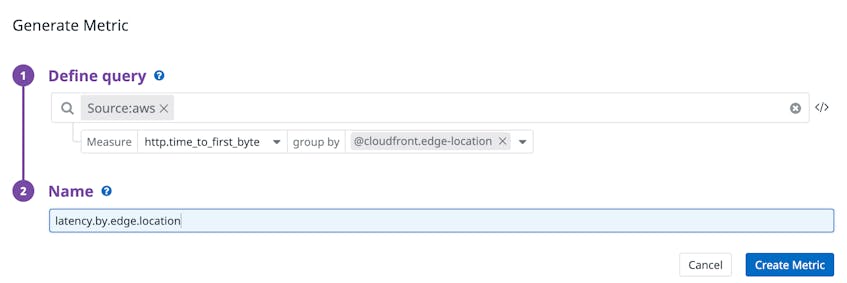
You can also create log-based metrics to monitor long-term trends in your logs. Like other metrics, log-based metrics are retained for
15 か月 at full granularity. In the screenshot below, we’ve created a log-based metric to track latency experienced by users in different geographies. To generate the metric, we queried the time-to-first-byte log field—which tells how long CloudFront took between receiving the request and beginning to respond—and grouped it by a log facet we created on the edge-location field.
We can graph this metric to see the latency values logged by each of the edge locations used by our distributions, as shown in the screenshot below.

Alerts
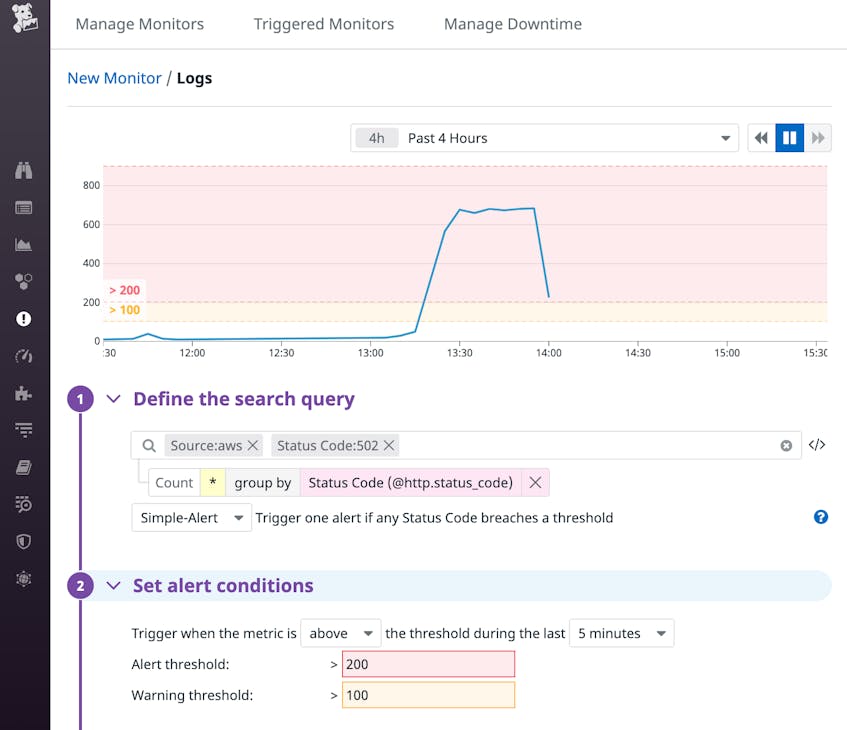
Searching and filtering your logs is a powerful tool for investigation, but you can also use log monitors to proactively notify your team any time your CloudFront logs indicate a potential problem. The screenshot below shows an example of a log monitor that watches for an increase in the rate of 502 errors, which can occur when CloudFront is unable to communicate with your distribution’s origin server.
Bring on the logs
To get the full picture of your application’s health and performance, you can monitor your CloudFront logs, your CloudFront origins—including Amazon S3, EC2, or ELB—and supporting AWS services like RDS and DynamoDB. If you’re not yet monitoring your AWS services, get started with our 1-click guide. And if you’re new to Datadog, sign up today for a free 14-day trial.
