
Your modern cloud-hosted applications rely on a number of key components—such as databases and load balancers—that are managed by the cloud provider. While these cloud resources can reduce the overhead of maintaining your own infrastructure, capturing and contextualizing monitoring data from services you don’t own can be difficult. Visibility into your cloud services is crucial for quickly pinpointing the root cause of poor application performance, whether it be due to networking issues, client-side errors in code, or failure of managed cloud services.
Datadog Network Performance Monitoring (NPM) now automatically detects and tags AWS- and GCP-managed endpoints in your network. With NPM, you can monitor network traffic to your AWS services as well as API calls made to your key GCP dependencies, providing an unprecedented view into your applications’ communication with the managed cloud services they depend on, like Amazon S3 and RDS, Google Cloud DNS, Google Cloud BigQuery, Amazon ElastiCache, and more. This makes it easier to correlate relevant telemetry from your first- and third-party services to identify the source of communication issues. In this post, we’ll highlight how to leverage cloud service autodetection in NPM to:
- Visualize your cloud architecture and pinpoint latency in communication across managed services
- Monitor cloud service health using integration metrics
- Assess the effect of poor managed database performance on your app health
Visualize the performance of cloud service dependencies
With the Network Map, you can visualize network throughput, latency, and other key metrics about the traffic between any tagged objects in your environment, from services to pods to cloud regions. With cloud service autodetection, Datadog automatically identifies and labels your endpoints using the service tag. By grouping the Network Map nodes by service, you can get a bird’s-eye view of the dependency relationships between services in your environment, including cloud-managed ones. This enables you to spot where latency and connectivity issues are concentrated and identify which client services and managed endpoints are causing—or affected by—these performance bottlenecks.
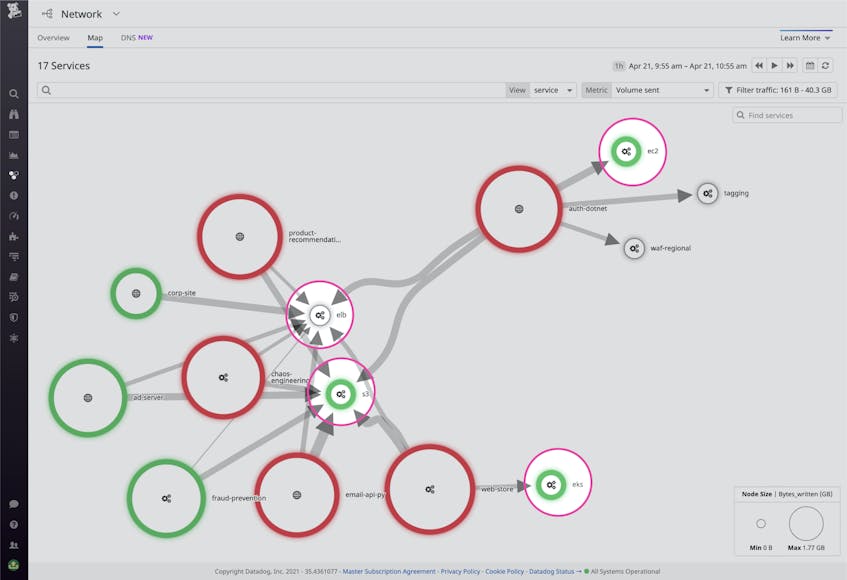
For example, let’s say you use an Elastic Load Balancer to allocate incoming requests from multiple client services across a number of backend EC2 instances. The Network Map’s visualization of your infrastructure means you can validate the health of this ELB service by inspecting the latency and retransmits for communication between it and its dependencies. This makes it easy to quickly identify whether the problem may lie with a particular client or with your ELB service. If only a single dependency is experiencing high latency in communicating with the ELB, this suggests a client-side issue could be the root cause. But if the latency is affecting a number of dependencies to your ELB service, an outage or misconfiguration of the ELB service as a whole may be the cause.
Next we’ll look at how you can pivot to the Network Page for more context to help isolate the problem.
Distinguish between client-side and provider-side issues
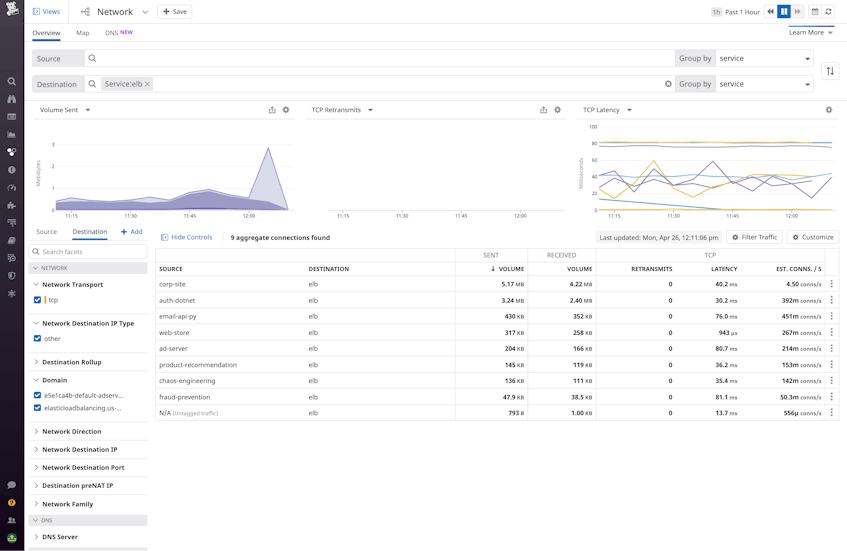
The Network Page allows you to monitor network metrics between sources and destinations that are grouped by key tags (e.g., service, pod, or availability zone). Thanks to cloud service autodetection, you can now filter that data using AWS service tags. This makes it easy to aggregate network traffic data going to and from your AWS service dependencies and investigate performance issues involving third-party services.
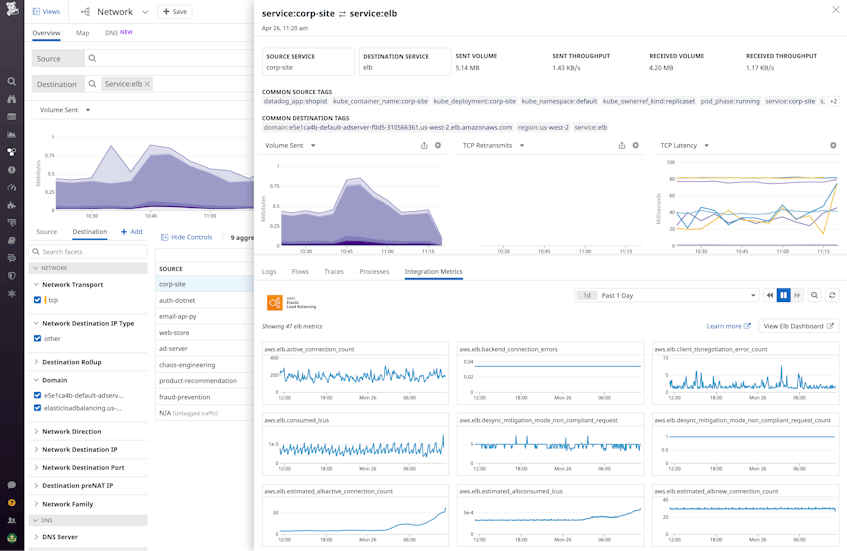
Along with relevant logs, traces, and processes, Datadog NPM now automatically includes AWS integration metrics, helping you correlate the health and performance of your cloud service with network data and other telemetry.
For example, once you’ve identified a problem on the Network Map with communication between client services and your load balancers, you can immediately pivot to the Network Page to view key ELB service metrics. Spikes in average latency or 5xx errors can indicate that the issue is with the service itself rather than your internal applications, which can be confirmed by seeing communication problems from multiple client apps to the ELB service.
You can also sort the flow table on the Network Page by request volume, retransmits, or round trip time to help you identify which services communicate with the ELB service most, and therefore may be negatively affected by its poor performance.
Pinpoint when S3 and RDS errors affect application health
Managed databases are an integral component of distributed applications—and a common point of failure. When a database fails or experiences poor performance, it’s critical to know which particular node is the root cause in order to properly understand which internal services are affected and fix the problem. With cloud service autodetection, Datadog identifies the AWS database services you are using and also can break down your RDS and S3 into specific databases and buckets to help you identify if one of these components is at the root of the issue.
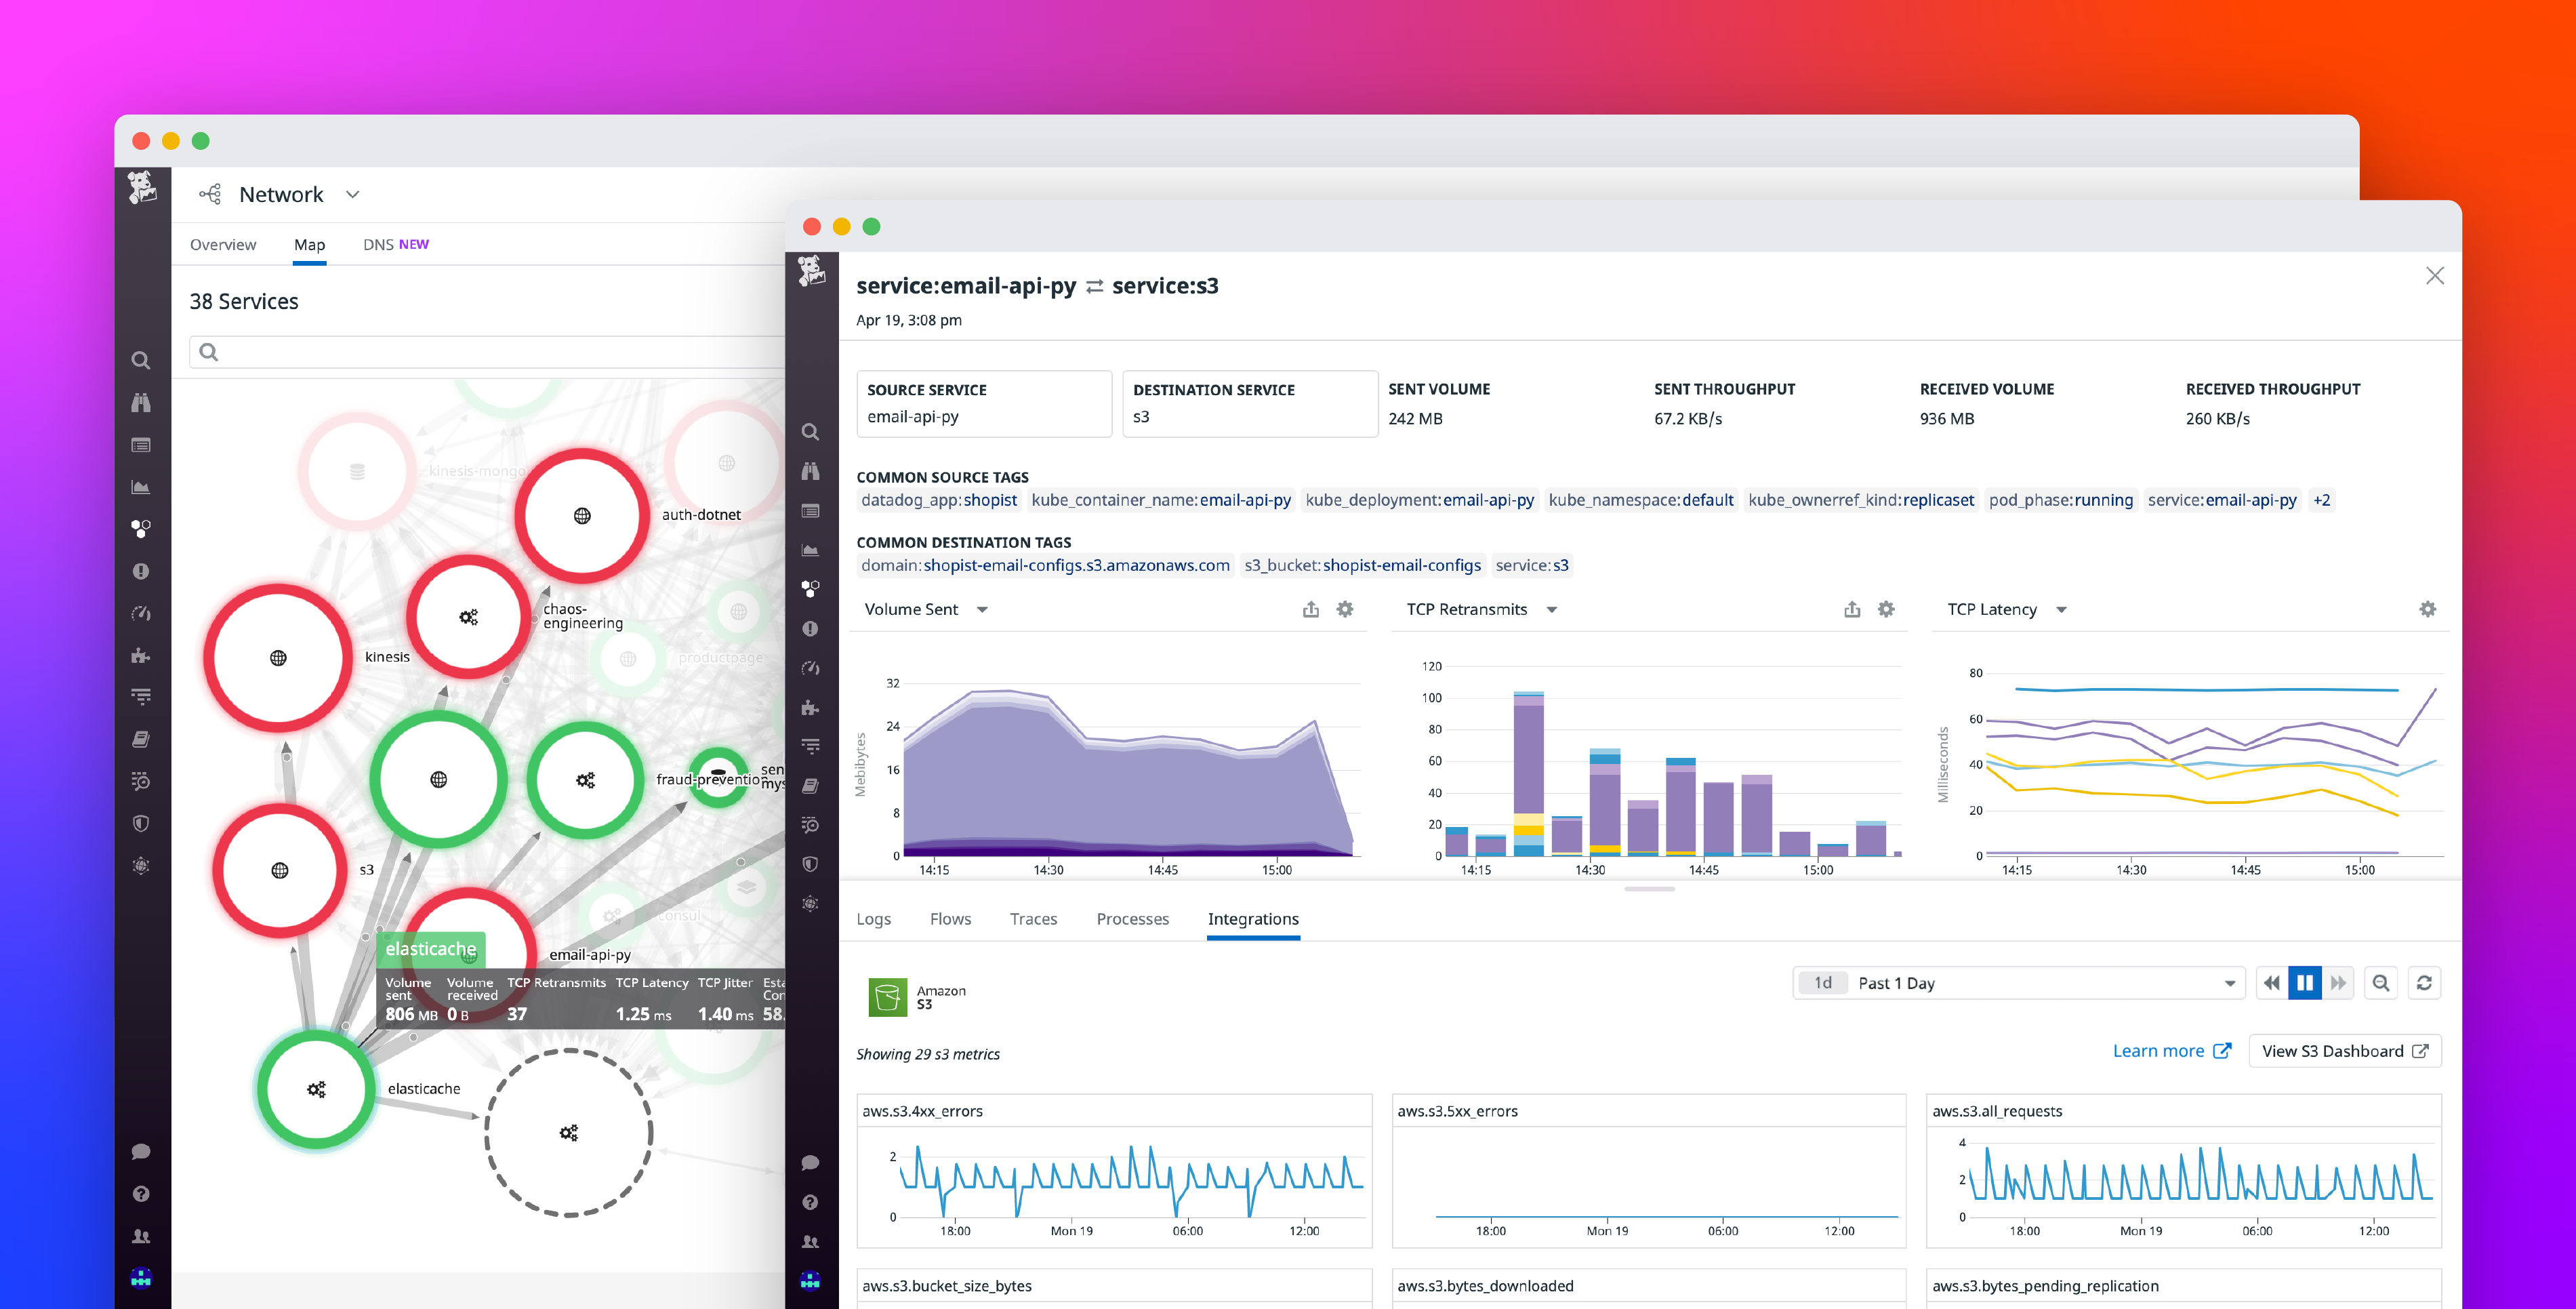
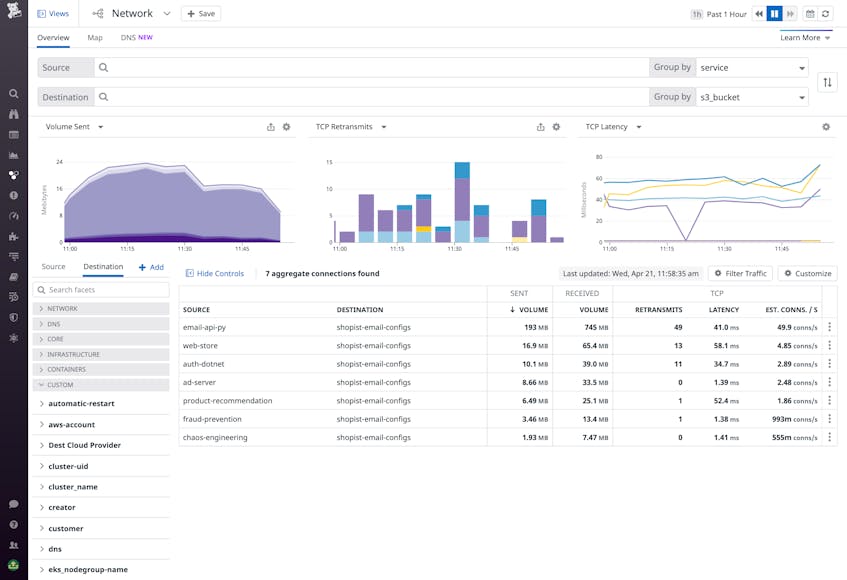
Let’s say you’ve identified a spike in TCP latency between one of your applications and Amazon S3. Thanks to NPM’s automated tagging of S3 buckets, you can use the Network Page to break down this latency by S3 bucket to assess the scope of the problem. Viewing the network metrics for each bucket’s flows, you can determine whether the latency is scoped to one bucket, a subset of buckets, or all the buckets. Accomplishing this is as simple as selecting s3_bucket from the “Group by” dropdown in your query.
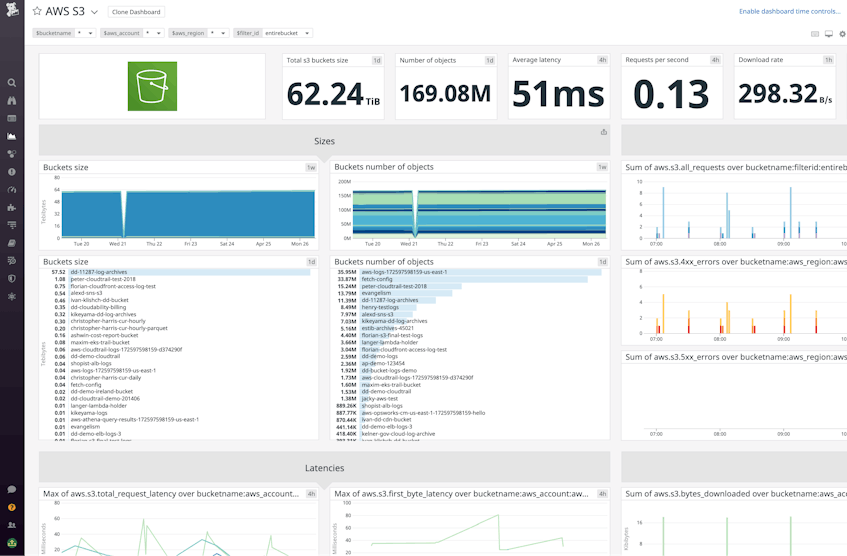
If you’re seeing high latency and retransmits to multiple buckets, for example, you can pivot to the sidepanel to investigate HTTP errors and request latency via the S3 integration metrics. This gives a high level overview of your S3 service’s health to help you determine whether the issue is with S3 or with your own service(s). To investigate further, you can use our out-of-the-box S3 dashboard to get health and performance metrics scoped to a specific bucket.
Monitor cloud dependencies from every angle
With cloud service autodetection in Datadog NPM, you get unprecedented visibility into the communication between your third-party cloud services and your native applications. NPM provides key insights into the health and performance of all these endpoints in one place. This gives you even more context around problems so that you can more easily determine whether the root cause of an issue lies with a third-party dependency, whether on the cloud provider side or with your internal applications.
This feature is currently available for all Datadog customers. If you’re not already using NPM, see our documentation for the install steps—and make sure to set up DNS monitoring as well. Or if you’re brand new to Datadog, sign up for a free trial to get started.
