David M. Lentz
When you migrate workloads from on-premise infrastructure into a public cloud, you can improve the performance, reliability, and security of your application, and you might also lower your costs. To execute a successful cloud migration, you need a detailed inventory of your current deployments, visibility into your application’s performance as you shift traffic to the cloud, and confirmation that—once you’ve landed in the cloud—you’re still providing a high-quality user experience.
In this post, we’ll explore best practices for monitoring your cloud migration and show you how Datadog can give you visibility throughout every phase. We’ll show you how to:
- Plan what cloud resources you need
- Build visibility into your cloud environment
- Monitor your newly migrated application
Take inventory to plan your migration
In order to plan a cloud environment that’s capable of supporting your applications, you’ll need a deep understanding of your current environment. In this section, we’ll show you how Datadog can help you plan your migration by understanding the topology and resource requirements of your application in its current state.
Map your application and infrastructure
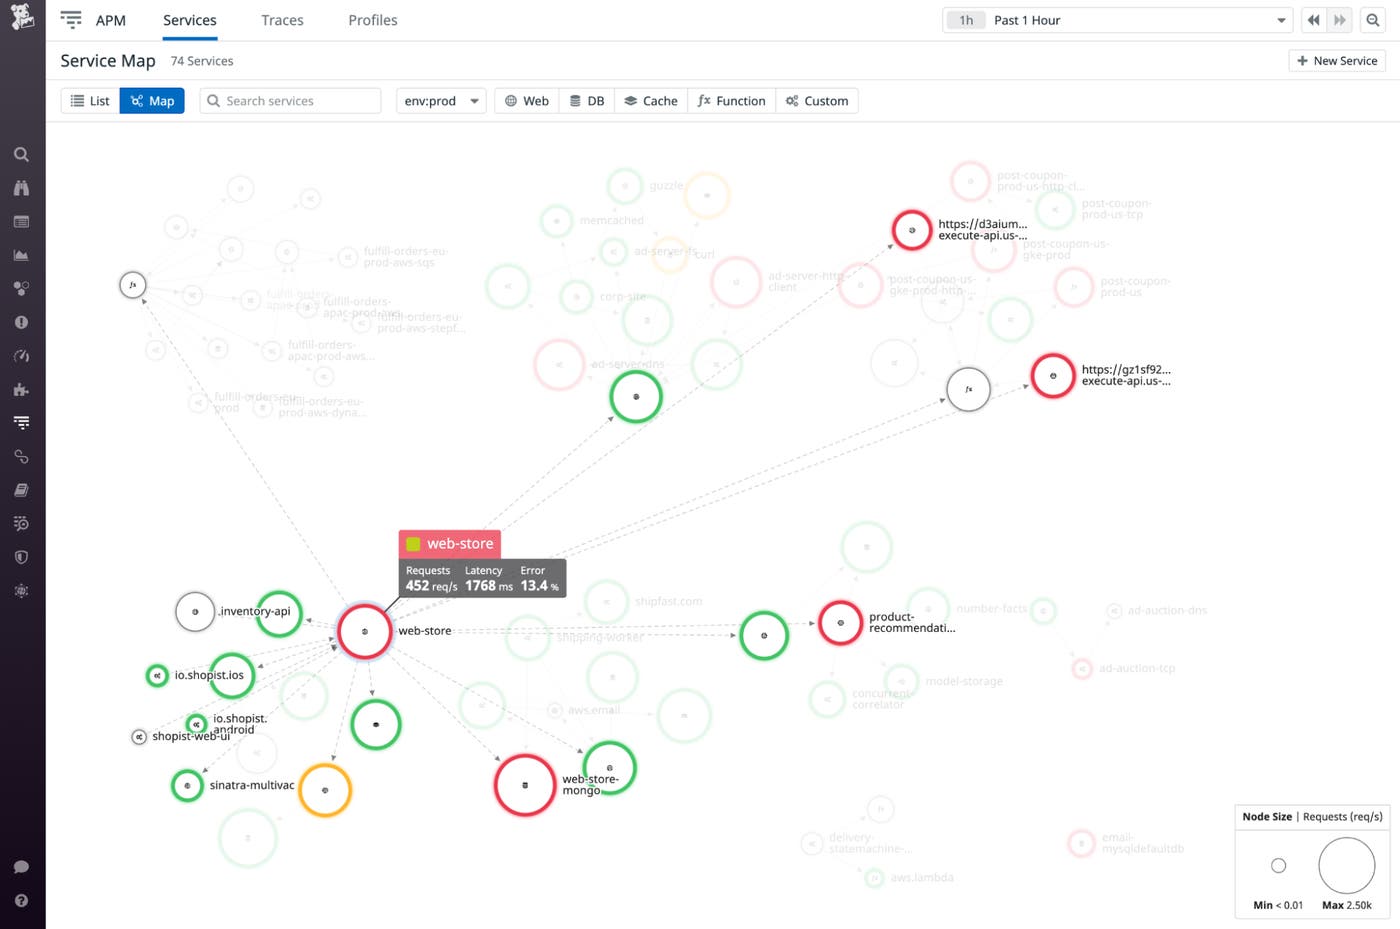
The Service Map helps you gain a complete understanding of your services, their dependencies, and the rate of requests between them. In the screenshot below, the Service Map highlights the web-store service and shows its request, latency, and error rates as well as its request traffic to and from other services. From here, you can click any service to drill down to view request data gathered by Application Performance Monitoring (APM) and distributed tracing.
The host map visualizes your current environment and uses colors to represent the real-time value of a metric your hosts are reporting. You can use metadata from your hosts to aggregate, explore, and better understand your infrastructure. The screenshot below shows hosts grouped by environment and color coded to show hosts with high CPU usage in red and low CPU usage in green.
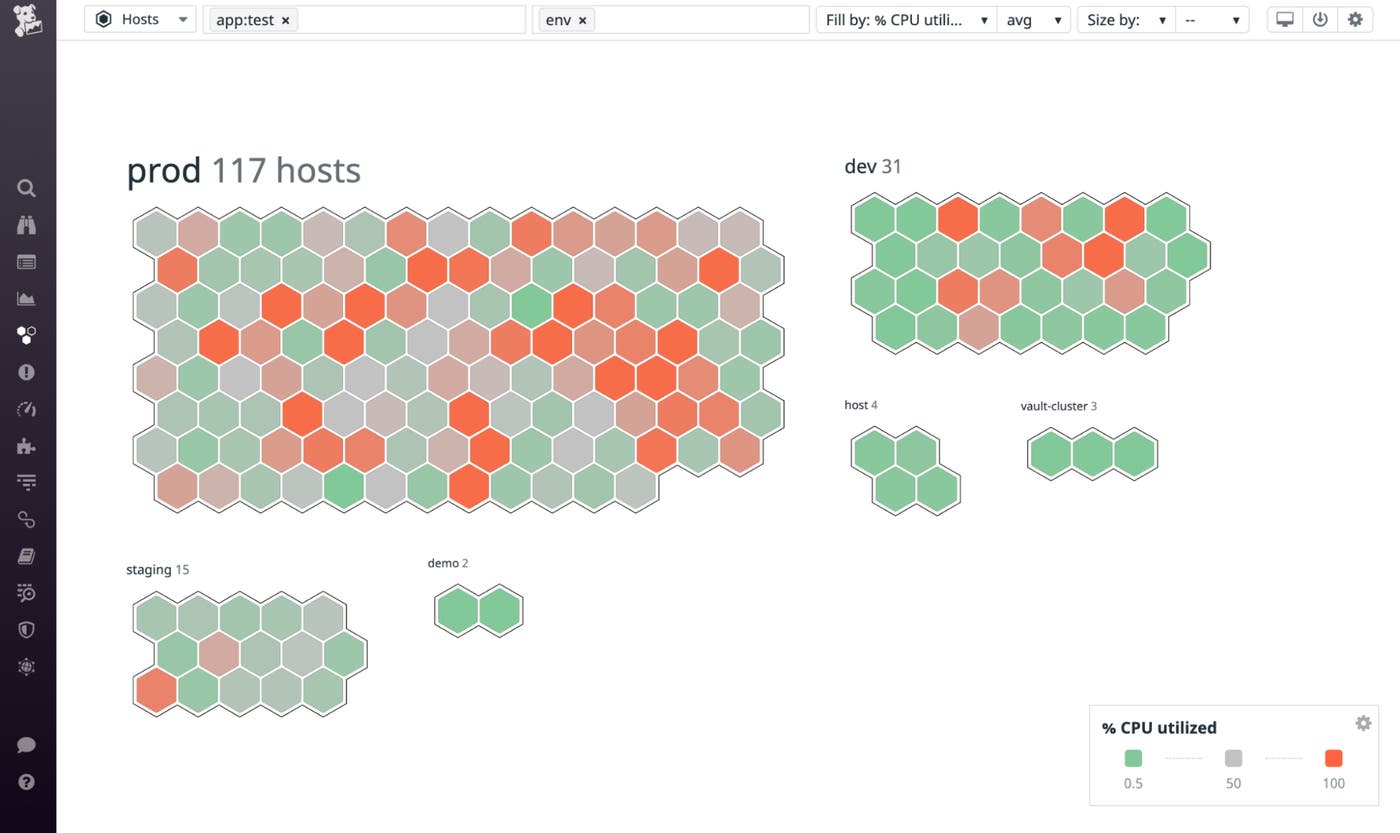
The host map can reveal resource-utilization hotspots that help you decide the number, size, and type of the VMs you launch in the cloud. You can click any node on the map to see a dashboard that shows you detailed resource usage patterns. This data can help you understand your infrastructure needs and right-size your new cloud infrastructure. For example, if the host map shows you that a specific application is running on a large number of underutilized instances, you may be able to save money by migrating it to fewer cloud instances. You could also choose a less expensive instance type, such as one that features fewer CPU cores or provides general-purpose capabilities rather than a compute-optimized instance.
Analyze your network
To ensure that your new cloud environment can accommodate the volume and type of network traffic your application generates, you’ll need to take a close look at the behavior of your current network. Datadog Cloud Network Monitoring (CNM) gives you visibility into the traffic within and between your on-premise data centers, so you can design the VPCs, subnets, and other network constructs in your cloud environment to support your application’s traffic.
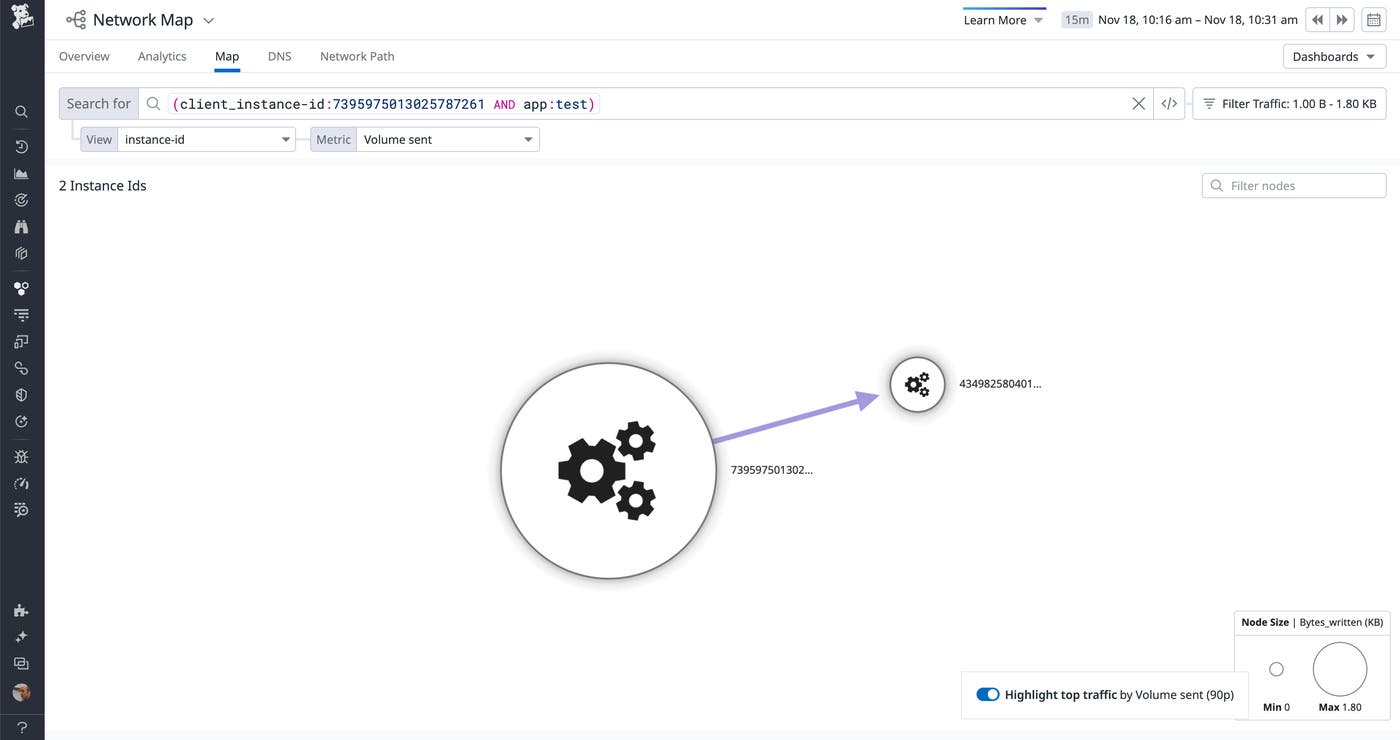
The Network Map visualizes the traffic between the hosts, pods, containers, and other components of your environment. This can help you spot bottlenecks as you migrate—and provision appropriate cloud network resources to resolve them. The screenshot below shows a Network Map of a testing-related application that generates a small amount of traffic. An application like this could be a preferred, lower-risk candidate for migrating first, ahead of higher-traffic applications.
In the cloud, your network can dynamically scale to include new hosts, subnets, and VPCs. As these cloud resources come and go, you can continue to rely on the Network Map and Network Overview to track network flows within your cloud environment. You can sort your CNM data by geography to identify traffic between regions or availability zones. Using this information, you may be able to revise your network traffic flows so you can minimize latency and transit costs in the cloud.
Understand your storage
As you plan to provide storage for your application in the cloud (e.g., managed databases, file storage, and object storage), you should have a detailed inventory of the types and amounts of storage required. Our data store integrations provide out-of-the-box dashboards that visualize usage metrics like:
postgresql.total_size: the total disk space used by a PostgreSQL table, in bytesibm_db2.tablespace.size: the total disk space used by an IBM DB2 table, in bytessap_hana.disk.used: the total disk space used by SAP HANA to persist data, in bytes
And to estimate your future storage costs, you can apply a forecast function when you graph these metrics to see where your data storage needs are headed.
Prepare, create, and test your new environment
Once you’ve identified the resources to include in your cloud environment, you should make plans to ensure that you’ll have the visibility you need. In this section, we’ll describe steps you can take to leverage monitoring throughout the process of creating your cloud environment. We’ll look at three phases of moving an application to the cloud: preparation, setup, and validation.
Prepare your SLOs and dashboards
You should expect the cloud-based version of your application to be at least as reliable as the on-premise version, so you can continue to use the same service level objectives (SLOs)—performance and reliability targets for the services you operate—across the old and new versions. But you may need to adjust what you measure—your service level indicators (SLIs)—to include performance metrics from your newly migrated workloads.
For example, let’s say you’re planning to move a Redis cache to the managed version that AWS provides—Amazon ElastiCache for Redis—and you’ve created an SLO to ensure that your cache hit rate stays above 90 percent over each seven-day period. You may need to operate that cache temporarily as a hybrid while you transition to the cloud. During this hybrid phase, your SLOs should be based on a combination of SLIs from both the legacy infrastructure (on-premise Redis) and the target infrastructure (ElastiCache). In this case, you could update your SLO to track metrics that reflect cache hits and misses from both services. As you phase out your legacy infrastructure, the legacy Redis deployment will eventually stop reporting any data, and you can remove the redis.stats.keyspace_* metrics from your SLIs.
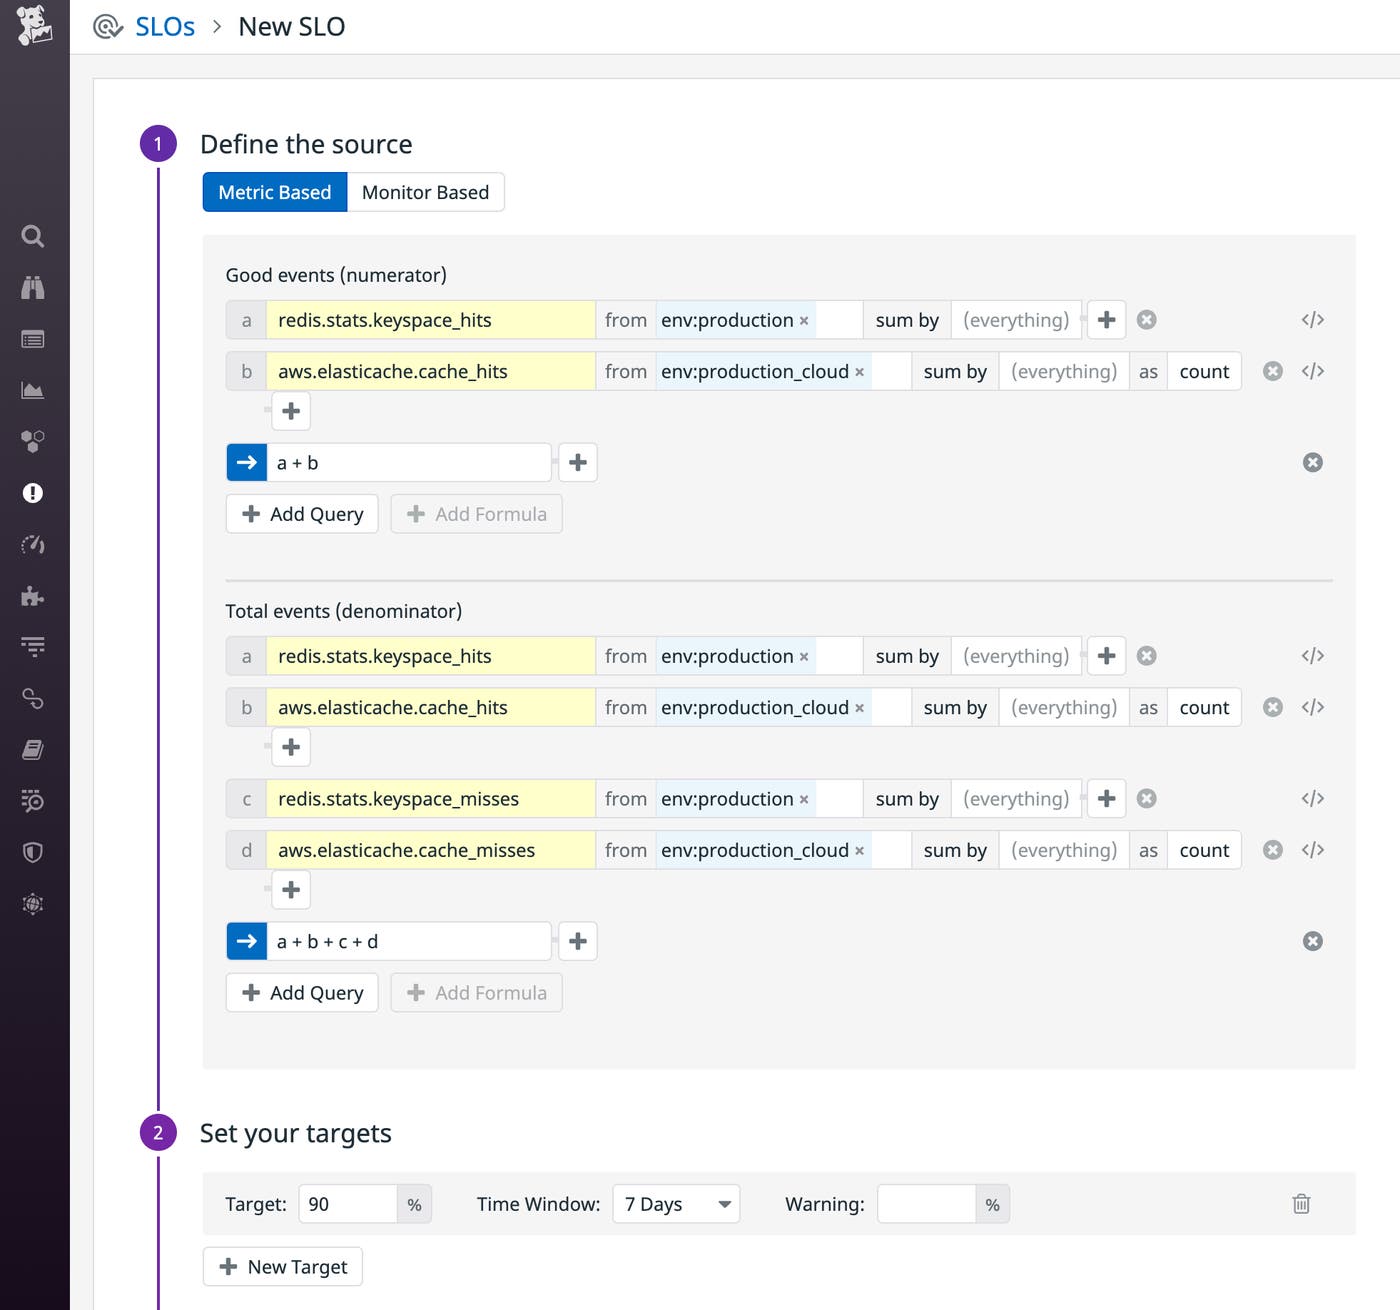
To ensure that you have visibility into your cloud infrastructure from day one, you can leverage the dashboards and alerts you already use to track the health of your application. Export any of your dashboards or alerts to JSON and edit the file to revise the metric names to align with your cloud services. Then import the modified JSON to begin monitoring your application in the cloud.
Set up a cloud environment with monitoring built in
When you launch your cloud environment, you can use your cloud provider’s resource management service (e.g., AWS CloudFormation) to automatically enable the integrations that will help you track the performance of your cloud services and infrastructure. For example, you can create a CloudFormation template that defines the necessary AWS resources and also enables the Datadog AWS integration that allows you to monitor them. You can even automatically deploy Datadog resources—such as dashboards, monitors, and SLOs—as part of your migration to the cloud. This way, you can have monitoring in place before you even begin shifting traffic to your new cloud infrastructure.
Resource management tools also make it easy to apply tags to the infrastructure and services you launch in your cloud environment. For example, you could apply an env:production_cloud tag that allows you to monitor the new version of your application separately from the legacy version. You can add a tag like this automatically by specifying it in the templates or commands you use in Azure Resource Manager, Google Cloud Platform, and AWS CloudFormation.
Validate, test, and protect your cloud architecture
When you migrate your application to the cloud, you could be subject to data-protection regulations such as HIPAA, PCI, and GDPR. Datadog Cloud Security Misconfigurations helps you track the compliance posture of your cloud environment to ensure that your application meets the applicable regulations. Cloud Security Misconfigurations provides out-of-the-box rules that are automatically enabled to continuously evaluate your cloud environment against compliance standards and industry benchmarks. For example, if you’re migrating to Azure Kubernetes Service, Datadog provides a built-in rule to help you confirm that RBAC is enabled at all times.
As you shift traffic to your cloud environment, Datadog Cloud SIEM can help you spot security threats by automatically analyzing application and infrastructure logs in real time. Cloud SIEM provides threat detection rules so you can get started quickly. You can also create custom rules to watch for specific security concerns.
Once you’ve created your cloud environment and deployed your application there, you can use Synthetic Monitoring to automatically test the availability of your API endpoints and key user workflows within your application. It can simulate user journeys—even ones that include multi-factor authentication—and execute simple or multistep API tests to help you proactively identify issues before your users do.
Once you start running Synthetic tests on your cloud environment, that traffic will appear in the Service Map. You can compare this to the Service Map of your legacy environment to check for any missing or unexpected request paths in your newly migrated workloads.
Cut over and watch your cloud migration metrics
As you shift traffic to the cloud, you can use Datadog to verify that your application’s performance and end user experience remain optimal. In this section, we’ll describe how to use SLOs, dashboards, RUM, and APM to monitor your new cloud environment while you complete your migration.
Track SLOs and migration progress on dashboards
To ensure that your migration is not affecting the performance of your application, you can continue to rely on the SLOs you’ve already created. You can share SLO information by displaying SLO widgets and other curated monitoring data on your dashboards. These dashboards enable you to easily share a real-time status report of your migration-in-progress—both internally and with stakeholders outside of your organization.
Datadog also provides out-of-the-box dashboards for cloud services like Amazon ECS, Google Cloud Functions, and Azure SQL Database to give you real-time information about the health and performance of the services that run your application. You can expect some metrics to rise steadily as you send more traffic to the cloud—for example, the rate of requests and the size of your data stores. And you can watch to ensure that other metrics—such as latency and error rates—hold steady or even decrease as the cloud version of your application begins to outperform the legacy version. To be fully prepared, of course, you should create alerts to notify you if those metrics increase unexpectedly.
Monitor end-to-end with RUM and APM
Real User Monitoring (RUM) gives you visibility into the experience of your users by measuring their interactions with your application. For example, the view.first_input_delay metric tracks how long your users are waiting for the app to react to their first action on a page, and view.largest_contentful_paint measures how long it takes before the largest object in the DOM is rendered. RUM also shows you data on the rate of errors and crashes in your mobile apps.
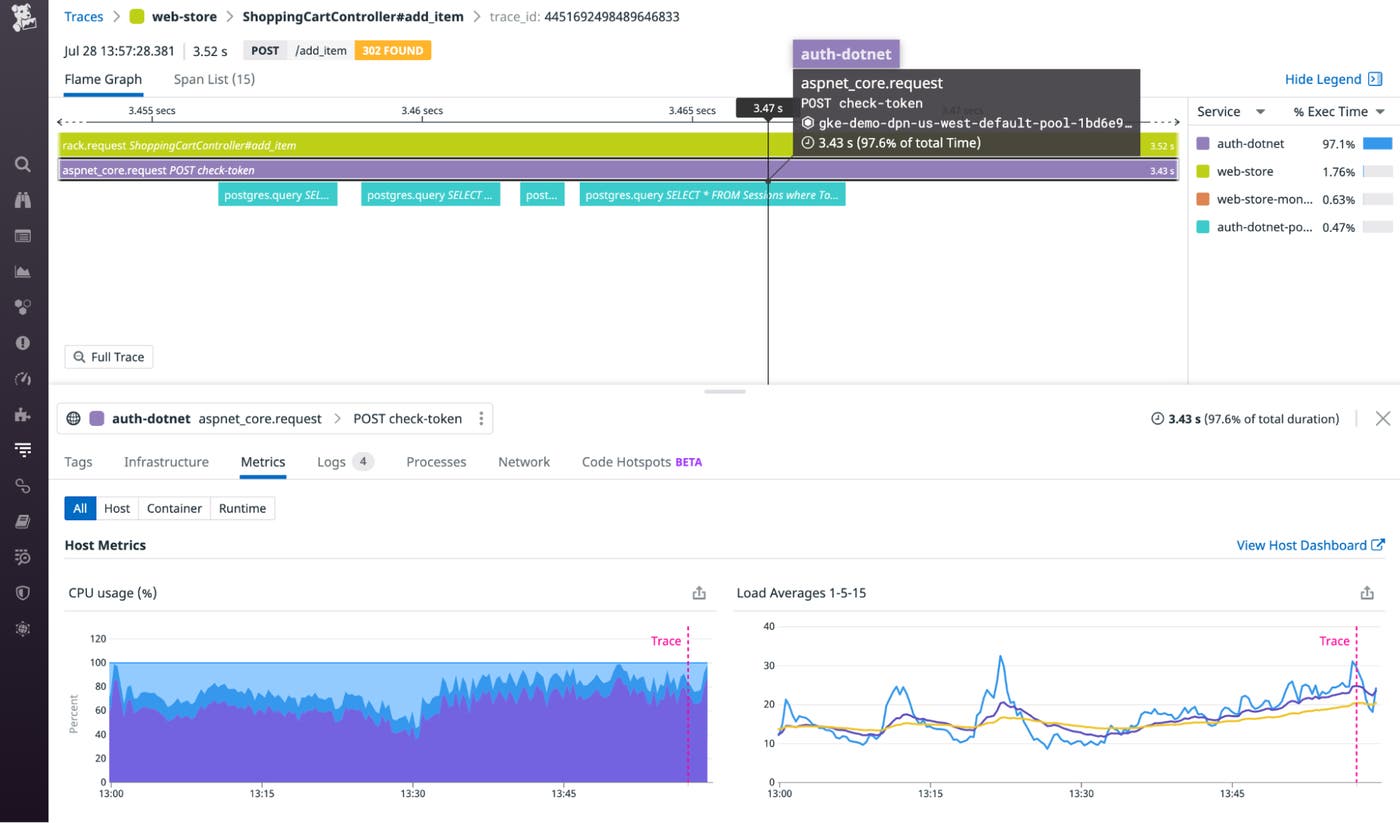
RUM collects your application’s frontend data—metrics, events, and browser information—and links automatically with Datadog APM to provide end-to-end visibility. If RUM metrics and error rates reveal that your shift to the cloud has caused crashes or introduced latency, you can use APM to pinpoint the source of the problem. Flame graphs visualize the sequence of service calls your application executes to fulfill each request, making it easy to spot services that are returning errors or adding latency.
APM can also help you understand whether the cloud-based version of your application is resource-constrained—for example, running on VMs that are too small or serverless functions that are underprovisioned. If a flame graph reveals a bottleneck in a request, you can click the span that represents the slow service call to see resource utilization metrics from the relevant host. In the screenshot below, the check-token call took 3.43 seconds. The Metrics tab below the flame graph shows high CPU usage on the host that received the request, indicating that the slow response could be due to insufficient resources.
Finalizing
Before you call your migration complete, you should confirm that all traffic has shifted and that it’s safe to decommission your legacy infrastructure. The screenshot below shows an example of a graph that you can create to verify the progress of your traffic shift. This area graph shows that the combined volume of requests to our legacy and cloud infrastructure has remained consistent throughout the migration. It also indicates that the new cloud environment (represented by the darker area on the bottom and tagged env:production_cloud) has been servicing an increasing share of the traffic, while the on-premise environment’s share (the lighter area on top) has decreased.

You should also confirm that all sessions have been drained from on-premise servers, and that message queues (e.g., ActiveMQ or RabbitMQ) and data streams (e.g., Kafka or Apache Flink) no longer hold any records.
When you’ve completed your migration, you can continue to use RUM and APM—along with your SLOs, dashboards, and alerts—to give you ongoing visibility as you operate your applications in the cloud. And as the new version of your application establishes traffic patterns in the cloud, you can take advantage of features like Watchdog and anomaly detection to help you spot and troubleshoot anomalies in your application’s performance.
Migrate and monitor
By building monitoring into your cloud migration process, you’ll have the visibility you need to confirm a successful launch and take advantage of the increased performance and reliability of the cloud. Datadog provides integrations with more than 1,000 technologies to ensure that you can always monitor all the layers of your application. If you’re not yet using Datadog, you can start today with a 14-day free trial.

