David Lentz
Adding automated testing to your CI/CD pipelines can help you ensure that you deploy changes safely. But as you continue to shift left, the number and complexity of tests are likely to increase, making them slower to run and harder to troubleshoot. Datadog CI Visibility can help you track the performance of your CI/CD pipelines and tests—and now you can also use Real User Monitoring (RUM) to monitor end-to-end (E2E) Cypress tests.
In this post, we’ll show you how CI Visibility and RUM work together to help you:
- Investigate flaky and failing tests by homing in on failing steps
- See why your Cypress tests are slow
- Troubleshoot performance gaps in your Cypress end-to-end tests from within RUM
Get deeper visibility into CI tests with RUM
Test execution can slow down as your test suites grow in size and complexity. End-to-end tests in particular can become increasingly flaky or slow as your CI testing coverage increases. CI Visibility helps you address these issues so you can improve the quality and performance of your tests. The Default Branches view of CI Visibility helps you monitor the performance of tests within the default branch of each test service. You can see the wall time (execution duration) of each test service, the most recent test result, and the count of flaky tests—ones that pass and fail sporadically given the same commit.
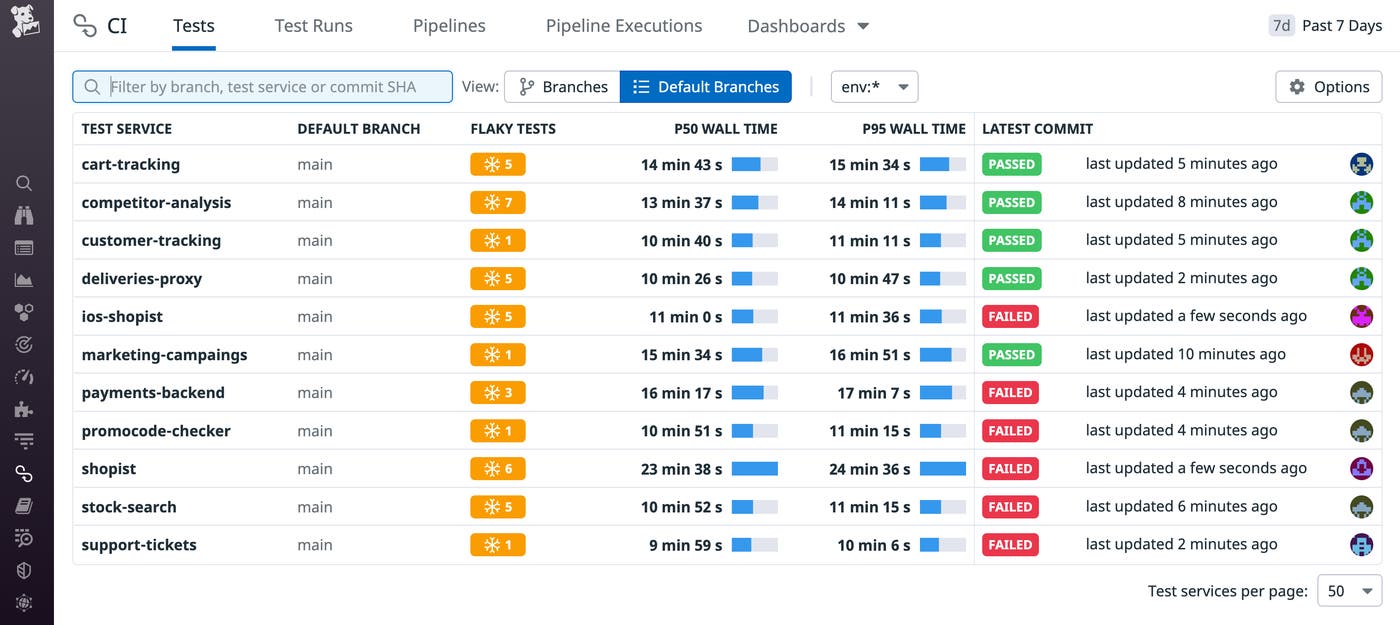
From this high-level view, you can drill down into individual test runs and use RUM to troubleshoot tests that are flaky or slow.
Troubleshoot flaky and failing tests
Flaky tests can slow down your build time, reduce your application’s reliability, and even affect the morale of your team. If it’s not easy for developers to understand why a test has failed, or if they experience noise from frequent false positives, they might begin to ignore test results or give up on testing.
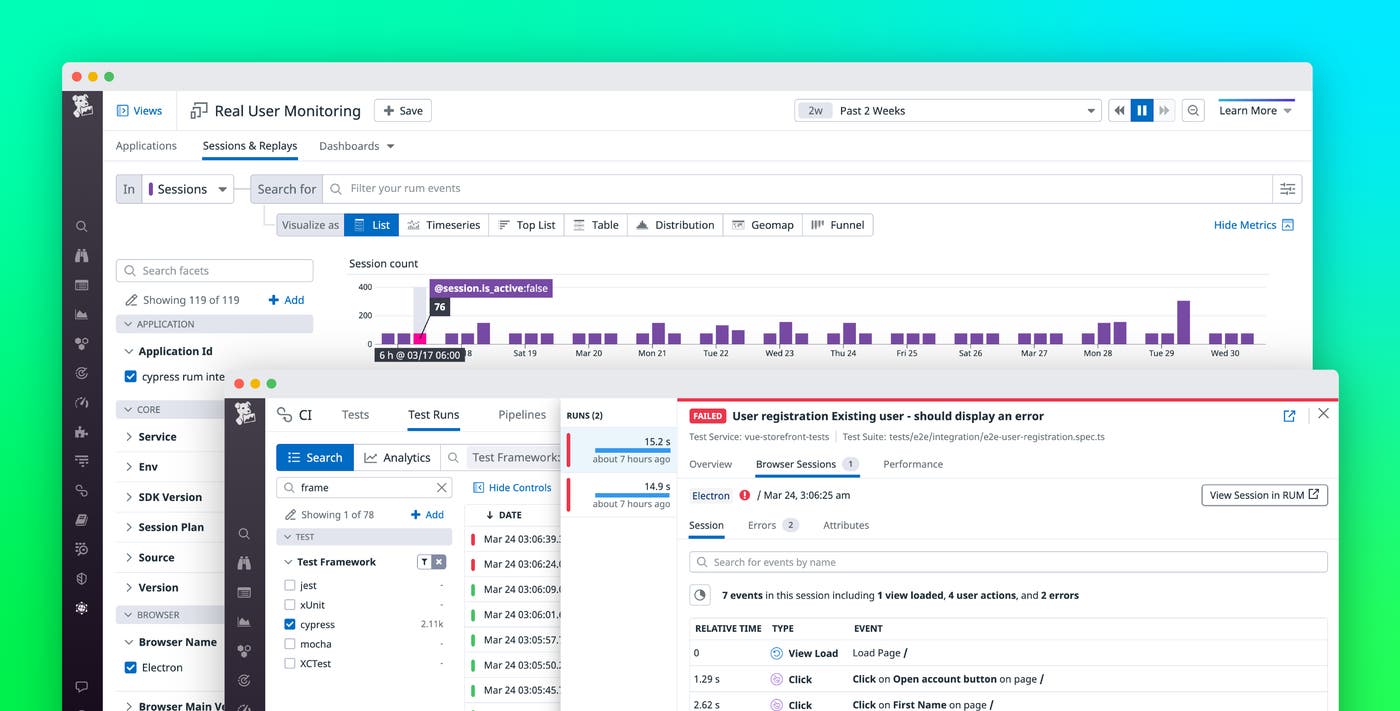
In the CI Visibility Tests view, if any of your Cypress tests appear in the New Flaky Tests table, you can click the test name to see its last failed run. The Browser Sessions tab shows you a list of events RUM has collected from that test run—for example, which views the test accessed and what actions it executed.
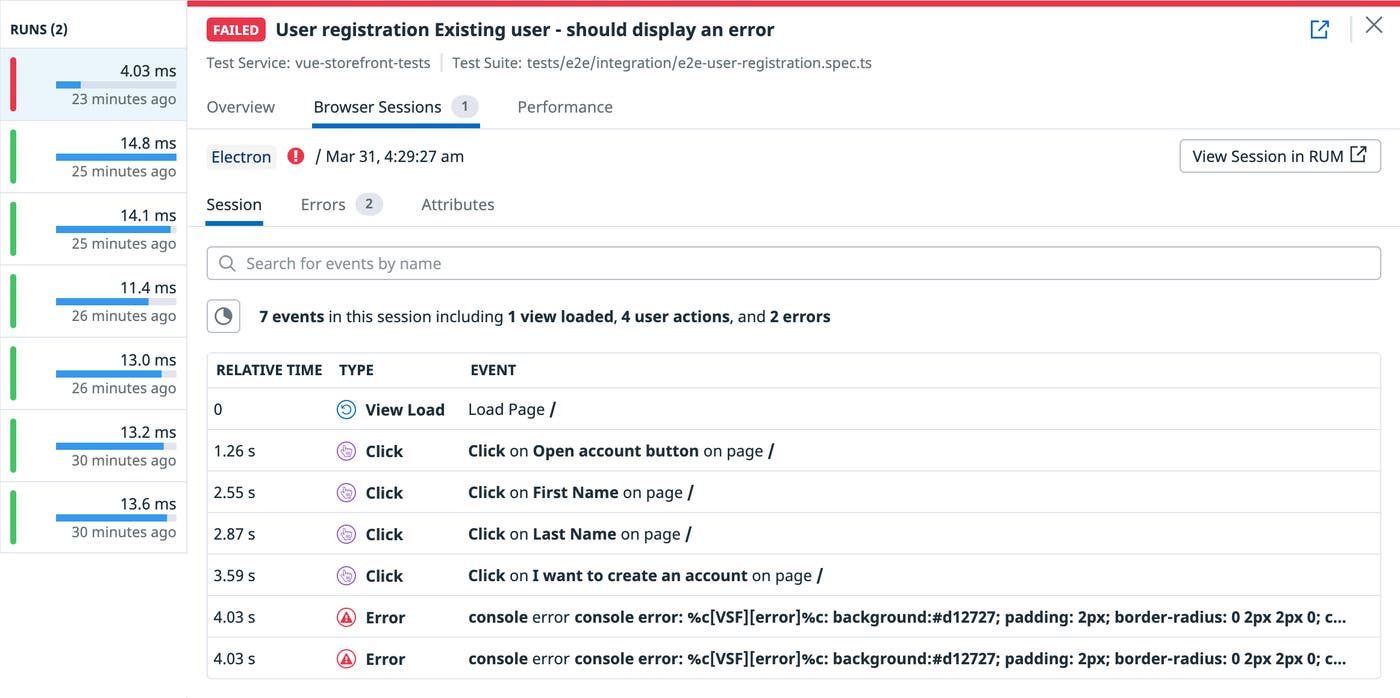
You can click on any event to pivot to RUM and dig deeper to find out why the test is flaky. The RUM waterfall view visualizes the sequence and timing of events in the session. This can help you identify bottlenecks—for example, by spotting images that have inconsistent loading times, which can cause tests to fail sporadically. And you can filter the session’s events to show only errors, highlighting potential causes of the test’s flakiness.
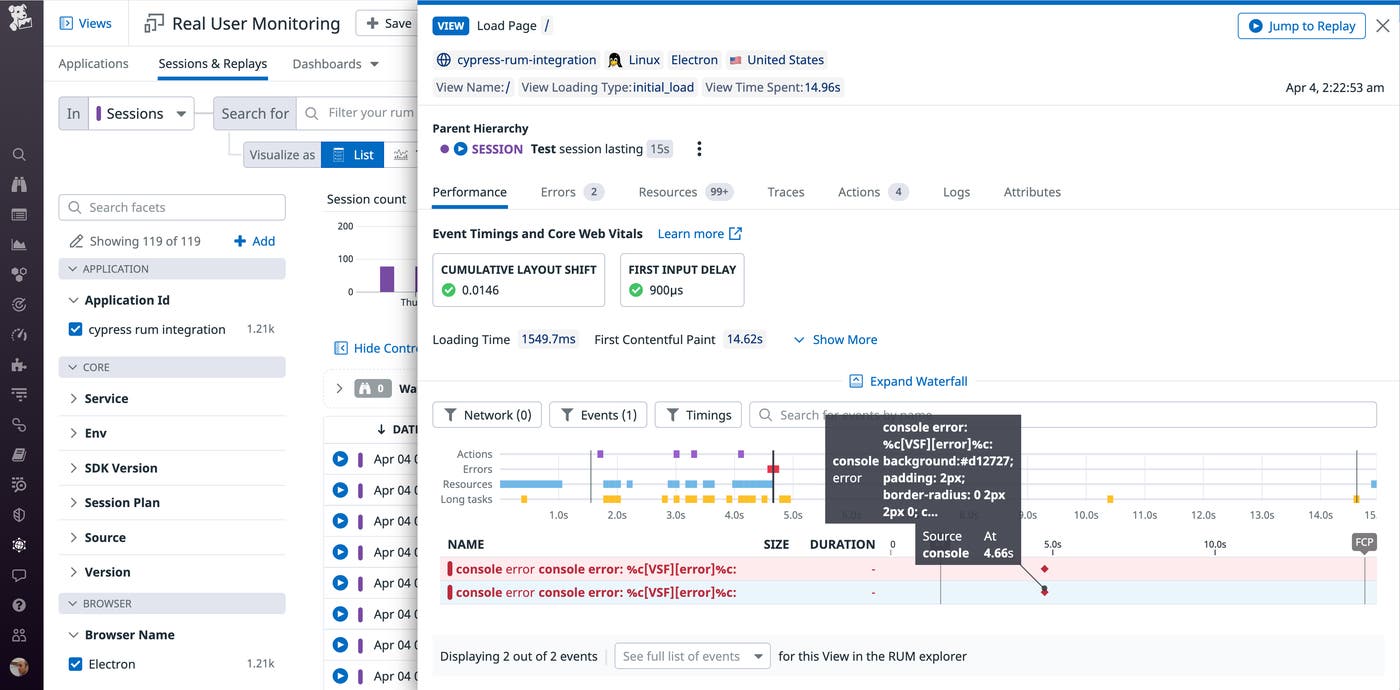
For more insight into the test’s performance, you can click Jump to Replay to see a video-like playback in Session Replay. You’ll see how the browser behaved during the test, including any error messages and missing resources such as images and other page elements that add context to the errors.
Optimize slow tests to speed up your pipelines
Because tests that perform poorly can slow down your pipelines, you need to identify and optimize them to maintain your team’s velocity. The CI Visibility Test Performance tab shows you the duration of your test runs visualized on a scatter plot, including a trend line that makes it easy to spot tests whose duration has increased over time.
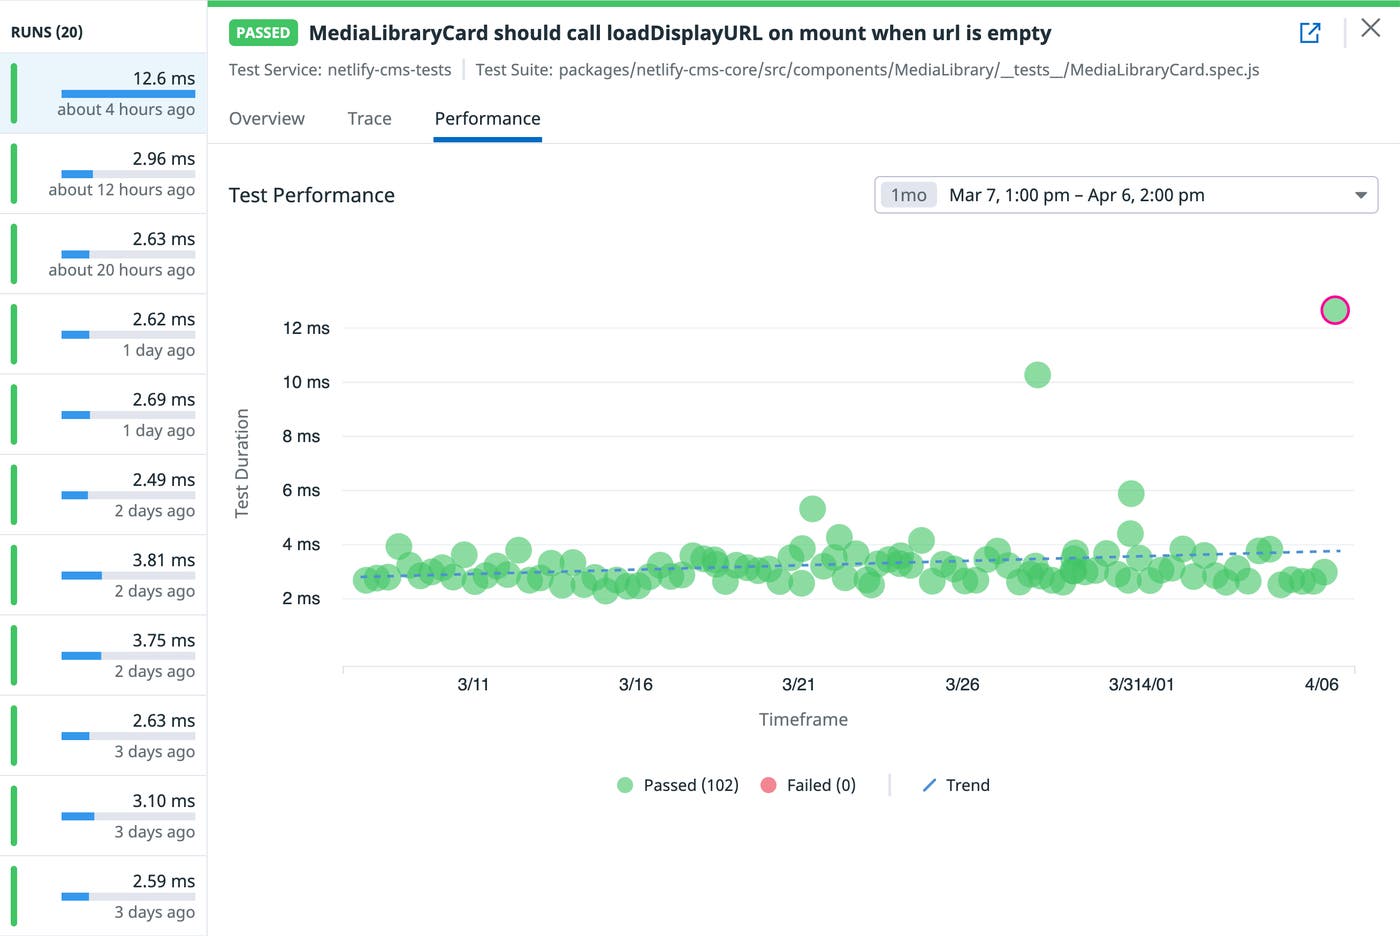
From this view, you can select a slow test and pivot to RUM to gain insight into its poor performance. RUM’s waterfall visualization shows you the timeline and duration of significant UI events, such as the page load and the first contentful paint. To spot the elements that are slowing down your test execution, you can filter the waterfall to highlight certain types of resources (for example, images or JavaScript libraries) or long tasks which can block the thread and delay user interaction. And in just one click, you can access Session Replay to view a playback of the test.
See your CI Visibility data from within RUM
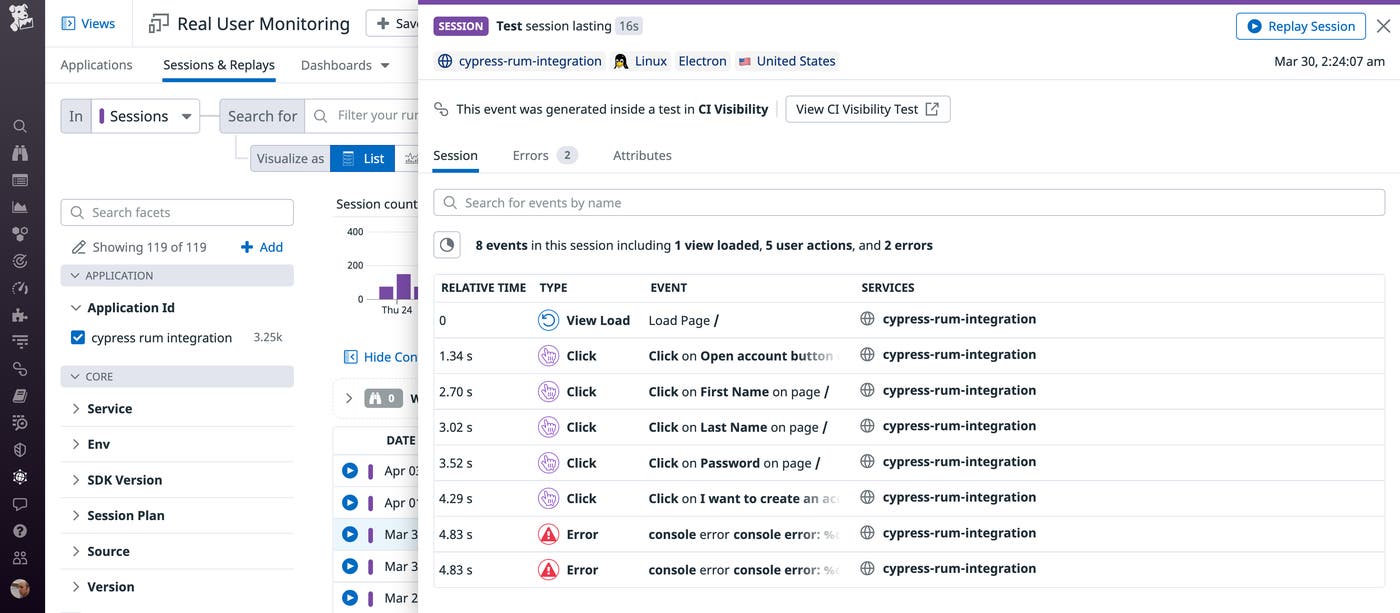
You can also explore your test data in the other direction—starting from RUM and easily pivoting to CI Visibility. For example, you can see if real users are experiencing an error that was detected in a Cypress test by looking at the RUM Sessions & Replays view. The Session Type column differentiates records generated by CI tests (@session.type:ci_test) from those generated by real users (@session.type:user). You can drill down into any test’s data—as shown in the screenshot below—to see exactly what steps led to the error, then click View CI Visibility Test to see details about the test’s performance.
Get the RUM perspective on your CI test performance
If your Cypress tests are instrumented with RUM, their results in CI Visibility are now automatically linked to RUM browser monitoring and Session Replay. You can also use Datadog Synthetic browser tests to automate your user experience monitoring without writing any code; these tests also seamlessly integrate with RUM.
To get started, see our documentation for RUM and Synthetic Monitoring. If you’re not already using Datadog, get started today with a 14-day free trial.
