

Modern cloud applications are made up of thousands of distributed services and resources that support an equally large volume of concurrent requests. This level of scale makes it more challenging for engineers to identify system failures before they lead to costly outages. System failures are often difficult to predict in cloud environments, and security threats add another layer of complexity. As a solution, engineers are turning to approaches like chaos engineering (CE) to proactively find potential points of failure within their cloud infrastructure.
Chaos engineering tests a system’s resilience by deliberately injecting failures into various components, such as servers, databases, and API services. By comparing their system’s behavior in a steady state to its behavior during these controlled experiments, engineers can use chaos engineering to gain a better understanding of how their applications function under stress. Because of its systematic approach to assessing app resilience, chaos engineering has also been applied to security testing, which some have referred to as Security Chaos Engineering (SCE). Instead of introducing failures that verify a system’s resilience, security-focused CE verifies that systems respond appropriately to common threats, similar to red, blue, and purple teaming.
In this post we’ll discuss the key components of security-focused CE, some practical SCE examples, and next steps for conducting experiments on other vulnerable parts of cloud infrastructure. We’ll also look at how security tools like those offered by Datadog can support your experiments and automatically surface threats that you may have missed.
Key steps for security-focused chaos engineering
Though the core goal of chaos engineering is clear-cut, there is some variation in how the discipline is applied. For example, some approaches include steps to patch any found vulnerabilities whereas others treat patching as a separate workflow. The most common approach uses the following steps: define a steady state for your systems, ask questions about how they could fail, inject failure, and monitor their results. For the sake of this post, which focuses on security-focused engineering, we’ll break the process down into the following four parts: question, identify, experiment, and detect.
Knowing where to start this process can be harder than it might seem given the size and complexity of cloud infrastructure, but practices like threat modeling can provide guidance. To get started, it’s important to ask questions about how your systems might be vulnerable to a security threat. Your initial questions should center on whether (and where) your system has potential vulnerabilities that threat actors could exploit and how effectively your monitoring and threat detection systems can identify them. A good approach is to start by asking high-level questions about your application, focusing on business-critical workflows and user journeys. For e-commerce applications, these could include searching for inventory, adding items to a cart, or processing a transaction. For applications in the healthcare industry, critical workflows could include searching for patient information or enabling communication between patients and their doctors.
As you identify which of these areas you want to test—the second step in the SCE process—your questions can become more focused on the individual services and resources that make up those workflows, including:
- A service’s cluster or serverless workloads
- The resources that interact with those workloads, such as storage and compute instances
- The systems that monitor requests to your services and their resources, such as firewalls
Focusing on a subset of your system resources accomplishes multiple goals. It primarily gives you a solid starting point for your experiments, but it also clearly defines and thus minimizes the impact radius, which comprises the services that are affected by failure injections. To minimize the impact radius, you need to identify which resources will provide a large enough sample size for an experiment without negatively impacting other production services. For example, you might conduct a controlled denial-of-service (DoS) attack by routing those requests through a single, isolated firewall.
Your questions and identified resources provide a baseline for your chaos engineering experiments, which are the controlled failures that you inject into your systems to test their resilience. Security-focused experiments can take many forms, and sources like the MITRE ATT&CK knowledge base can help inform the types of experiments you need to conduct. Frameworks like MITRE ATT&CK provide a list of common tactics, techniques, and procedures that threat actors use to research or gain access to a system. We’ll take a look at a few examples of experiments in more detail later.
The last step in the process involves detecting vulnerabilities or other security issues that surfaced as a result of your experiments. Your monitoring and threat detection systems allow you to compare changes between your systems’ steady-state and controlled experiments so you have the context you need to take appropriate action.
Next, we’ll look at some practical ways you can apply these steps to Kubernetes workloads, which are critical yet complex and often misconfigured components of cloud infrastructure.
Security-focused chaos engineering experiments for Kubernetes
Due to their multi-layered, customizable design and larger attack surface, Kubernetes clusters—and their containers—come with a unique set of security concerns. Issues like simple misconfigurations and vulnerabilities introduced by open-source libraries are some of the primary examples of threats to Kubernetes environments. These factors alone can allow threat actors to gather information about your environment undetected, gain a backdoor to your application, or escalate privileges so they can access more resources for activities like cryptomining and stealing secrets.
Based on these security concerns, considering the following questions about your Kubernetes environment can provide a starting point for which services you want to test as part of your controlled experiments:
- Which business-critical workflows are more vulnerable to a threat?
- Do any workflows interact with customer, financial, or other potentially sensitive data?
These kinds of high-level questions can help you pinpoint the appropriate clusters, namespaces, and services in your Kubernetes environment, as illustrated in the following workflow:
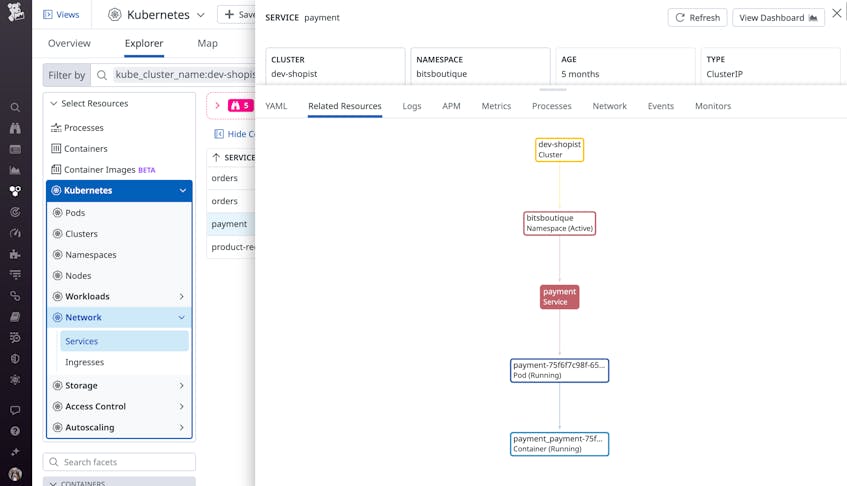
Once you’ve identified those, you can concentrate on their individual components—API servers, workloads, pods, and containers—and ask questions that cover the most common causes of security incidents. As previously mentioned, simple misconfigurations in RBAC or IAM permissions and key Kubernetes resources, a lack of visibility into resource activity, and outdated containers often cause security incidents. With this in mind, you can consider the following questions:
- Are there any publicly exposed API servers, container ports, or keys?
- Are there any privileged pods in your clusters?
- Which container images contain unpatched or known-vulnerable code?
- Is audit logging enabled for your Kubernetes environment?
Next, we’ll look at a few example experiments that you can conduct using some of these questions as a starting point.
Experiment 1: Identify misconfigured API servers
Resources that are unintentionally made publicly available are often the result of simple misconfigurations. For example, it’s common for Kubernetes API servers to allow some form of public access due to enabling unauthenticated requests, giving threat actors control over your Kubernetes resources and secrets.
To test this as part of your controlled experiment, you can send the following requests to your subset of API servers and review their responses:
/api/v1/pods: list all available pods/api/v1/nodes: list all available nodes/api/v1/secrets: list all available secrets
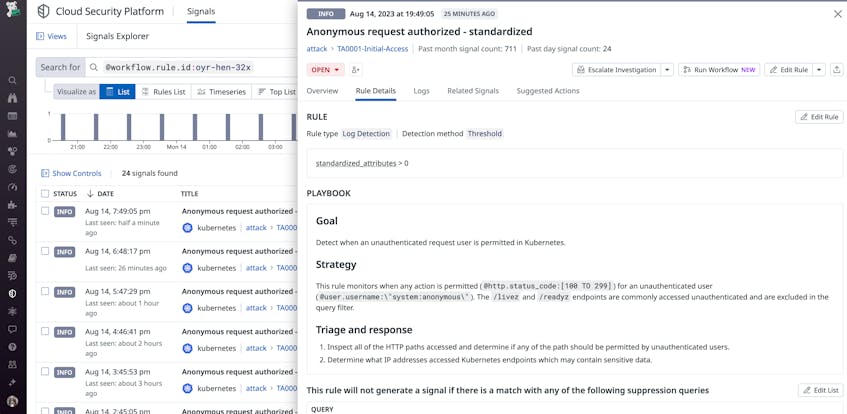
If you send these requests as a non-administrative user—or from the public internet—and the API servers respond with a list of available resources, then they need to be updated with the appropriate authentication controls. With this kind of activity, you will typically see requests from @user.username:\"system:anonymous\" to your servers.
You can also apply this experiment to other parts of commonly misconfigured Kubernetes infrastructure. For example, Google Kubernetes Engine (GKE) environments include a metadata server that stores valuable data. If features like workload identity are not enabled, the metadata server may be publicly accessible. To test its availability, you can curl the computeMetadata/v1/instance/attributes/kube-env endpoint and review its output for environment variables that contain sensitive data, such as kubelet keys.
Experiment 2: Assess visibility into new resources
As part of their attack path, threat actors often attempt to spin up new resources in an environment that they have gained unauthorized access to, such as via a misconfigured API server, or find existing resources with elevated privileges. These actions can include deploying new pods with malicious code or leveraging resources like privileged pods to communicate with external servers.
Both of these operations can look like day-to-day, expected activity on the surface. Privileged pods, for example, can be valuable resources for trusted users who need to perform system-wide operations, such as running debugging tools that require direct access to a host. But they also introduce a security risk because they give a user access to host resources. In these scenarios, a threat actor can leverage a remote code execution (RCE) vulnerability within a privileged pod, which could exist as a flaw in a pod’s third-party library, to gain access to the underlying host. Once they have access, they can deploy malicious code to exfiltrate data, use resources as cryptomining servers, and more.
In these cases, having visibility into when new resources are spinning up and when privileged pods are executing atypical requests becomes a priority. This means that you can focus your experiment on whether your monitoring systems are able to detect this kind of activity.
For example, you can try the following tasks:
- Create a new, privileged pod and exec into an existing one
- Create a new pod that is attached to the host network and sniff traffic for sensitive data via tools like tcpdump
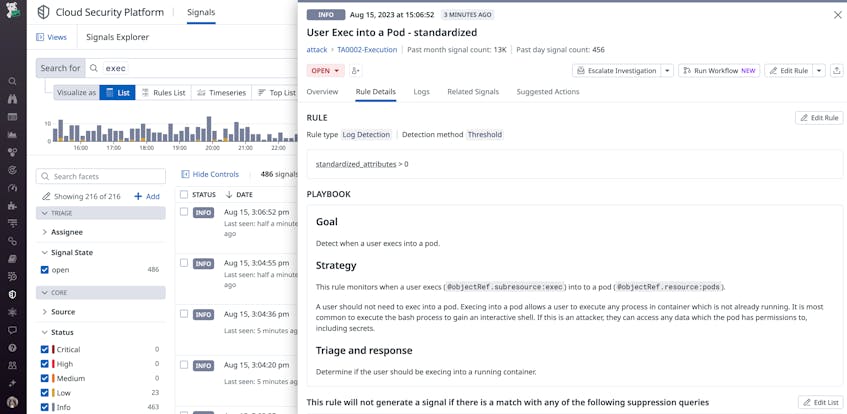
With these example experiments, there are a few requests to look out for in your Kubernetes audit logs. When creating a new pod, look for the @objectRef.resource:pods and @http.method:create attributes. For new privileged pods or pods attached to a host network, you can look for @requestObject.spec.containers.securityContext.privileged and @requestObject.spec.hostNetwork:true, respectively, in addition to the previously mentioned attributes in your logs. For attempts to break out of a pod, you can monitor activity that is commonly leveraged in privilege escalation techniques, such as running the kubectl exec command. In this case, look for the @objectRef.subresource:exec attribute in your audit logs.
Next steps for security-focused chaos engineering
We’ve looked at a few examples of how you can use chaos engineering to test the security of your Kubernetes clusters. You can take these principles further to test other vulnerable parts of your cloud infrastructure, such as serverless workloads, compute instances, and storage. Each component has its own set of vulnerabilities that chaos engineering can help you discover, as the following questions about common issues illustrate:
- How do Lambda functions respond to injection attacks, like from event or SQL injections? What indicators of compromise are present?
- Can a non-administrative account access a sensitive data store?
- Is sensitive data encrypted at rest?
- Will a firewall automatically block traffic from a recently changed port configuration?
- Can a non-administrative account modify or disable a firewall?
- Is logging enabled for vulnerable resources like storage buckets and serverless functions?
Once you’ve determined which areas of infrastructure you want to focus on, questions like these can help you methodically test potential areas of vulnerability. Next, we’ll look at how tools like Datadog enhance your chaos engineering experiments by automatically discovering some of the common issues that leave your systems vulnerable.
Complement your experiments with Datadog
Monitoring is a key aspect of conducting experiments on a subset of cloud resources. It not only allows you to verify the outcomes of your controlled experiments but also ensures that you can reliably detect issues outside of them. Monitoring can also help you track the progress of your remediation efforts as a result of your experiments, in addition to detecting real-time threats.
Datadog supports these goals and more by offering end-to-end visibility across your infrastructure, enabling you to both identify which resources should be a part of your experiments as well as monitor their status as you test them. Datadog also supplements your testing efforts by helping you identify issues that you may have missed, including suspicious activity in logs, application- and code-level vulnerabilities, configuration drift, and more. These issues are commonly seen in growing, complex Kubernetes environments, so it’s important to know when they occur before a threat actor exploits them.
You can use Datadog Cloud SIEM to monitor Kubernetes audit logs, including the logs generated by our previous experiments. For example:
With Datadog CSM, you can detect compliance violations and configuration drift, such as publicly exposed API servers. Datadog CSM will also surface critical vulnerabilities in your containers and hosts in real time, so you can prioritize which code-level issues need to be resolved.
Security-focused experiments for your environment
In this post, we looked at how you can structure chaos engineering experiments to discover security gaps in your environment. We also looked at some practical ways to apply SCE to a Kubernetes environment. To learn more about Datadog’s security offerings, check out our documentation. If you don’t already have a Datadog account, you can sign up for a 14-day free trial.
