
Gabriel-James Safar
To understand how your application is performing for your users, you have to put yourself in their shoes. All too often, that means manually QAing the availability and functionality of your application, and then hoping that your users don't stumble onto any issues that you've missed.
Datadog's new automated browser tests enable you to automate your user experience monitoring and ensure that your users can complete actions like signing up for a new account or adding items to a cart. Anyone on your team can record and automate multistep browser tests in minutes. Once you create a test, Datadog uses machine learning to detect changes to your application and automatically update your tests accordingly. With the addition of browser tests to the Datadog platform, you can monitor user experience alongside metrics, distributed traces, and logs from your applications and infrastructure.
Create tests in minutes with the Web Recorder
Popular browser testing tools like Selenium have reduced the manual effort involved in QAing new features and key functionality. But implementing and maintaining those tests can be time-consuming, between learning a new test framework, setting up test infrastructure, and updating broken tests every time you make changes to your UI.
Datadog Synthetic browser tests are simple to implement: anyone on your team can set up a test in minutes, without any knowledge of specialized frameworks or even coding skills. Using the browser test UI in Datadog Synthetic Monitoring, open up your website or application and start recording. As you interact with your application, Datadog automatically records the actions as a series of discrete steps, which you can then edit or build on. You can also add assertions, such as verifying that a user sees a welcome message upon signup.
Fully hosted browser tests

When you record a test, you can select how often and on which devices you want it to run, and choose from several global locations. You’ll be able to see data from your test runs immediately, without setting up and configuring your own testing infrastructure. However, if you want to monitor internal-facing applications or CI environments that aren't publicly accessible, you can easily set up up private location workers to run Datadog Synthetic tests.
Automate your UX testing with Datadog's intelligent, adaptive browser tests.
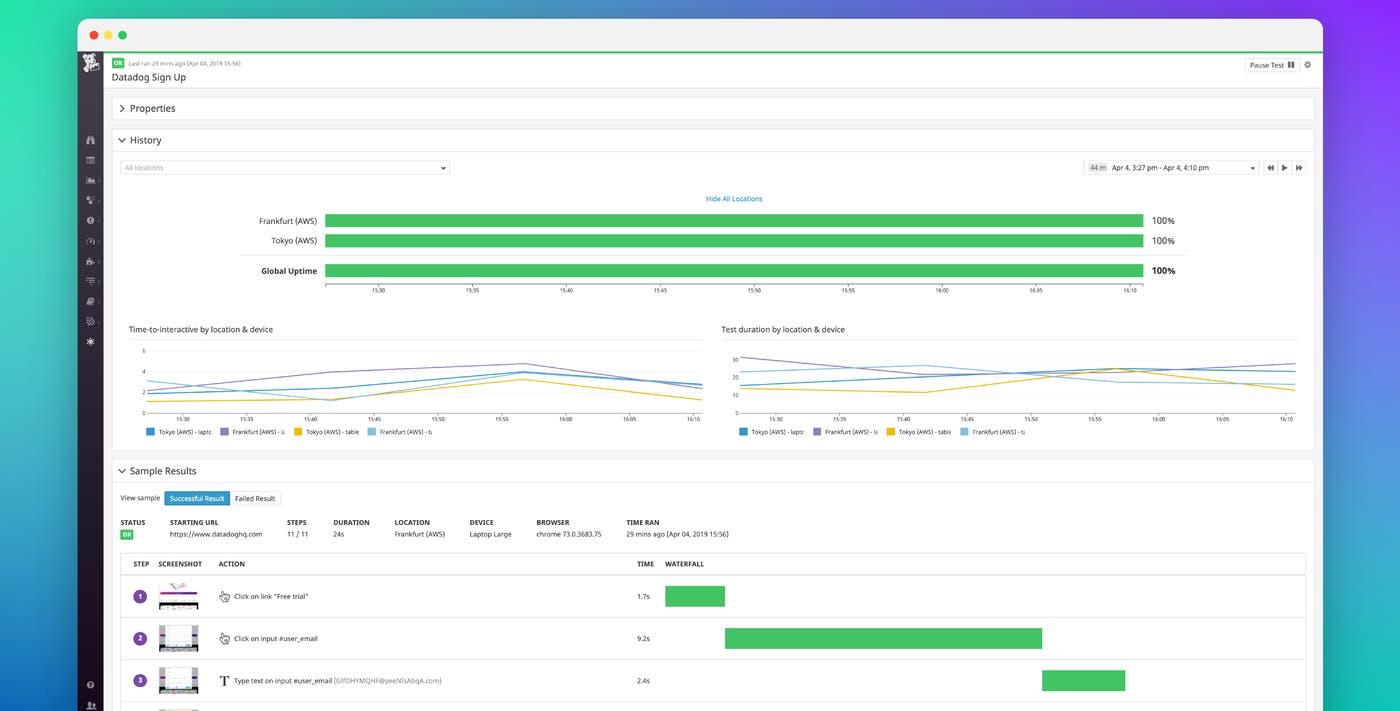
For each executed test run, you can see the test status, the end-to-end duration of the test, and a waterfall visualization of the duration of each step. For every step and assertion, Datadog automatically generates a screenshot from your application, so you can see exactly what your users are seeing.

Self-maintaining browser tests
Automated browser tests have traditionally been notoriously brittle, often breaking as a result of even minor UI changes. To eliminate false alarms caused by flaky tests, AI-powered Datadog Synthetic browser tests mimic human decision-making processes and intelligently adjust in response to application changes.
For instance, when a button in your web app is moved or the identifier of an element changes, a Datadog Synthetic browser test infers how to carry out the existing test in the updated UI. If all the steps and assertions in the test can be completed successfully, Datadog updates the stored identification mechanism and test definition to reflect the changes on the page. Ultimately, these self-maintaining browser tests allow teams to spend less time fixing tests and instead focus on building new features.
End-to-end visibility for troubleshooting

When a browser test fails because of frontend or backend issues in your application, Datadog provides the context you need to troubleshoot the issue quickly. Screenshots from the test show you what your users are seeing (did a key element disappear from the page due to a JavaScript bug, or did the page return a 503 due to server issues?). Datadog Synthetic Monitoring is tightly integrated with the rest of the platform, so you have access to end-to-end context for troubleshooting, from application logs and distributed request traces to infrastructure metrics.
Record your first browser test
Following the acquisition of Madumbo, a browser testing company that I co-founded in 2017, the entire Madumbo team has been hard at work to incorporate our technology into Datadog. We are thrilled to add browser tests to the Datadog platform. To learn more, visit our documentation, or click on the Synthetic Monitoring tab inside the Datadog app to record your first browser test. If you aren't using Datadog yet, you can sign up for a 14-day free trial today.
