Candace Shamieh
As a new Datadog customer, your top priority is figuring out how to maximize the platform’s potential and deliver value to your organization quickly and seamlessly. But with a plethora of options and configurations available at your disposal, it can be overwhelming to determine where to begin. With Datadog, you don’t need to be an expert in observability or monitoring to get up and running efficiently.
Along with our built-in integrations for easy setup and out-of-the-box dashboards for fast troubleshooting, our Recommended Monitors provide you with alert queries and thresholds for a variety of services, allowing you to get started with confidence in minutes. Each Recommended Monitor is preconfigured based on the firsthand expertise and feedback of our own internal teams, technology partners, and thousands of customers, so you can be assured that any issues within your environment will be brought to your attention at the right time.
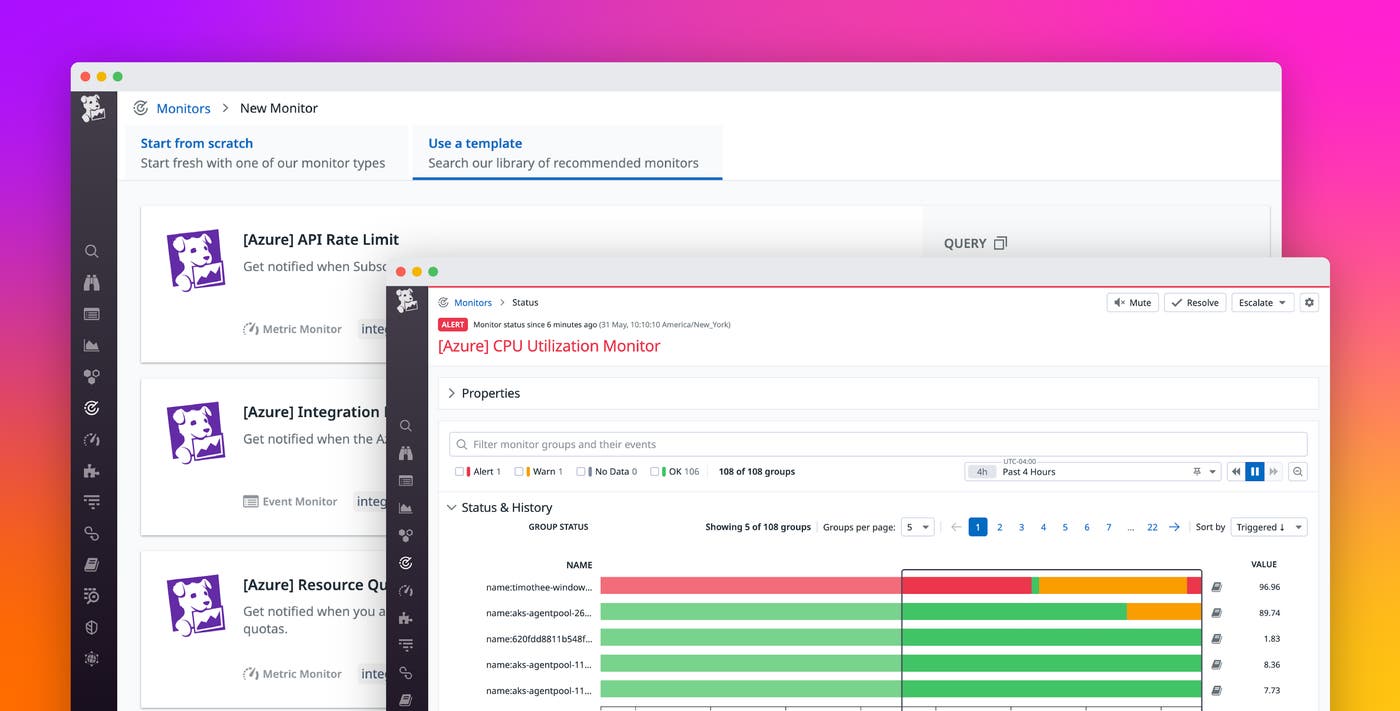
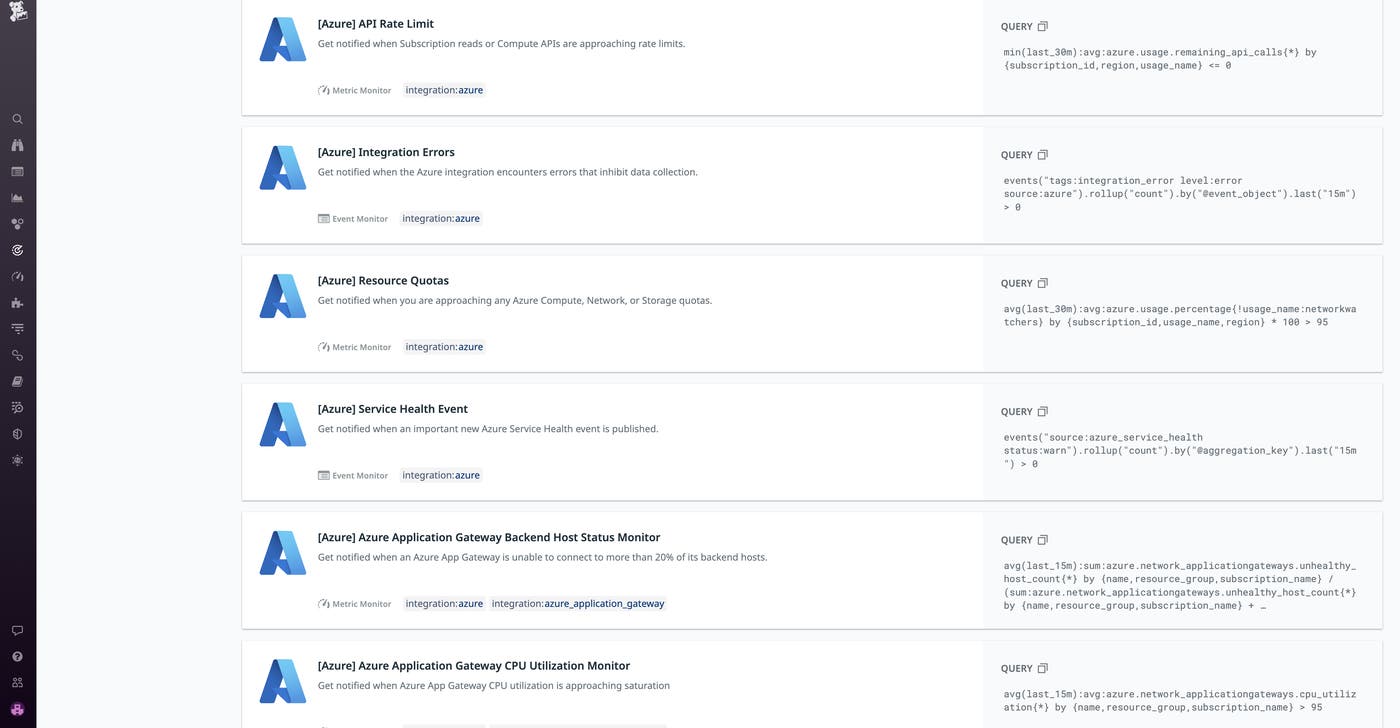
To expand our commitment to simplified alerting, we’re pleased to introduce our Recommended Monitors for Azure, created to help you thoroughly monitor your Azure environment. We currently provide Recommended Monitors for individual Azure services that leverage Datadog-generated metrics—Azure SQL Database, Azure Virtual Machines (VMs), Azure Application Gateway, Azure App Service, and Azure Functions—in addition to broader service health events, resource quotas, API rate limits, and integration errors. As with all of our Recommended Monitors, our Azure Recommended Monitors adhere to Microsoft’s guidance and our alerting best practices, meaning that each one will be preventative, contextual, and actionable.
In this post, we’ll discuss where to start with Azure Recommended Monitors, cover a few use cases that will help you understand their value, and explain how they can assist you with safeguarding and optimizing your Azure environment.
Start monitoring your Azure resources at scale in minutes
Once you have installed any Azure integration in Datadog, you can enable corresponding Recommended Monitors and immediately start receiving alerts that inform you of Azure resource performance. For example, if you want to verify that your Azure VMs can adequately handle your workload demand, our CPU utilization monitor has prefilled queries and thresholds in place that can help you rebalance your workloads before an issue disrupts your environment.
Many of our Azure Recommended Monitors can be viewed on—or added to—our out-of-the-box dashboards in the form of Monitor Summary widgets, allowing you to obtain the right information from one convenient location within the Datadog platform. We have created out-of-the-box dashboards for many Azure services, including SQL Database, App Service, and Functions, so that you can troubleshoot with the metrics that you need to resolve investigations, remediate issues, and prevent future disruptions to production.
In addition to threshold alerts, Azure Recommended Monitors can also include machine learning-powered anomaly detection, notifying you of activity that deviates from the normal pattern. For example, if you enable our anomaly detection Recommended Monitor for Azure App Service, you’ll be notified any time the number of connections were outside of the normal pattern for a 15-minute time period. In this use case, it would be helpful to leverage our App Service out-of-the-box dashboard and review the historical workload patterns. Then, you can customize the time period, alert and warning thresholds, what defines an anomaly, who to notify, add additional queries and formulas, or other specifications of the monitor to your liking so that it properly fits your needs.
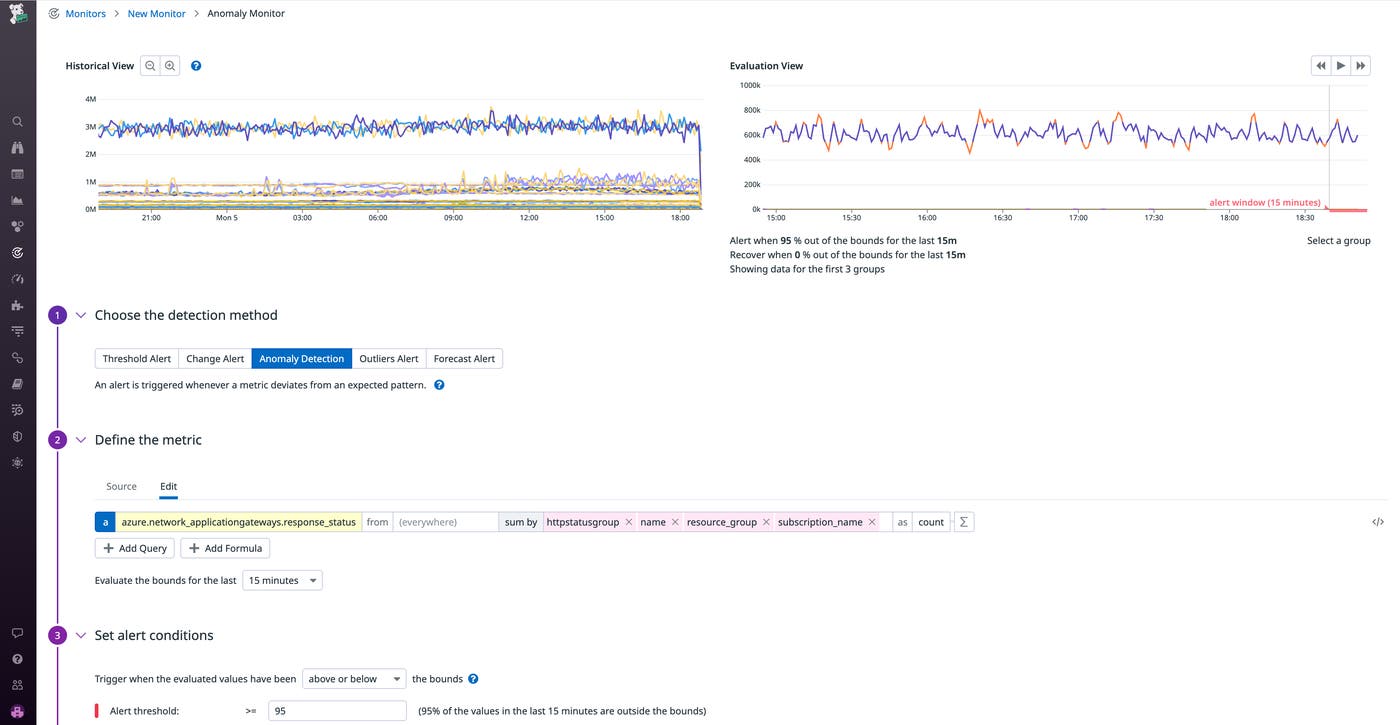
You can also leverage Azure Recommended Monitors that will check service health, enabling you to know that your workloads are performing well and available and notifying you when an important event is published. For a comprehensive list of Azure Recommended Monitors, visit the Datadog monitor library.
Get notified and take action today
Azure Recommended Monitors provides out-of-the-box access to monitoring best practices for your services, so you can incorporate actionable alerts into your monitoring workflow within minutes of installing your Azure integrations in Datadog. And because every alert triggered by an Azure Recommended Monitor comes with a wealth of contextual data and detailed next steps, you’ll have all the information you need to quickly start an investigation.
Check out our documentation for more information about getting started with monitors at Datadog. If you’re using AWS, check out our blog post about Recommended Monitors for AWS. And if you’re new to Datadog, you can get started with a 14-day free trial.
