

We are proud to announce that we have enhanced our Microsoft Azure integration to support more than 60 Azure services, including Cosmos DB, Service Bus, and Azure DB for MySQL and PostgreSQL. Datadog now automatically collects metrics and tags from all services supported by Azure Monitor to provide comprehensive Azure monitoring through one integration.
We’re also excited to announce that we have officially released support for Azure Service Fabric, a distributed systems platform that makes it easy to package, deploy, and manage reliable, auto-scaling microservices and containers. Datadog’s Azure Virtual Machine extension enables you to deploy the Datadog Agent directly on the auto-scaling nodes in any Service Fabric cluster, so you can track their health and resource consumption in real time.
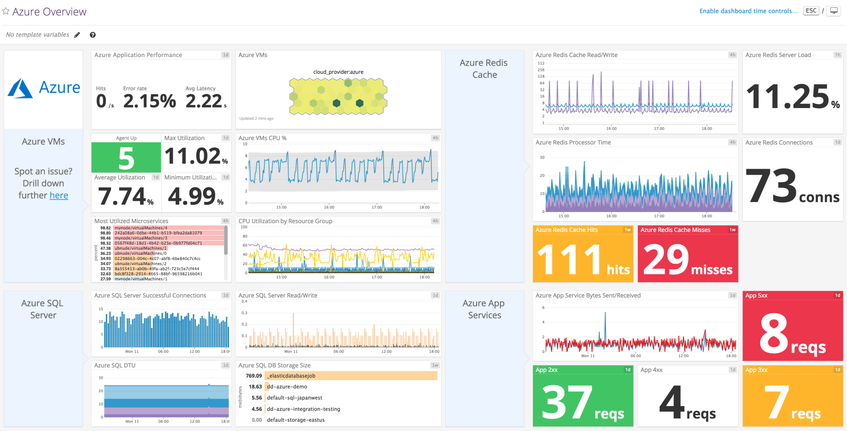
These enhancements build on our existing support for services like Azure Classic and ARM Virtual Machines, Azure SQL Database, and Azure App Services. Furthermore, we provide visibility into the broader Microsoft and Windows ecosystem with integrations such as Microsoft IIS and Windows Management Instrumentation.
Better tagging for Azure monitoring
Azure Monitor’s multi-dimensional metrics enable you to track timeseries values across one or more dimensions, or attributes of your data. Datadog’s enhanced Azure integration pulls in those dimensions as tags, so that you can slice, group, and filter your data however you’d like.
The dimensions provided by Azure vary from metric to metric (e.g., an IP address dimension for network traffic metrics or a disk-identifier dimension for disk space metrics). The screenshot below indicates that Azure Monitor provides a Transactions metric that tracks the number of requests to Blob Storage accounts across three dimensions: ResponseType, GeoType, and ApiName.

Datadog automatically converts dimensions into key:value format (e.g., responsetype:success) and tags each metric accordingly. You can use these tags in dashboards and alerts to get deeper insights into your Azure infrastructure. The example below shows how you can graph the average number of transactions hitting your Blob Storage accounts, broken down by API name and response type. You can explore this visualization to determine, for example, which types of requests generated successful responses or resulted in a higher rate of errors. These new tags make it easier than ever to troubleshoot issues in your Azure environment and quickly drill down to the data that matters to you.

Azure also lets you add custom key:value tags to your resources via the REST API, the Azure CLI, PowerShell, or the Azure Portal.

Datadog will automatically collect your custom tags and apply them to relevant metrics, so that you can filter and group your data to create useful graphs and alerts. In the example below, we are filtering by a custom tag, pipeline_id, to visualize a particular segment of network traffic on an Azure VM instance.

Integrate with Azure Service Fabric
Monitoring the health of your Azure Service Fabric cluster in Datadog is as easy as running one command in the Azure command line interface.
To run the command, you’ll need to make note of four things:
- the operating system your cluster is running (Windows or Linux)
- the Resource Group your cluster is housed in
- the name of the Virtual Machine Scale Set (VMSS) that is managing the underlying nodes in the cluster
- your Datadog API key, which you can find in your account here
Next, log in to the Azure CLI by running az login. Run this command to deploy the Datadog Agent on the nodes in your cluster (making sure to replace <DATADOG_AGENT_NAME> with either DatadogWindowsAgent or DatadogLinuxAgent, depending on your cluster’s operating system):
az vmss extension set --name <DATADOG_AGENT_NAME> --publisher Datadog.Agent --resource-group <RESOURCE_GROUP_NAME> --vmss-name <VMSS_NAME> --protected-settings "{'api_key':'<YOUR_API_KEY>'}"
Alternatively, you can add the Datadog Azure Virtual Machine extension directly to the ARM template of your Service Fabric cluster.
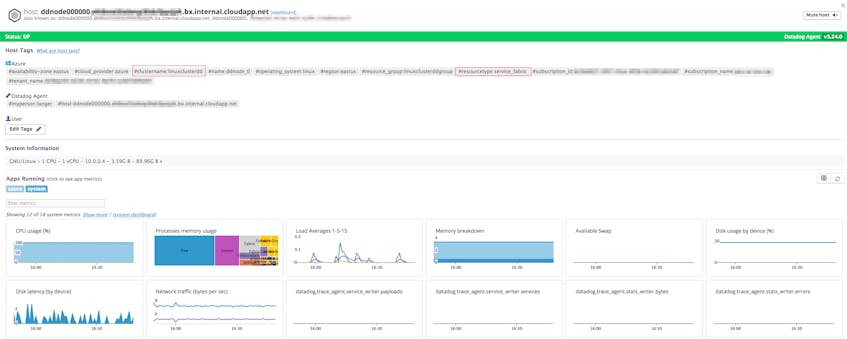
And that’s it! Within a few minutes, Azure Resource Manager will deploy the Datadog Agent on each node in your cluster, and the Agent will begin reporting health metrics in the Datadog UI. Additionally, if you have already installed the Datadog Azure integration, metadata and tags from these nodes will be applied automatically.
Start using Datadog’s Azure integration
If you’re already monitoring Azure with Datadog, you can immediately start using these enhancements to get more visibility into your environment. Otherwise, follow the instructions here to get started.
If you’re new to Datadog, you can try out these Azure monitoring features with a 14-day free trial .
