Emily Chang

Akash Rao
Azure Cosmos DB for PostgreSQL is a fully managed relational database service for PostgreSQL that is powered by the open source Citus extension. With remote query execution and support for JSON-B, geospatial data, rich indexing, and high-performance scale-out, Cosmos DB for PostgreSQL enables users to build applications on single- or multi-node clusters.
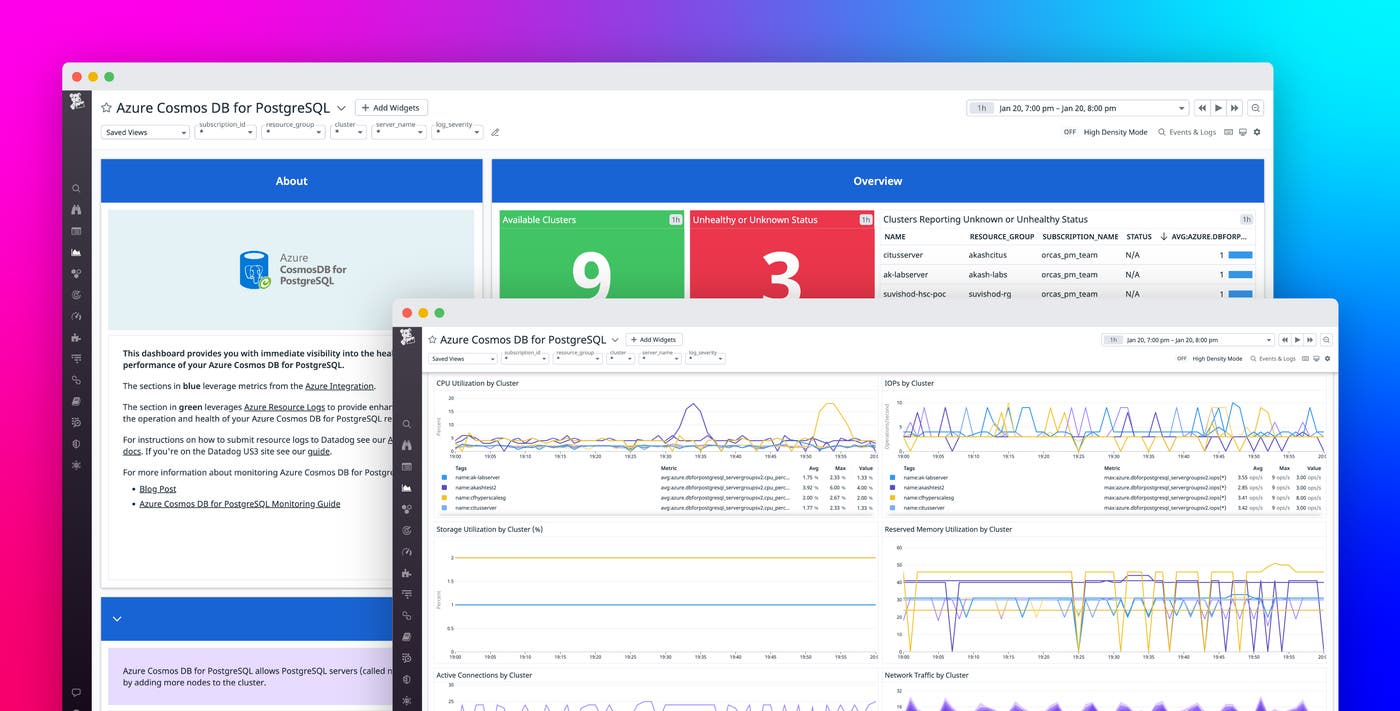
In this post, we’ll explore how you can visualize key metrics and logs with Datadog’s out-of-the-box dashboard and use automated monitors to track the health and performance of your Azure Cosmos DB for PostgreSQL databases.
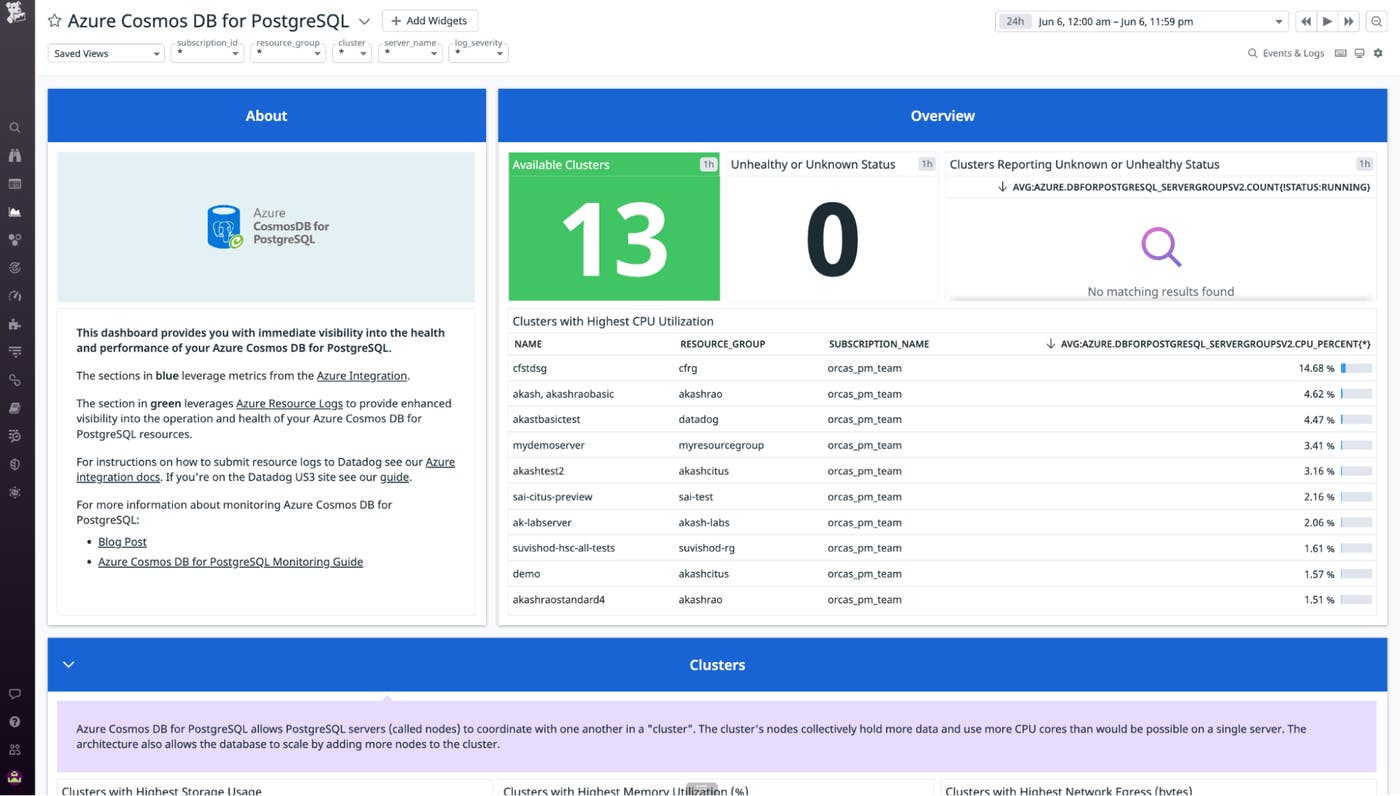
Monitor the health of clusters
When setting up your Azure Cosmos DB for PostgreSQL environment, you can provision clusters to distribute load. A cluster is typically made up of a coordinator node and one or more worker nodes. Applications send requests to the coordinator node, which then determines which worker nodes to query based on the data that needs to be accessed.
Proactively scale your nodes and cluster
Azure CosmosDB for PostgreSQL leverages distributed tables to parallelize queries and avoid overloading any single node. However, as your database grows in size or demand increases, you may need to scale your clusters horizontally (by adding more nodes) or vertically (by sizing up the nodes). Datadog’s out-of-the-box dashboard can help you identify and scale any clusters that need more resources.
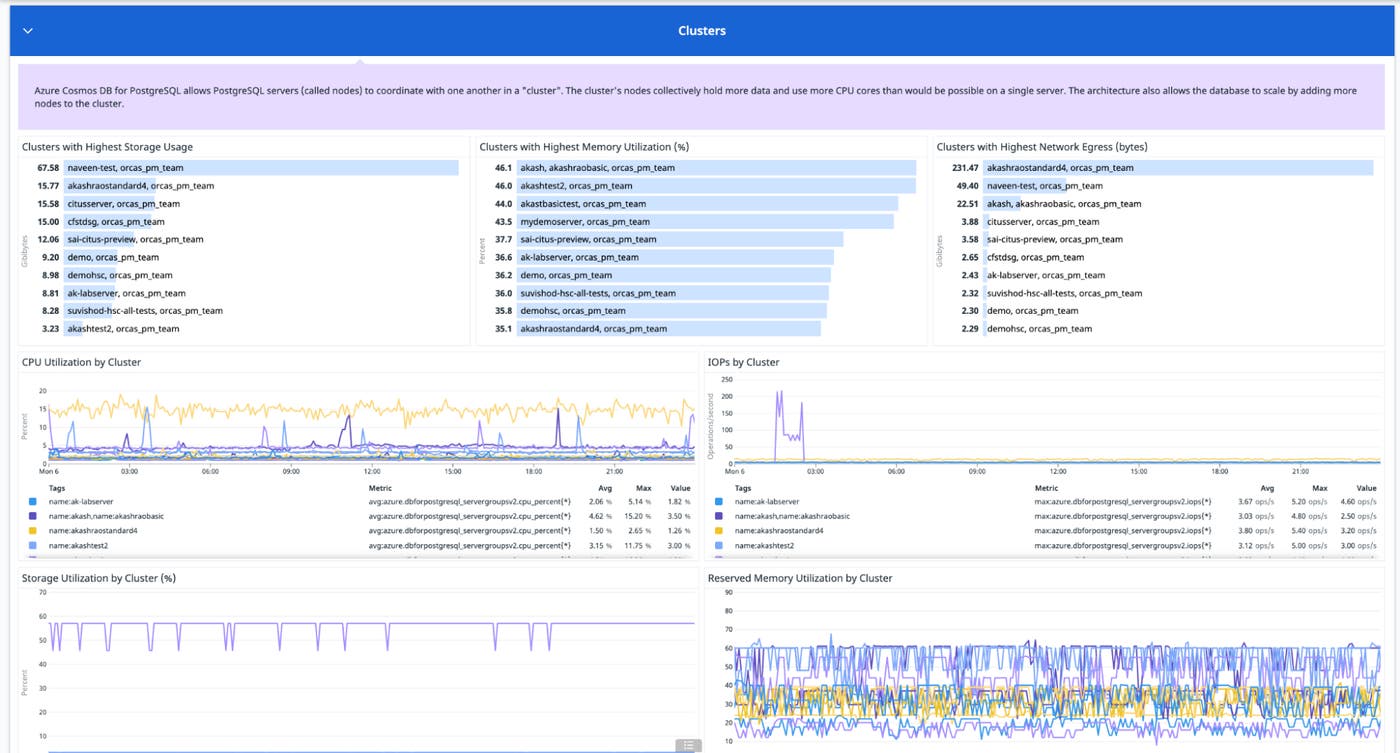
Azure Cosmos DB for PostgreSQL provides several options for configuring the amount of resources that are available to the coordinator and worker nodes in your clusters. Keeping an eye on the following metrics can help ensure that your workloads run smoothly without running into resource-related bottlenecks:
- Reserved memory utilization: PostgreSQL uses memory to run database queries quickly and efficiently without accessing disk. If a database node does not have enough memory to run a query, it generates an out-of-memory error. Monitoring the reserved memory utilization metric can help you identify when applications are using a high percentage of the cluster’s available memory, which indicates that the cluster is under memory pressure. If this metric consistently exceeds 90 percent on your cluster, you should consider adding more nodes to distribute query load.

- CPU utilization: CPU is another resource that is essential for keeping nodes running efficiently. A temporary spike in CPU usage could be due to a particularly intensive query, so it may not require you to scale up your cluster. But, if CPU usage regularly exceeds 95 percent across a cluster, this could indicate that your nodes are overloaded, which means you should consider scaling up.

- IOPS: Monitoring your nodes’ IOPS can help you gauge whether you have configured enough capacity for your use case. The total IOPS capacity available to your cluster depends on the amount of storage provisioned as well as the number of nodes in the group. For example, a cluster with two worker nodes and 2 TiB of provisioned storage would have a total IOPS capacity of 12,296. If you see total IOPS approaching the maximum capacity of your cluster, you may want to consider adding worker nodes.

- Storage usage: In addition to storing data from your database, your nodes need enough storage to accommodate logs and temporary files for executing queries. If storage usage exceeds 85 percent, you should scale up by adding more storage to nodes in your cluster. Alternatively, you can also consider scaling out the group by adding more worker nodes.
All of these metrics and recommendations are included in our out-of-the-box dashboard so anyone on your team can spot and address issues right away.
Alert on resource issues
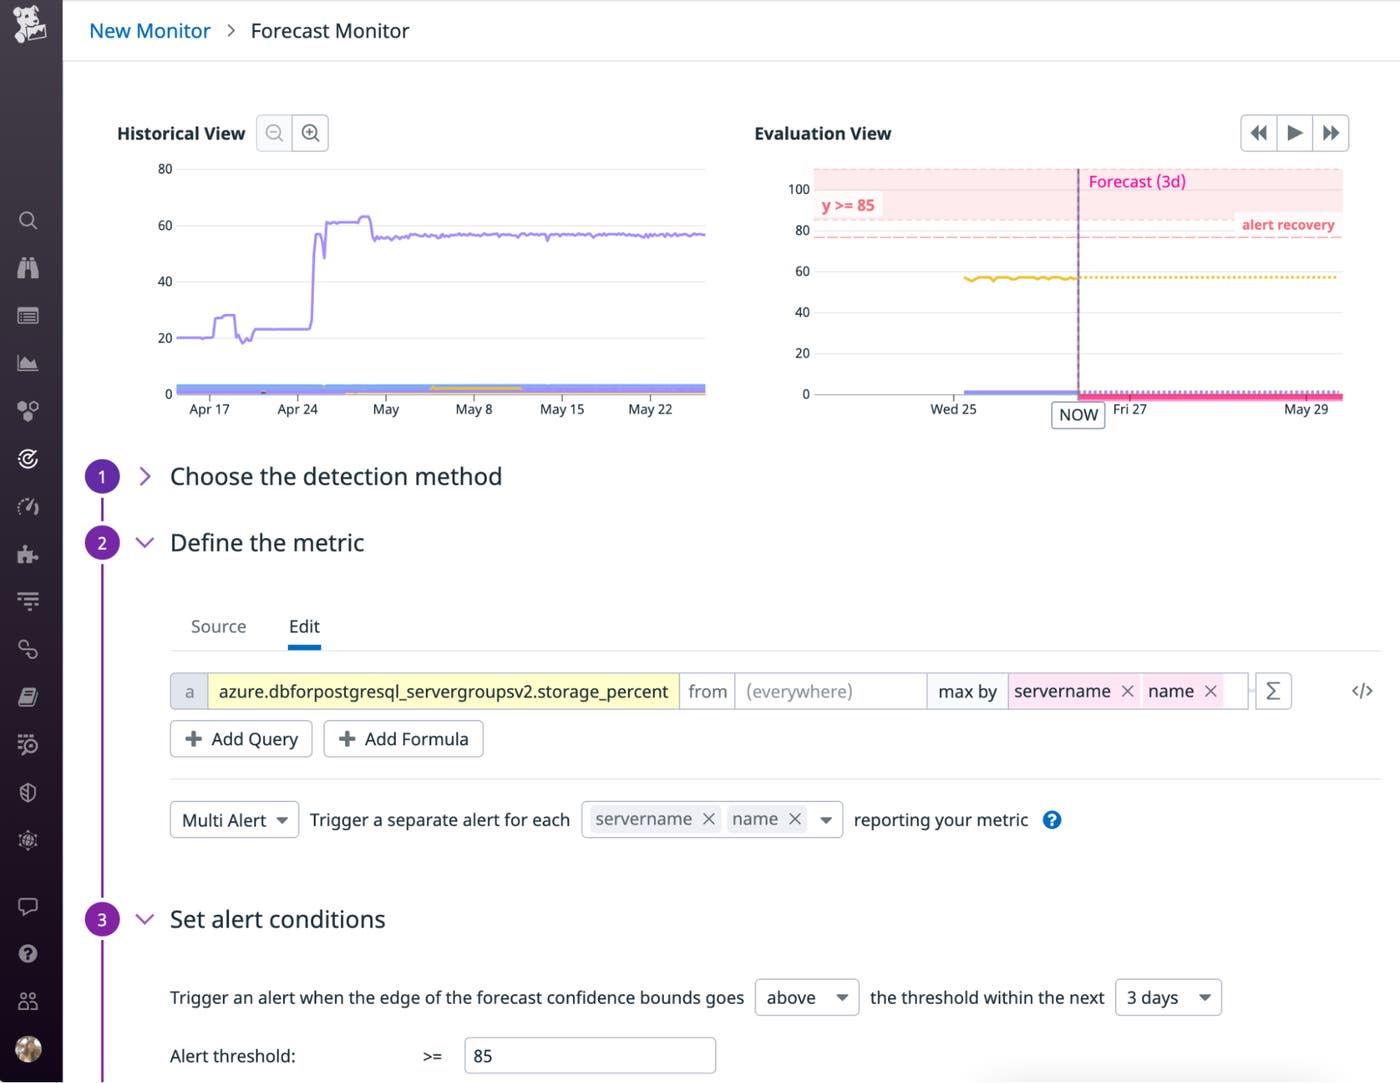
You can also set up monitors to automatically get notified of impending issues. The example below shows how you could configure a forecast monitor to detect if storage usage is predicted to hit 85 percent, giving you enough time to address the issue by deleting unused logs or scaling up the amount of storage available on your nodes.
Anomaly monitors can also be useful for detecting abnormalities in your clusters’ resource usage. For example, CPU utilization typically varies based on the nature of your workloads (e.g., higher usage during business hours), which can make it challenging to configure threshold-based monitors. An anomaly monitor can reduce noise by automatically factoring in day-of-week and time-of-day patterns, ensuring that you only get notified about real issues (i.e., abnormally high, sustained growth in CPU usage, rather than expected fluctuations).
Inspect logs to get deeper insights
In addition to the metrics mentioned above, Datadog’s embedded Azure integration enables you to collect logs from Azure Cosmos DB for PostgreSQL with just a few clicks.
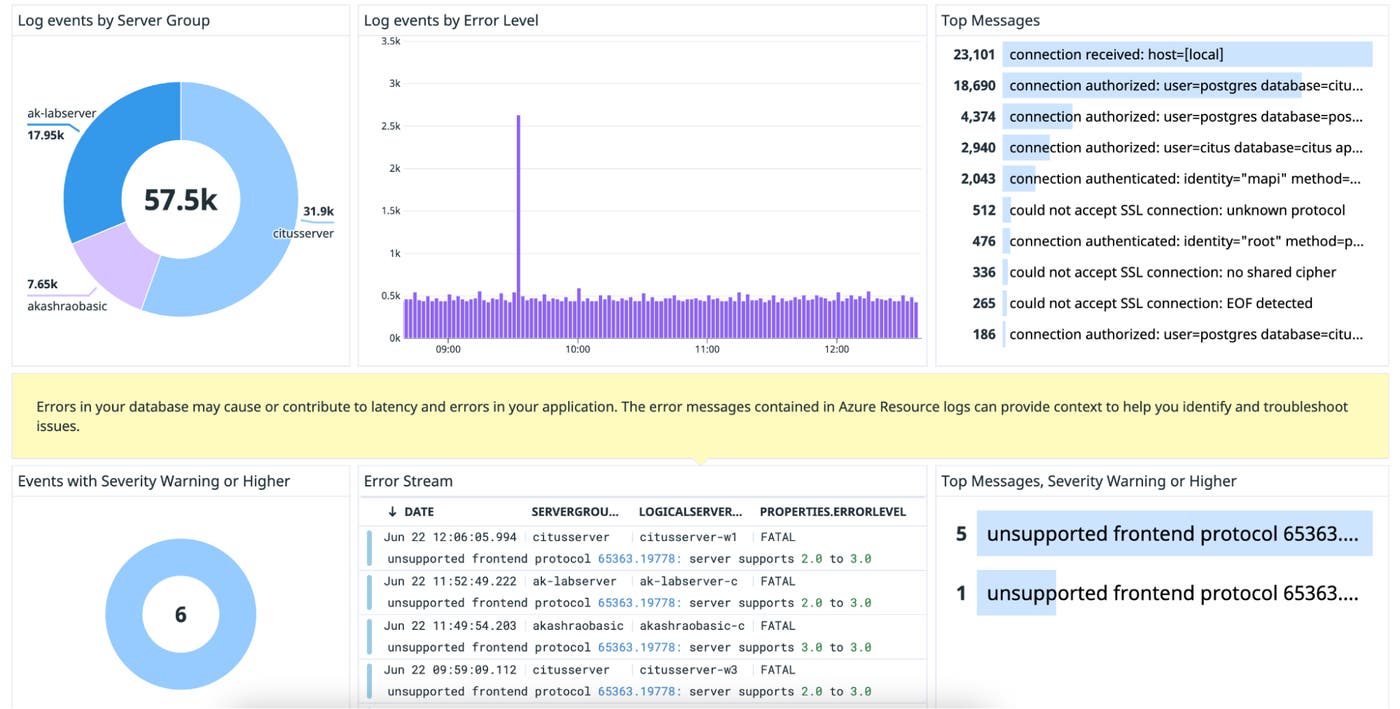
Resource logs can be useful for troubleshooting configuration and performance issues. For example, Cosmos DB for PostgreSQL requires applications to connect using Transport Layer Security (TLS). If an application does not have TLS connections enabled, then you will see a rise in could not accept SSL connection error logs.
Datadog’s out-of-the-box dashboard displays Azure Cosmos DB for PostgreSQL resource logs, so you can easily correlate them with metrics to investigate performance issues and misconfigurations. You can use these visualizations to surface the most frequent types of logs, recently emitted error logs, and other trends.
Full visibility into your Azure Cosmos DB for PostgreSQL stack
Azure Cosmos DB for PostgreSQL provides a highly scalable solution for running distributed, business-critical workloads. If you’ve already enabled Datadog’s Azure integration, you can start monitoring Azure Cosmos DB for PostgreSQL without any additional configuration. For details on the metrics collected, see our docs.
If you’re new to Datadog, sign up for a free trial to get started.
