

Azure Container Apps is a serverless platform that enables you to deploy containerized applications and microservices—regardless of their code or framework—without managing any underlying cloud infrastructure or orchestrators. By using serverless containers, Azure Container Apps can automatically scale based on HTTP requests or events supported by Kubernetes event-driven autoscaling (KEDA) in order to accommodate peak demand and meet your budgeting goals. The service also integrates with the Distributed Application Runtime (DAPR), giving you a comprehensive suite of tools for deploying your container apps.
Our turn-key integration with Azure Container Apps provides visibility into key metrics. You can also instrument your container apps to begin sending traces, logs, and custom metrics directly to Datadog. In this post, we will explore how you can gain deep visibility into your container apps by monitoring:
- Traces and logs
- Processed HTTP requests
- Cold starts and application restarts
- Replicas supporting your services
This data gives you better insight into the state of your Azure Container Apps environment so you can easily monitor traffic volume, container configurations, resource usage, and more. And because the integration is part of Datadog’s unified monitoring platform, you can easily track Azure metrics alongside other resources in your environment for a comprehensive view of application performance.
Collect traces and logs directly from your container apps
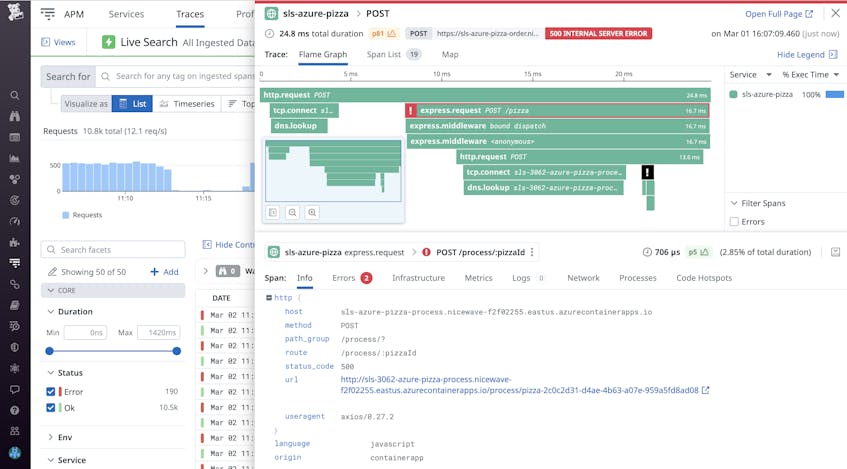
Once you’ve instrumented your container apps, you can begin sending traces directly to Datadog. You can view flame graphs that break down requests into their individual spans, which helps you pinpoint the exact source of errors and slowdowns. In the flame graph below, we’re able to quickly identify the span responsible for a 500 internal server error, which we can then troubleshoot using the “Errors” tab.
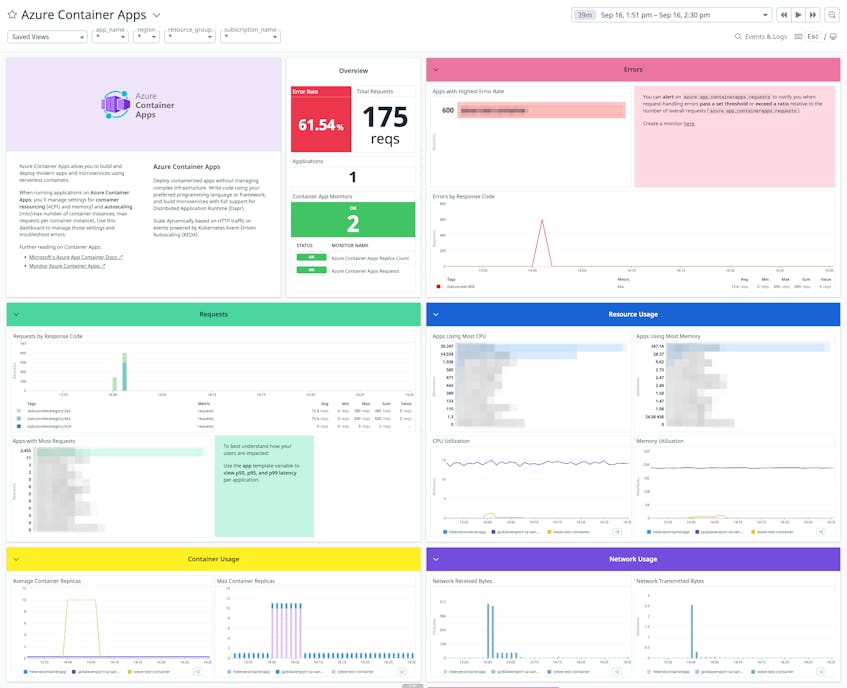
By configuring Unified Service Tagging for your containerized environment, you can quickly pivot between metrics, traces, and logs to debug issues. For example, you can use the out-of-the-box Container Apps dashboard to quickly identify apps with high volumes of errors or excessive resource utilization, and immediately pivot to their related traces in APM to troubleshoot.
Instrumenting your container apps also enables you to send logs from your serverless workloads to Datadog for greater context when troubleshooting. You can filter for Container Apps logs in the Log Explorer and view any automatically detected log anomalies (e.g., an abnormal spike in errors) that require investigation.
Monitor traffic volume for unusual activity
Your container apps may experience predictable peaks and valleys in traffic volume depending on their purpose and other factors, such as the time of day or day of the week. It’s critical that you have visibility into these traffic patterns so you can detect when they deviate from historical trends. Without it, you may miss performance issues that could affect your customers’ overall experience.
Monitoring the azure.app_containerapps.requests metric, which measures the total number of processed HTTP requests for a particular container app, can help you quickly identify sudden changes in traffic volume. For example, you can use this metric to detect a significant drop in requests during peak hours. To provide better insight into the nature of a request, the metric is also tagged with contextual metadata, such as statuscodecategory and statuscode. For example, you can filter requests by the statuscode tag to quickly identify a surge in server errors.
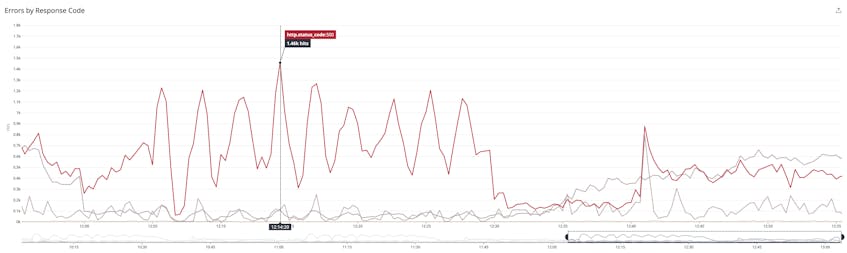
A higher error rate could indicate that a container app is either offline or no longer able to process requests. You can troubleshoot this activity further by reviewing the state of your container apps and their underlying resources.
Detect cold starts and container restarts
Each container app instance, which is referred to as a replica in Azure, is supported by one or more containers. When these resources do not have sufficient memory to process requests, they may throw an out-of-memory (OOM) error and terminate. In these cases, replicas will automatically restart by default—but will repeatedly crash.
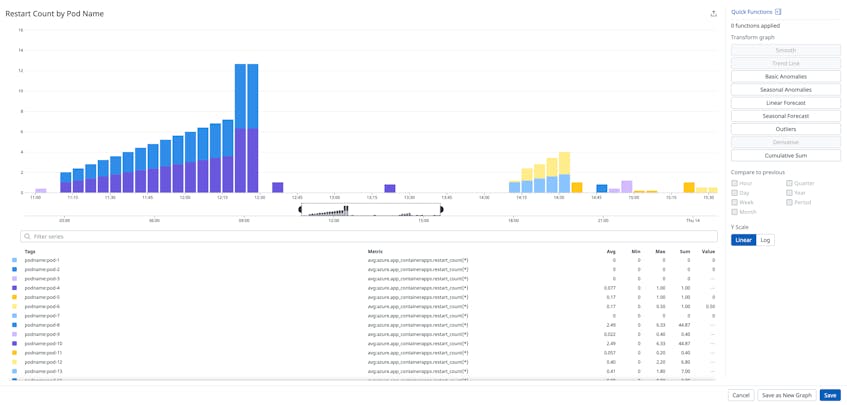
You can surface these kinds of configuration issues by monitoring the azure.app_containerapps.restart_count metric, which captures the total number of restarts per replica. A low or fixed number of restarts indicates that your container apps are deploying new replica revisions as expected. However, if you see a higher number of replicas restarting within a short period of time along with an equally significant surge in the number server errors, you may need to confirm that they have enough memory to process requests.
Oftentimes, replicas will be deployed when no containers are available to service a request. This event, known as a cold start, can introduce significant latency depending on your container’s memory allocation, runtime, and other factors. Datadog will automatically tag all Container Apps traces that experience a cold start, which can inform you of apps that could benefit from increasing minReplicas (the minimum number of replicas that should run at all times). You can use the azure.containerapps.enhanced.cold_start metric to track cold starts with alerts and custom dashboards.
Track resource usage and costs across all containerized applications
The amount of resources that you allocate to your container apps not only affects their performance but also their scaling capabilities and overall costs. For example, Azure Container Apps can scale the number of replicas in your environment based on their resource utilization, but Azure also charges for the amount of resources your replicas consume. If you don’t set appropriate limits on the number of replicas in your environment, your monthly costs can significantly increase.
Datadog’s Azure Container App integration gives you a better understanding of Azure’s scaling activity. For example, you can monitor the azure.app_containerapps.replicas metric, which measures the total number of running replicas, to quickly visualize deployment trends. If the metric’s value is trending upward at a constant rate, for instance, your monthly bill will also steadily increase.
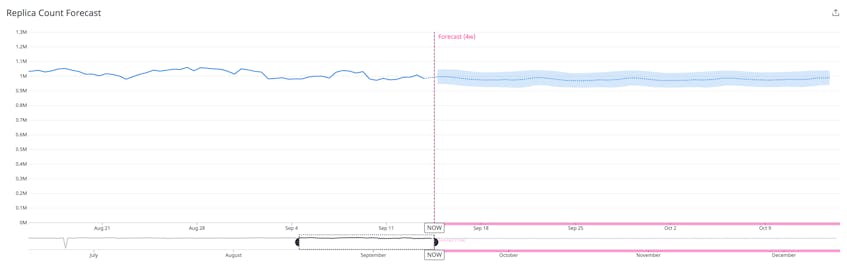
To improve the cost efficiency of your container apps without sacrificing their performance, you can configure the minimum and maximum number of replicas that Azure deploys to your environment.
Start monitoring Azure Container Apps today
Datadog’s Azure Container Apps integration allows you to monitor all of your containerized applications and microservices in one place. Datadog also enables you to track Azure traces, logs, and metrics alongside visible data from other technologies in your stack, giving you a complete picture of your infrastructure. Check out the in-app instructions to learn how to start monitoring Azure Container Apps. If you don’t already have a Datadog account, you can sign up for a free 14-day trial today.
