Thomas Sobolik

John Kendall
AWS Fargate is a serverless compute engine that allows you to deploy containerized applications with services such as Amazon ECS without needing to manage the underlying virtual machines. Deploying with Fargate removes operational overhead and lowers costs by enabling your infrastructure to dynamically scale to meet demand. We are proud to partner with AWS for its launch of support for AWS Fargate on Windows containers. You can now run Windows-based applications on containers in the cloud with the added benefits of serverless container deployments—and use Datadog to get comprehensive visibility into your applications’ health and performance. In this post, we’ll look at how you can use Datadog to collect metrics, traces, and logs from your containerized Windows apps deployed using Fargate and ECS.
Collect performance metrics
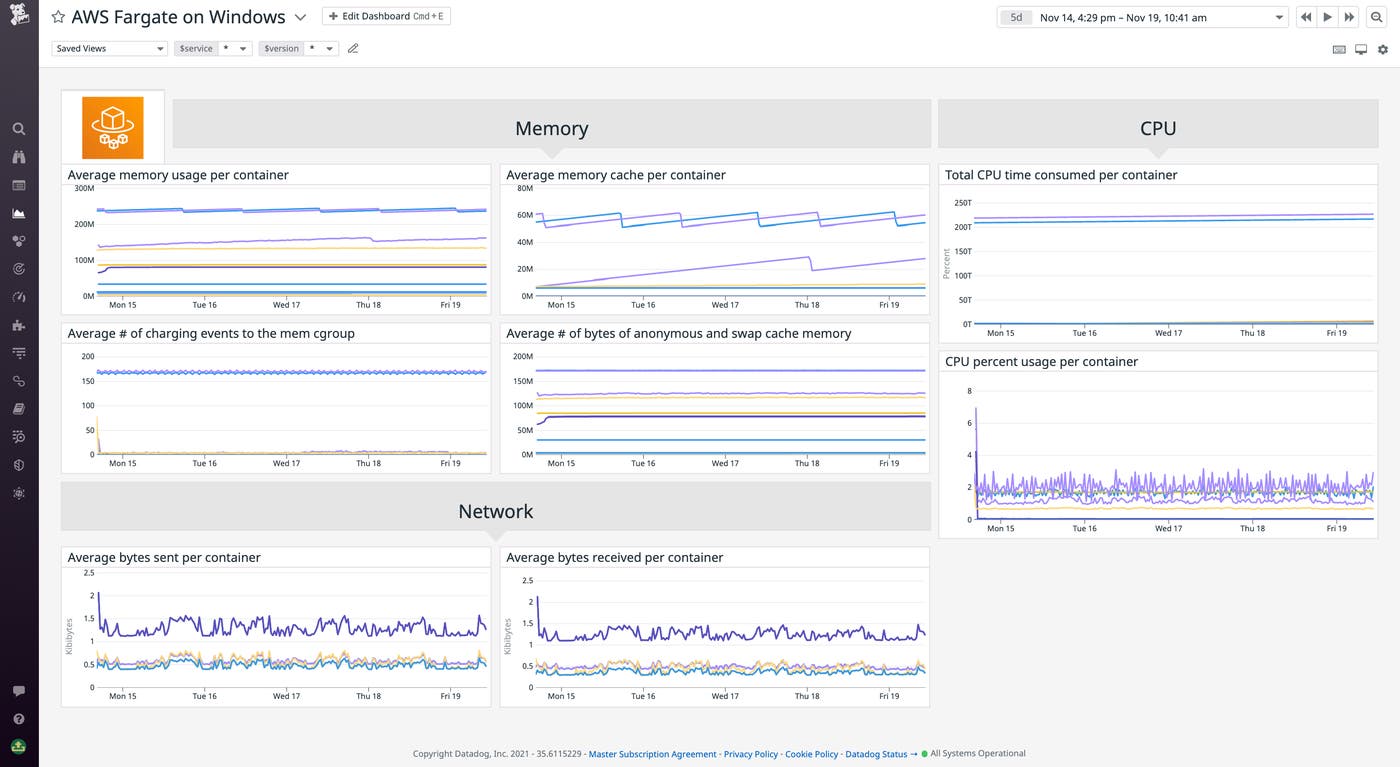
By enabling Datadog’s AWS integration, you can start ingesting Fargate metrics from Amazon CloudWatch in just a few clicks. You can use our out-of-the-box AWS Fargate dashboard to see key resource and network metrics from your containers, including CPU and memory usage, disk I/O, network traffic volume and errors, and more. You can use the dashboard to track the high-level health and performance of your serverless deployments at a glance.
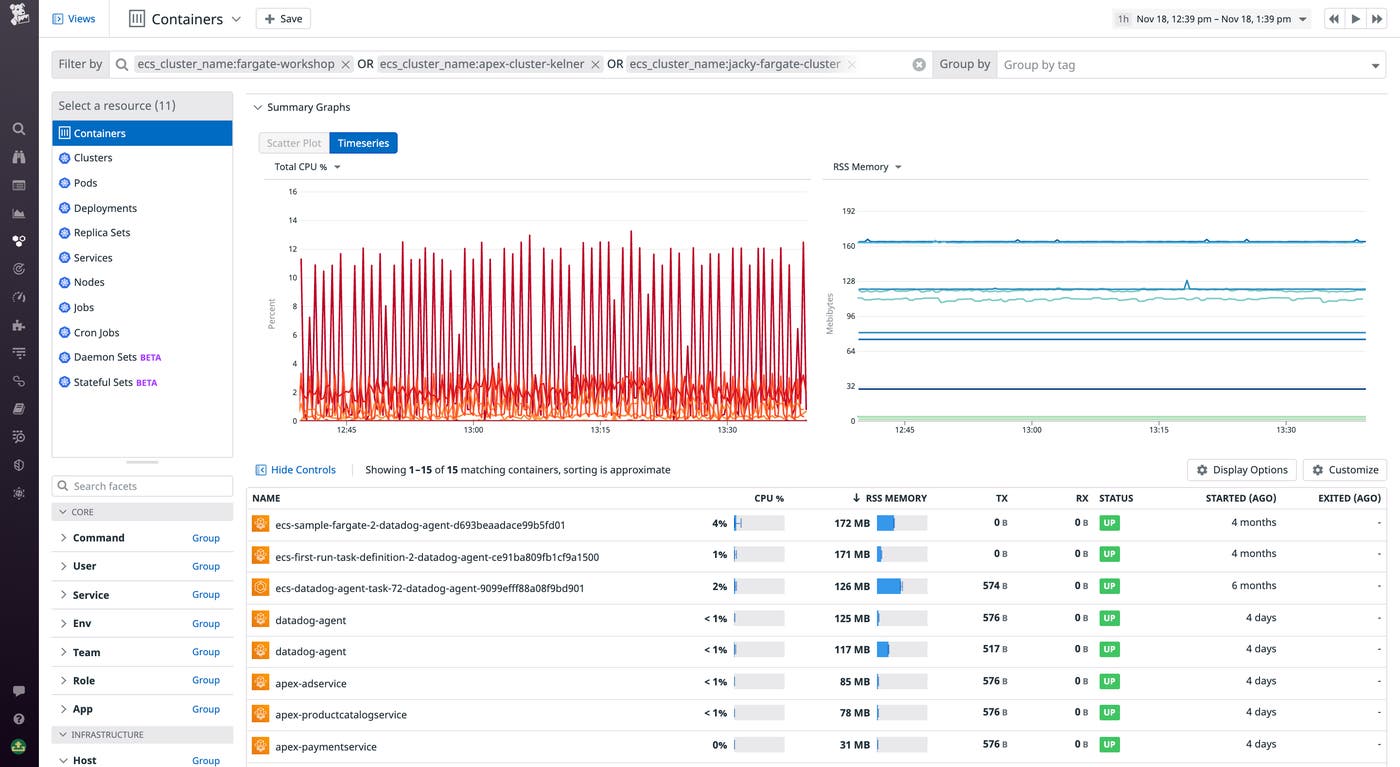
For more granular data, you can deploy the containerized Datadog Agent to your ECS tasks. Deploying the Agent allows you to view real-time resource metrics in the Live Containers view. You can easily filter and sort your containers by using AWS’s built-in tags—including region, task_name, and ecs_cluster—to focus your investigation. Using the Live Containers view, you can quickly see whether your deployments are provisioned properly. By setting up unified service tagging, you can also filter your containers by service and pivot to telemetry from other parts of Datadog, including traces and logs.
Collect traces and logs for more insights
In addition to monitoring your Fargate deployments’ underlying infrastructure, you can use Datadog APM to monitor the health and performance of your applications. APM enables you to instrument your apps and collect distributed request traces using out-of-the-box tracing libraries for .NET Framework/Core, Python, Node.js, and more. Using APM’s distributed trace flame graphs, you can view the end-to-end execution of your code across containerized workloads. Examining traces enables you to quickly surface errors and latency and understand which parts of your code are causing degraded performance.
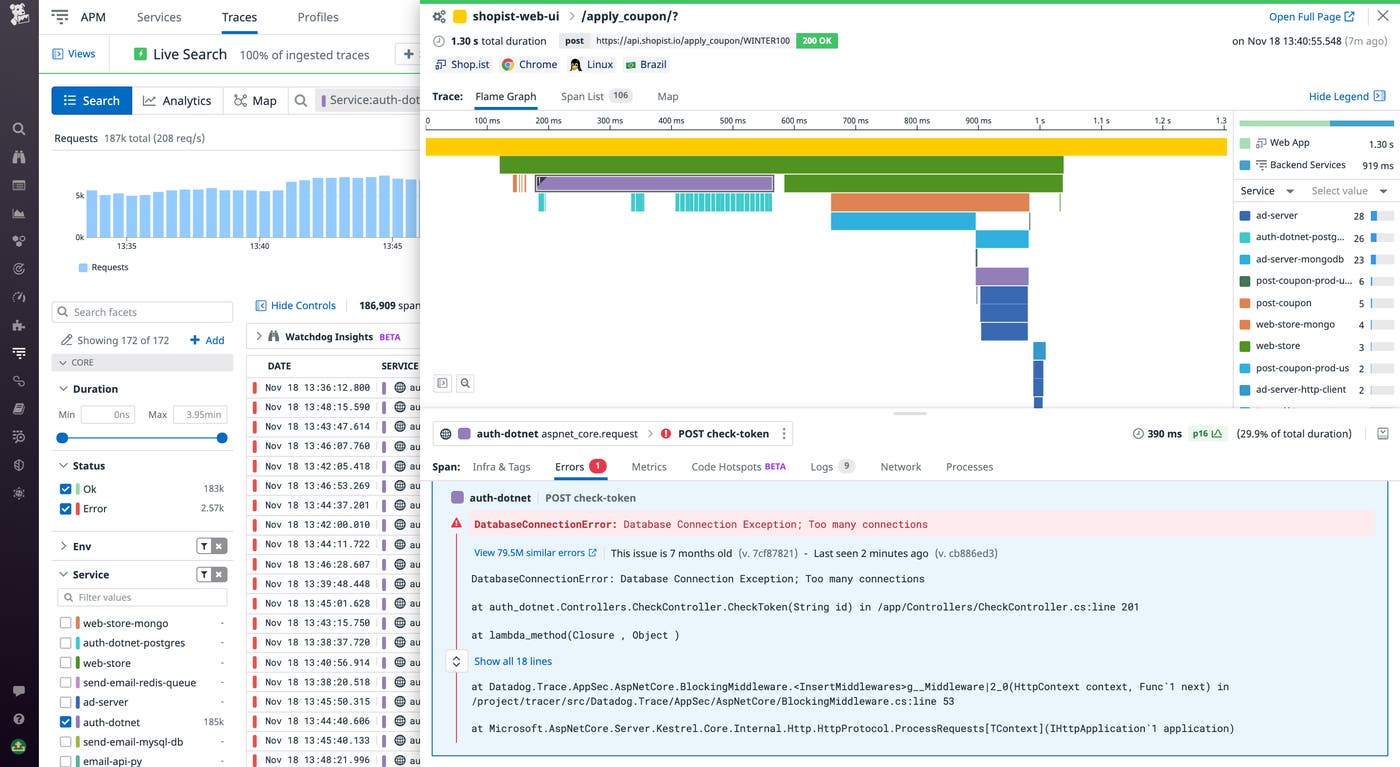
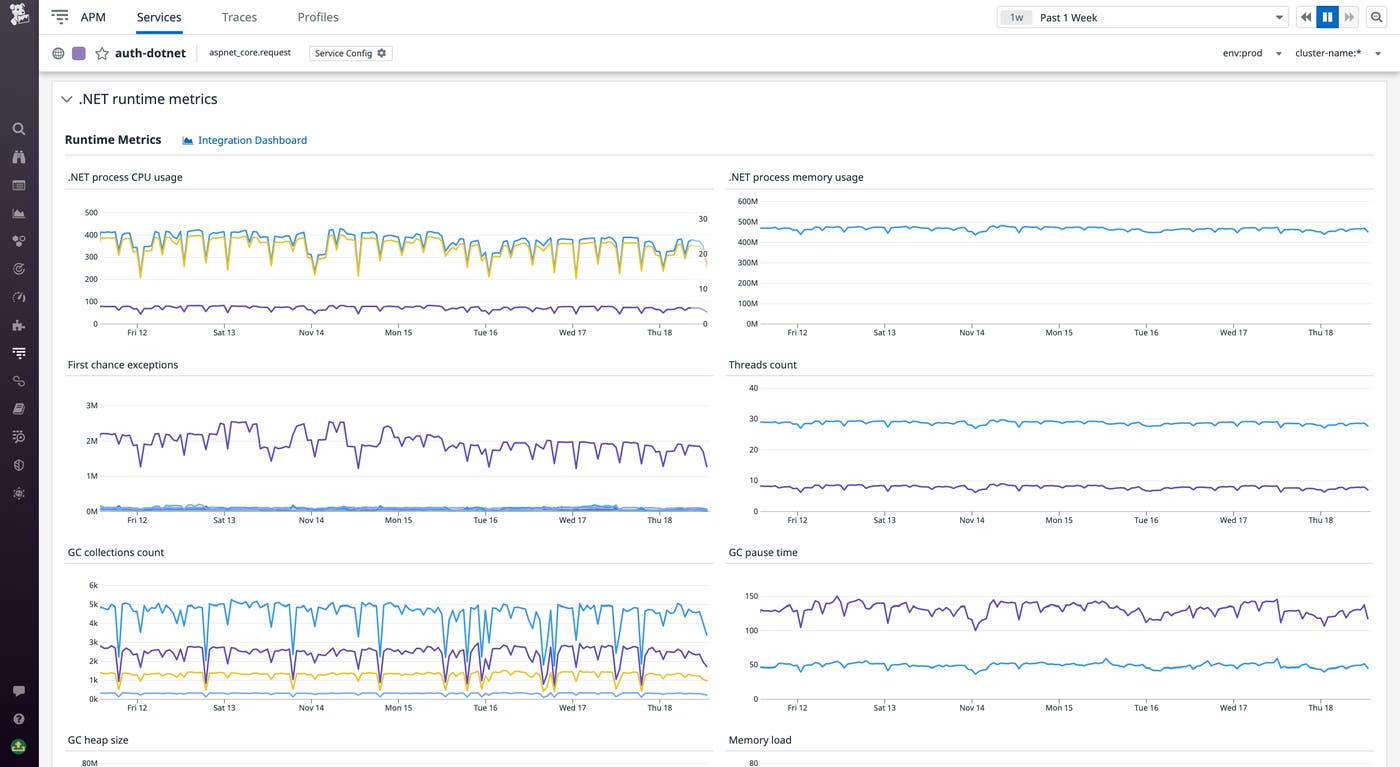
In the APM Services page, you can get a high-level overview of requests, errors, and latency metrics at the service level. Using built-in tags such as task, task family, service, and cluster, you can filter your APM data to make apples-to-apples comparisons. For example, as you migrate your ECS deployment from EC2 instances to Fargate, you might want to provide unique task names for the new and old tasks in order to validate that the new version hasn’t introduced errors or performance regressions. Then, you can drill into individual services to view deployment stats, metrics for specific API endpoints, .NET runtime metrics, and more.
Start monitoring Fargate on Windows
With Datadog’s native support for AWS Fargate on Windows, you can now easily leverage Datadog infrastructure monitoring, APM, and more to monitor the health and performance of all your containerized Windows apps, no matter how you deploy them. To learn more about deploying your Windows applications with Fargate and ECS, head to the AWS blog. For more information on collecting Fargate and ECS monitoring data in Datadog, see our documentation and blog post. Or, if you’re brand new to Datadog, get started with a 14-day free trial.


