Kassen Qian

Maxim Brown
CI/CD services such as AWS CodePipeline enable developers to automate and accelerate the process of building, testing, and deploying code. But with the speed, scale, and complexity of the modern software development life cycle, even small performance regressions or increases in failure rates in your CI system can quickly snowball, slowing or even halting releases and causing cost overruns. End-to-end visibility into your CI pipelines is vital for quickly identifying and triaging problems early before they affect your teams or customers.
Datadog already enables you to get full performance and security visibility across your AWS infrastructure. In this post, we’ll look at how Datadog’s new AWS CodePipeline integration for CI Pipeline Visibility enables you to shift your AWS monitoring further left and:
- Proactively monitor and improve the health and performance of your pipelines
- Drill into individual pipelines to locate and identify errors in your stages
- Create monitors that alert the relevant teams to pipeline failures
Monitor the health and performance of your pipelines
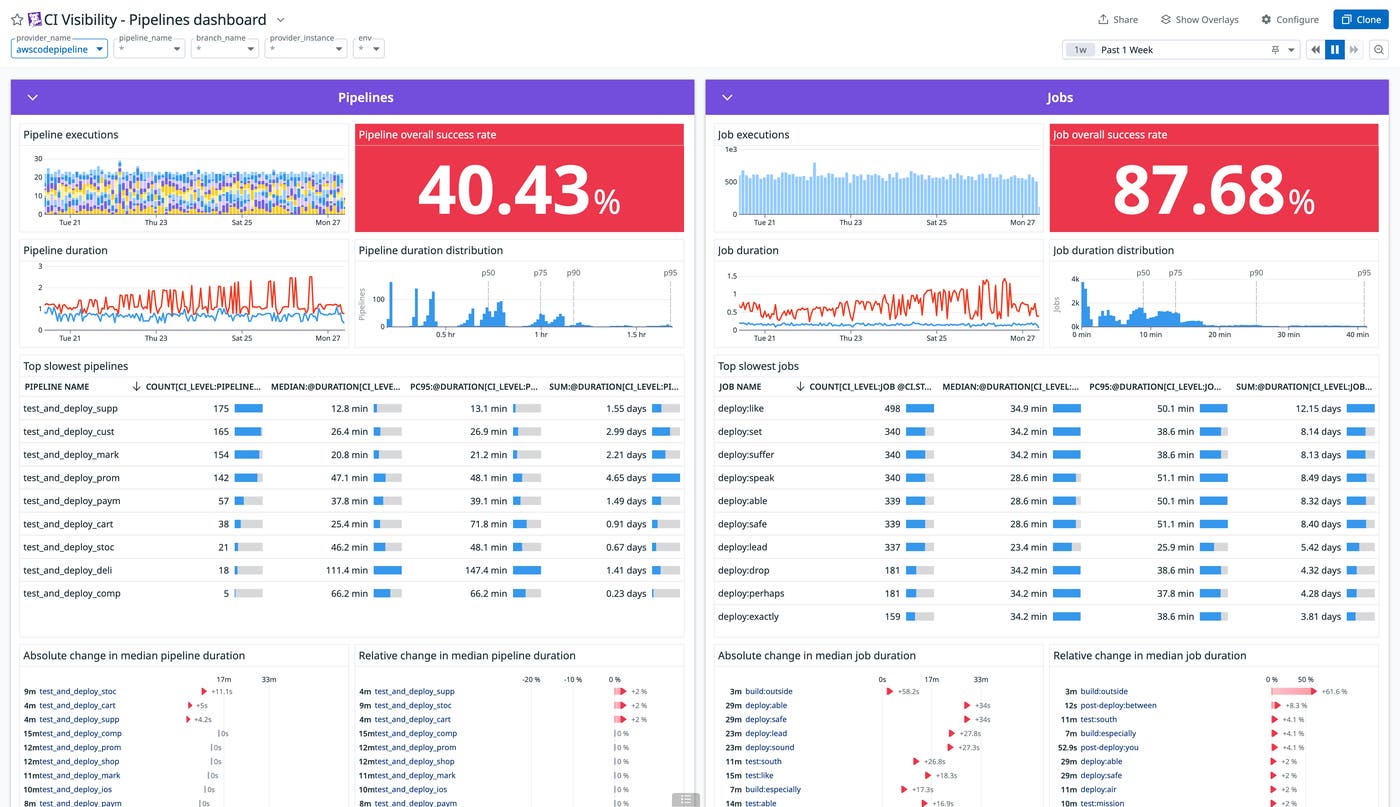
Large development teams may deploy dozens or even hundreds of code changes per day. It’s important to be able to monitor overall performance across the relevant CI pipelines and surface problems like rising duration or error rates, or to identify outliers that you might need to investigate. Once you’ve configured Datadog’s AWS CodePipeline integration for CI Pipeline Visibility, you can use the customizable out-of-the-box CI Pipeline Visibility dashboard to get a bird’s-eye view of your CI system. You can easily filter the dashboard to focus on CI providers (such as AWS CodePipeline) or specific pipelines, branches, or deployment environments. Summaries of your slowest or most failure-prone pipelines, stages, and actions enable you to quickly see where problems are and focus troubleshooting efforts.
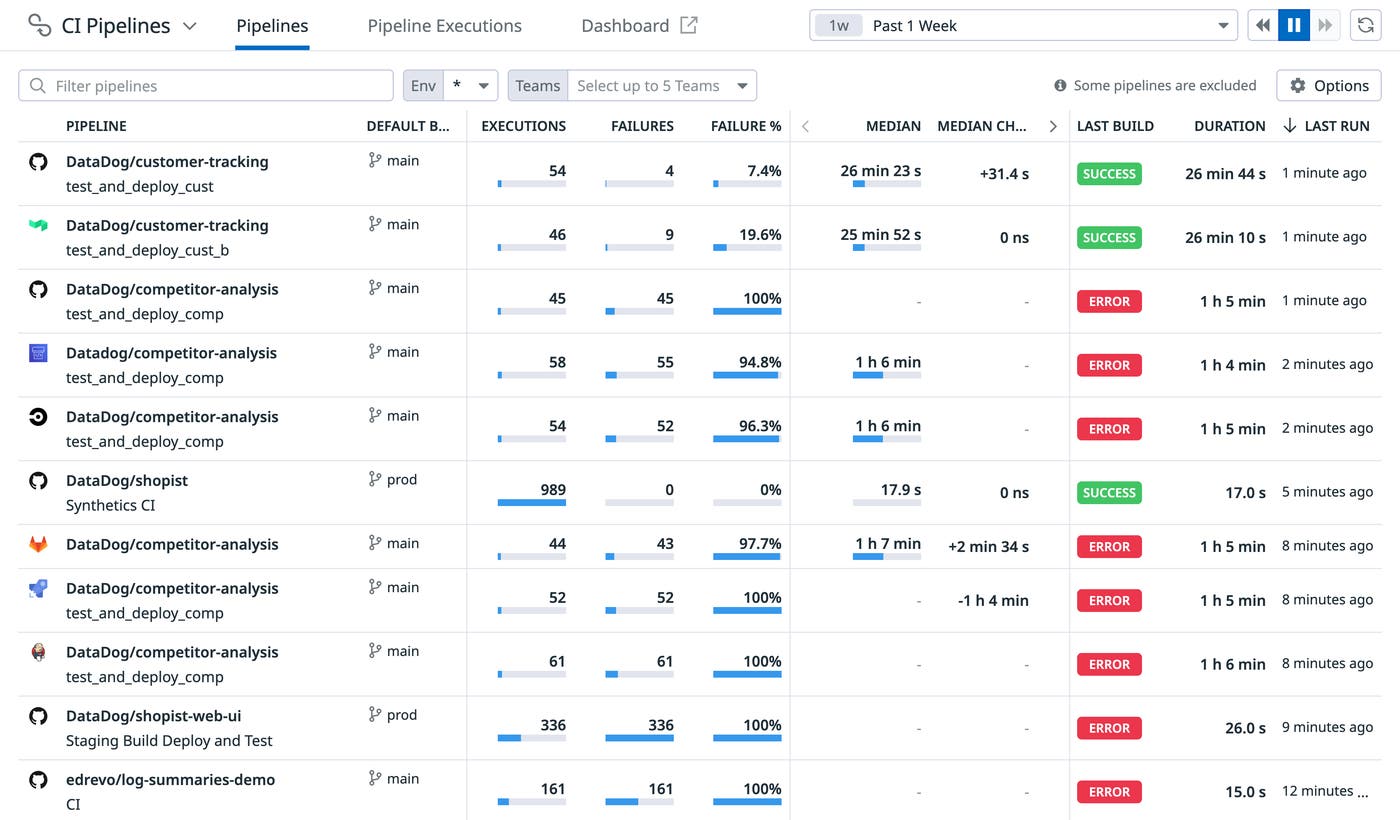
Similarly, the CI Pipelines list aggregates all of your instrumented pipelines. Key metrics for duration, executions, and failures enable you to see the performance and reliability of your AWS pipelines and compare them to the rest of your CI system. Sorting the list makes it easy to identify which pipelines are slowest, most active, or least successful across providers.
Drill into your pipelines
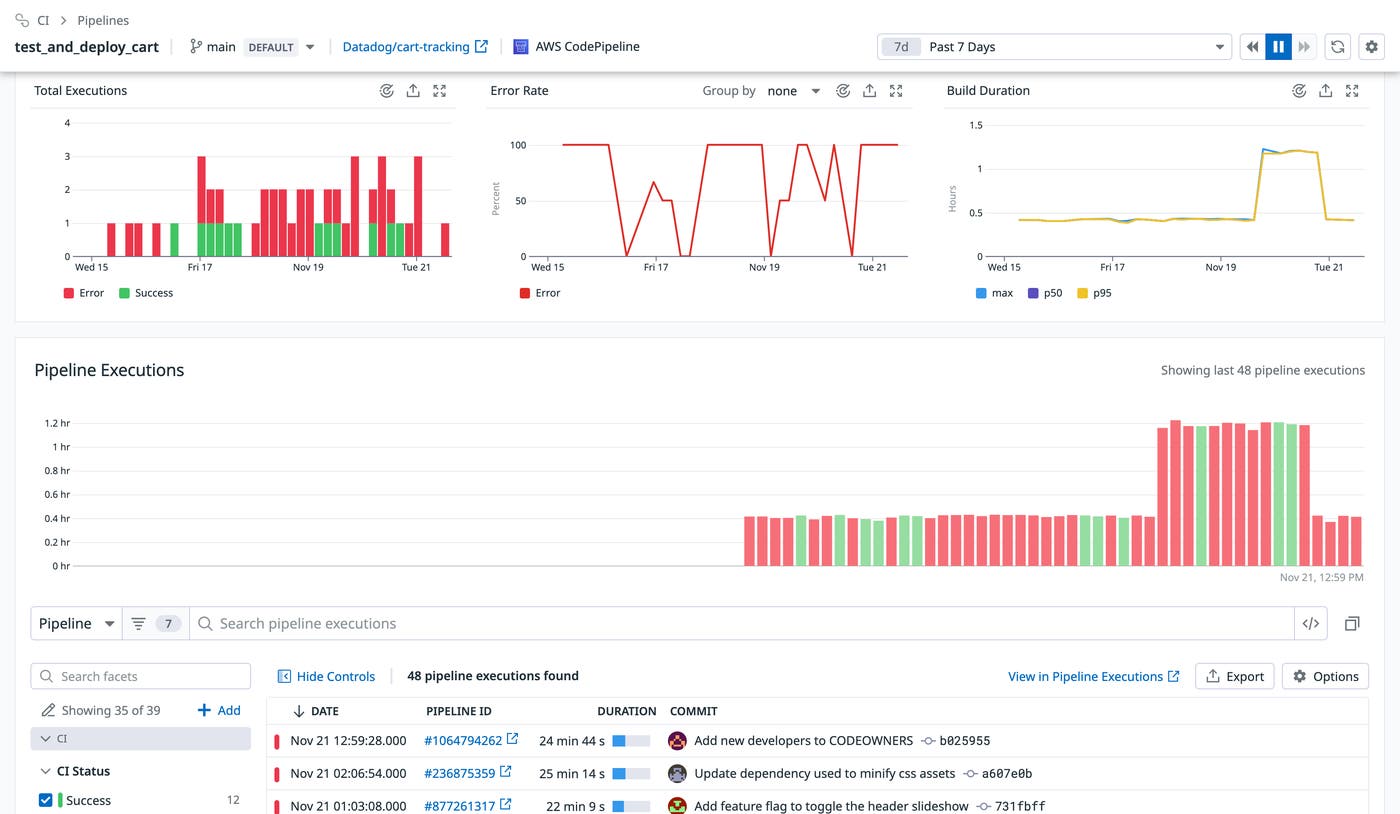
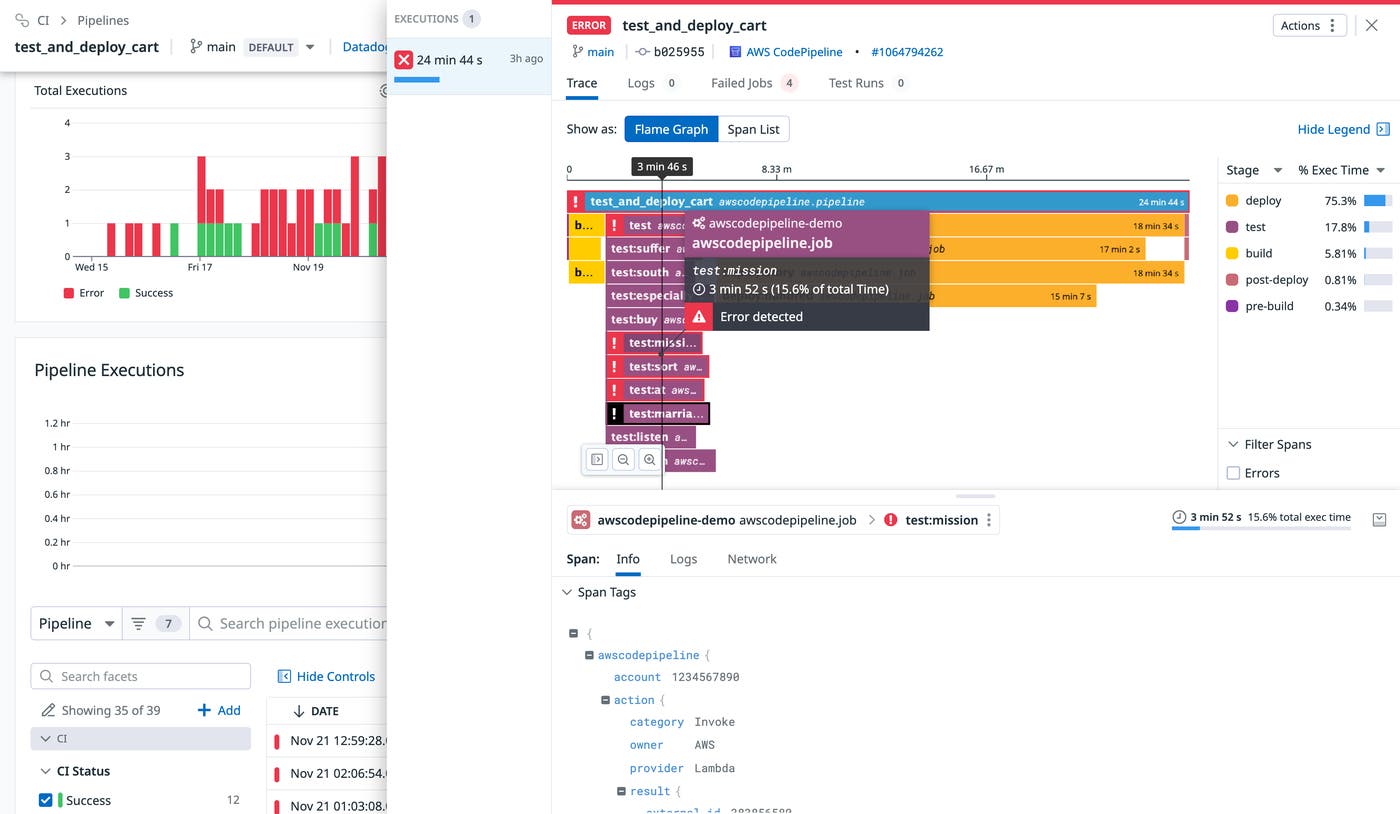
If you identify a pipeline that is particularly slow, or that fails frequently, you can drill into it to investigate the possible cause. Pipeline overview pages visualize key metrics, including breakdowns of how many times the pipeline has run over time and how many of those executions experienced errors.
By selecting a specific execution, you can access a flame graph that breaks the pipeline execution down into its constituent stages and actions, making it easy to understand which ones are contributing the most to end-to-end execution duration, as well as which experienced errors. This enables you to identify where exactly your pipelines are breaking so you can quickly fix them and continue to push code.
Route alerts to the relevant teams
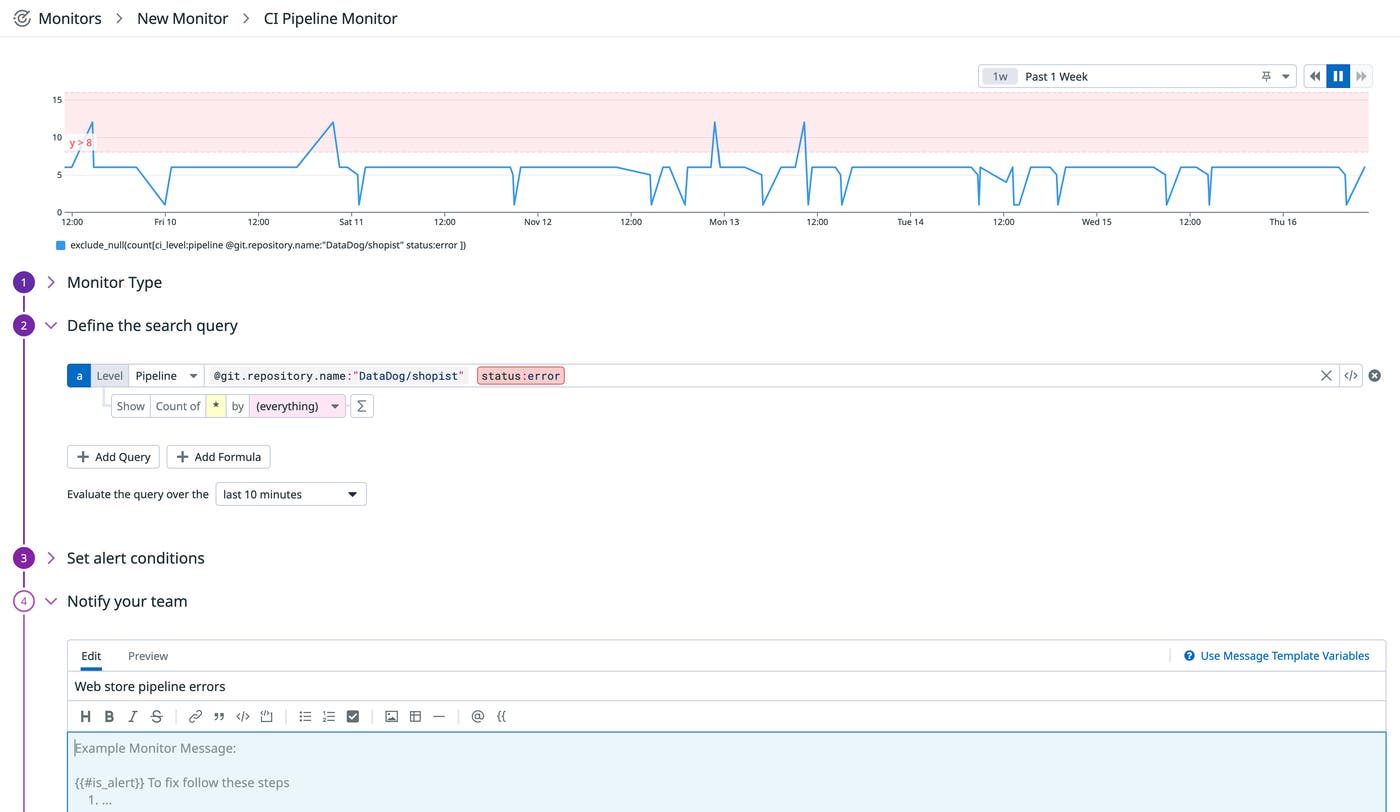
Addressing broken pipelines as soon as possible is key to maintaining a consistent release schedule. You can set CI Pipeline monitors to alert you to performance regressions or increased error rates at the pipeline, stage, or action level. Configuring your monitors to route alerts to the teams or individuals who own the pipelines will help ensure that the relevant people will be able to respond more quickly.
Datadog + AWS CodePipeline
CI/CD services like AWS CodePipeline have become vital components of the modern SDLC, enabling teams to release code and new features to customers quickly and more frequently. With Datadog, you can seamlessly monitor your pipelines and spot issues in your development workflows before they impact your entire development team, meaning your org’s software development processes can become more efficient in delivering business value. By integrating AWS CodePipeline with Datadog, you can monitor the health and performance of your CI/CD systems alongside telemetry from the rest of your AWS services from one unified platform. See our documentation to get started with Datadog’s AWS CodePipeline integration for CI Pipeline Visibility. If you’re not using Datadog, sign up for a 14-day free trial.

