

Microsoft recently released Azure Kubernetes Service (AKS), a managed service that helps you deploy, run, and scale Kubernetes clusters. We’re pleased to share that Datadog’s integrations with Kubernetes and Azure Monitor can give you comprehensive visibility into your AKS infrastructure with no additional configuration.
How AKS works
AKS helps you automate the provisioning, maintenance, and scaling of Kubernetes clusters. AKS manages your cluster’s control plane and launches other Azure resources to support your containerized applications, including Azure VM nodes, persistent storage volumes, and virtual network traffic routing. When you scale or upgrade your cluster, AKS will manage the process to ensure uptime. And if you group your nodes into one or more availability sets, Azure will ensure that at least one node in each set remains accessible in the case of failure.
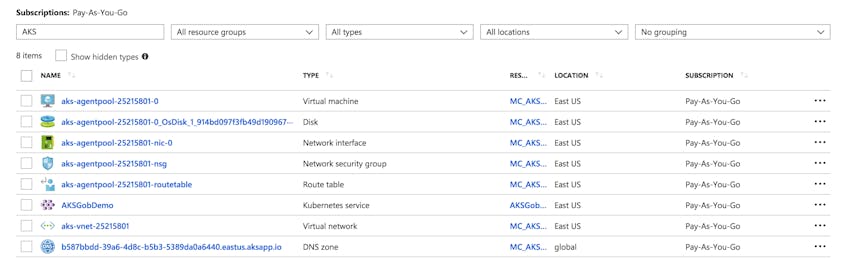
When you create a new AKS cluster, you’ll be prompted to either add it to an existing resource group (a logical unit for deploying, updating, and destroying Azure resources) or create a new one. Then you’ll name your cluster, indicate the type and number of virtual machines to include, and use the Azure CLI to merge your AKS details into your kubeconfig files. Once your cluster is running, you can apply manifests and perform management tasks with kubectl or in the Kubernetes Dashboard interface.
Monitor AKS with Datadog
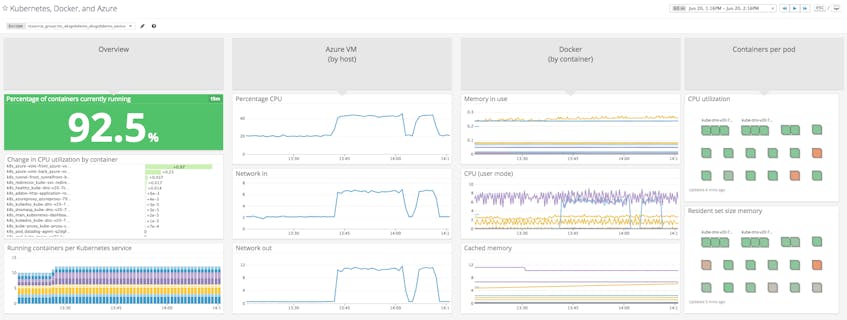
Datadog can help you get full visibility into your AKS deployment by collecting metrics, distributed request traces, and logs from Kubernetes, Azure, and every service running in your container infrastructure. To start monitoring AKS with Datadog, all you need to do is configure the integrations for Kubernetes and Azure. Deploy the containerized Datadog Agent as a DaemonSet within your AKS cluster using the YAML manifest we provide. You can also collect logs from your Kubernetes cluster by adding only a few more lines to your manifest. Then connect Datadog with Azure from the Azure portal and Datadog UI.
The Datadog Agent’s Autodiscovery feature keeps track of which services and pods you’re running in AKS, so that it knows exactly which checks to run—even as your containers spin up, shut down, and move across nodes.
Automatic tagging
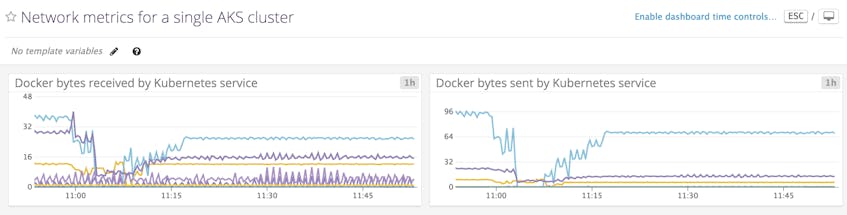
With Datadog, you can monitor your AKS cluster in the same place as more than 750 other technologies. Datadog will automatically pull in tags from Azure, Docker, and Kubernetes, including resource group, Kubernetes pod, and Docker image. You can use tags to view data from your AKS cluster using any attributes that are relevant to your infrastructure. In the example above, we’re comparing the network traffic to and from the containers in our cluster, filtering for the appropriate Azure resource group and aggregating by Kubernetes service name.
You can also add container maps to your dashboards to get a high-level overview of your containers’ health and resource consumption, grouped by tags (e.g., pods, availability zones, resource groups, and so on). As your AKS cluster scales up or down in response to user actions or changes in demand, container maps will update automatically to reflect those changes in real time.
Live containers and processes
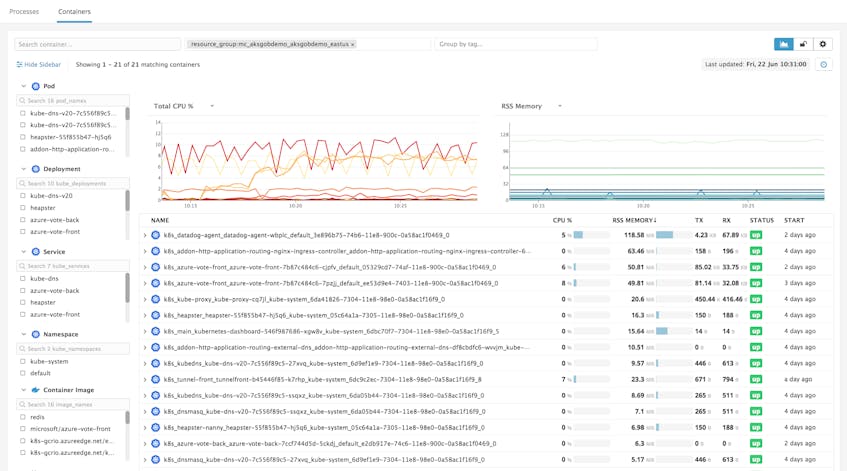
If you’re running hundreds or even thousands of containers in AKS, Datadog’s Live Container view can help you quickly sift through all the operational data flowing in from your deployment. The Live Container view provides real-time insights into the health, resource consumption, and status of every container in your AKS cluster. Resource metrics are graphed at two-second resolution, making it easy to identify containers that use, for example, excessive CPU or memory.
You can filter by facets and tags to inspect specific areas of your AKS cluster. In this example, we’re using the resource_group tag that corresponds to a particular AKS cluster, and then drilling down further by using the Kubernetes tag kube_service to view only containers that are running a front-end service within our application.
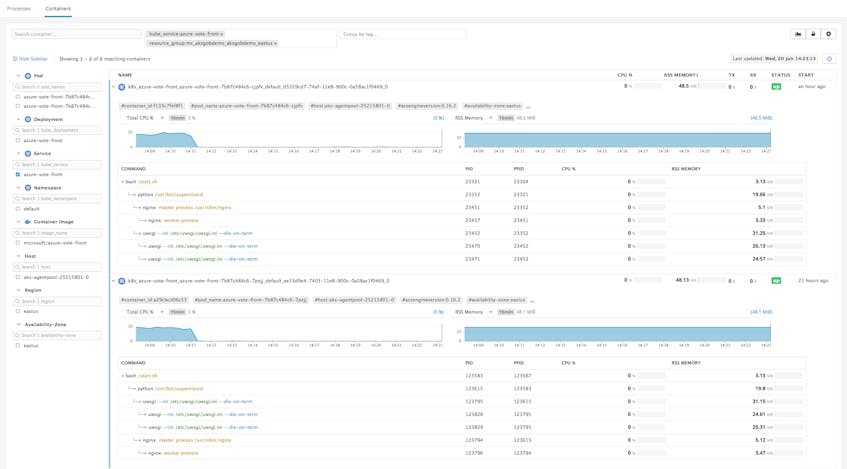
And if you’ve configured Live Process Monitoring, you can expand each container in the Live Container view to see the hierarchy of running processes and sub-processes, and how resource-intensive they are.
Where Azure goes, so goes Datadog
Datadog is proud to support more than 60 Azure services, including AKS. If you don’t yet have a Datadog account, you can get full visibility into your AKS clusters with a 14-day free trial.
