
Mallory Mooney
In Part 2 of this series, we showed you how to collect key Tomcat performance metrics and logs with open source tools. These tools are useful for quickly viewing health and performance data from Tomcat, but don’t provide much context for how those metrics and logs relate to other applications or systems within your infrastructure.
In this post, we will look at how Datadog provides more comprehensive monitoring for Tomcat and other technologies in your infrastructure, by connecting events, logs, and metrics together in one fully integrated platform. And, because Datadog integrates with more than 1,000 technologies, you can track long-term performance trends and patterns across all systems in your infrastructure, not just your Tomcat server. You can also get deeper visibility into Tomcat applications by collecting, processing, and analyzing your logs.
In this post, we will walk through how to:
- set up Datadog’s Tomcat integration
- explore metrics in customizable dashboards
- process and analyze Tomcat logs
- create alerts to detect Tomcat health and performance issues
Note that this guide includes commands for Linux hosts, so you may need to consult the Agent usage docs if you are using another operating system.
Set up Datadog’s Tomcat integration
1. Install the Datadog Agent
Datadog collects Tomcat and JVM metrics exposed by JMX via the JMXFetch plugin. This plugin is built into Datadog’s Java integrations, including the Tomcat integration. To begin collecting this data, you will need to install the Datadog Agent on your host. The Agent is open source software that forwards metrics, events, and logs from your hosts to Datadog. You can install the Agent by running the following command on your Tomcat host:
DD_API_KEY=<API_KEY> DD_AGENT_MAJOR_VERSION=7 bash -c "$(curl -L https://raw.githubusercontent.com/DataDog/datadog-agent/master/cmd/agent/install_script.sh)"Note that your Datadog API key is automatically included on the Agent installation page of your account, but you can also access your API key here. This page includes platform-specific instructions for installing version 6 of the Agent. Once you’ve installed the Agent, you can configure it to start collecting metrics and logs. But first, make sure that you’ve enabled remote JMX connections for your Tomcat server (refer to Part 2 for instructions).
2. Enable log collection in the Agent
The Datadog Agent uses YAML files to set up its integrations, as well as for its own configuration. To configure the Agent to collect logs, set the logs_enabled parameter to true in the Agent’s configuration file (datadog.yaml).
# Logs agent# Logs agent is disabled by defaultlogs_enabled: trueThe location of this file varies across platforms, but it is normally located in the /etc/datadog-agent/ directory on Linux systems.
3. Configure the Agent to collect Tomcat metrics and logs
Next, navigate to the Tomcat subdirectory (/etc/datadog-agent/conf.d/tomcat.d/), which includes two configuration files: metrics.yaml and conf.yaml.example.
The metrics.yaml file specifies all of the Tomcat metrics that Datadog collects by default. This includes all of the key metrics we discussed in Part 1.
The conf.yaml.example file provides a template for configuring the Agent to collect Tomcat metrics and logs. Copy this file and rename it conf.yaml within the same /etc/datadog-agent/conf.d/tomcat.d/ directory. Open the conf.yaml file and make two updates so that the Agent can start collecting Tomcat metrics and logs. First, define the instance host and port, which should match the host and port you used for your JMX remote connection:
instances: - host: localhost port: 9991You can also use the host name or IP address of the Tomcat server instead of localhost if you installed the Agent on a different server.
In the logs section, specify the paths to your Tomcat server and access logs. Because Tomcat creates a new log file every day by default (e.g., localhost_access_log.2018-11-03.txt), you can use wildcards to easily detect and start collecting data from new log files:
## Log Section (Available for Agent >=6.0)logs: - type: file path: /opt/tomcat/logs/localhost_access_log*.txt source: tomcat service: javabox-sample-app - type: file path: /opt/tomcat/logs/catalina*.log source: tomcat service: javabox-sample-appThe wildcard character (*) ensures that the Datadog Agent pulls in every log you specify, regardless of the date. Make sure to set the source attribute to tomcat in order to trigger the integration pipeline, which will automatically extract key facets from your Tomcat logs. If you’re using Datadog APM to monitor an application that runs Tomcat, you can specify the same service to connect your Tomcat logs to related APM metrics and request traces.
Once you’ve updated and saved these configurations, restart the Agent with the following command:
sudo service datadog-agent restartThe Agent will immediately begin forwarding Tomcat and JVM metrics and logs to Datadog.
4. Enable trace collection for application performance monitoring
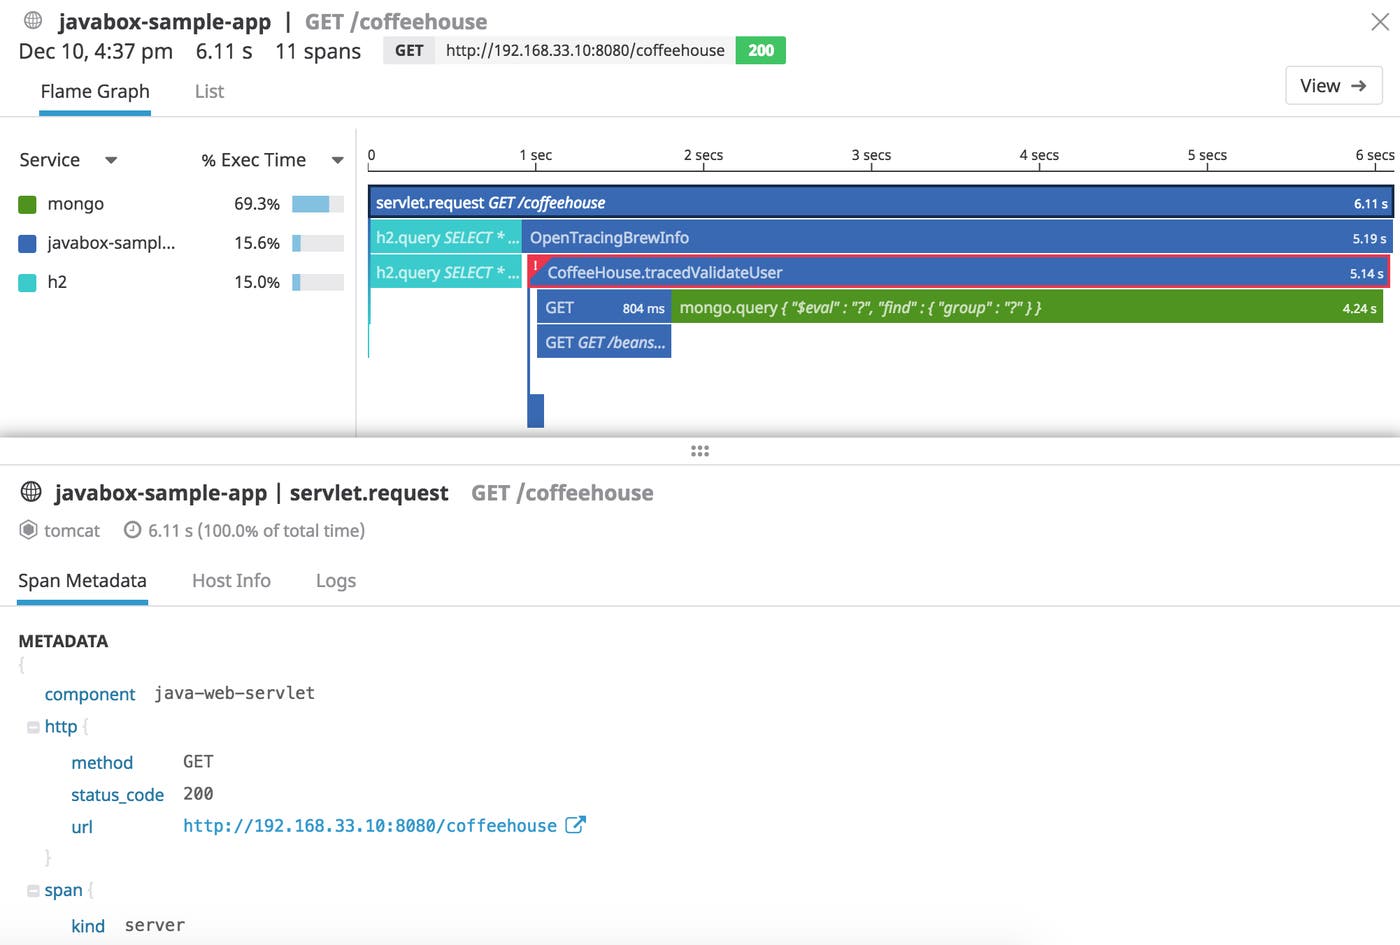
Datadog APM includes support for Java applications, and automatically traces requests from Tomcat. APM gives you end-to-end visibility with distributed tracing, detailed performance dashboards, and service breakdowns. To start collecting traces for Tomcat, download the dd-java-agent.jar file onto your server:
wget -O dd-java-agent.jar 'https://dtdg.co/latest-java-tracer'You can then begin tracing your application with the following JVM argument:
-javaagent:/path/to/the/dd-java-agent.jarThis enables you to explore your services in Datadog, analyze trace metrics, and view traces and spans for your services.
Explore Tomcat and JVM metrics in dashboards
Datadog provides an out-of-the-box dashboard that you can clone, and use as a template to display the key Tomcat and JVM metrics we discussed in Part 1, including Tomcat threads, request processing time, and JVM memory usage.
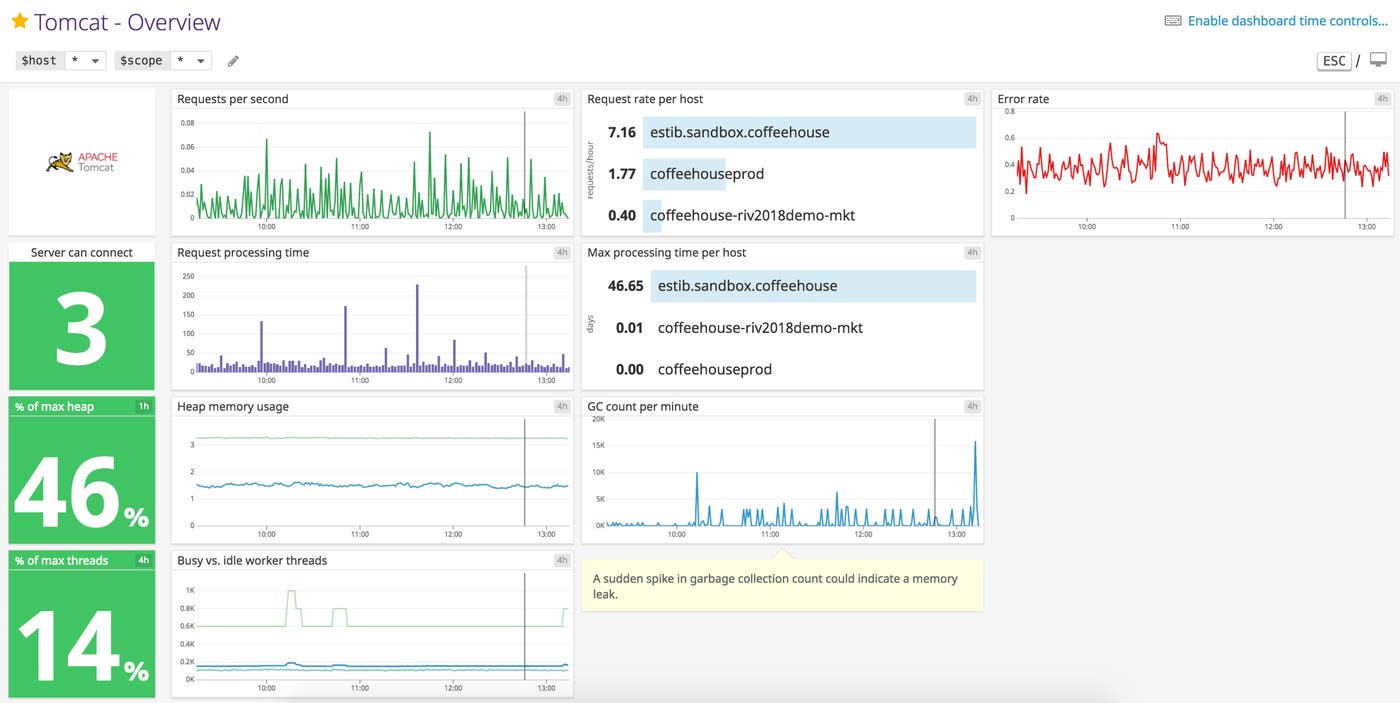
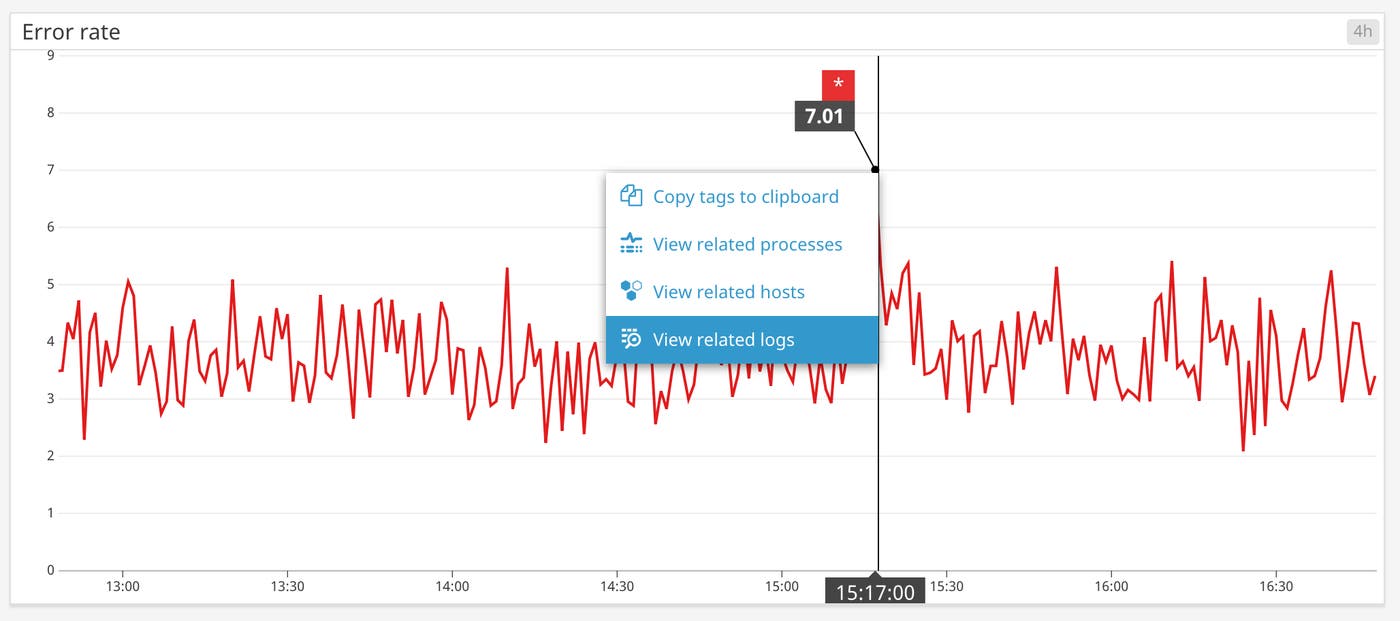
This dashboard provides a high-level view of Tomcat, but you can also drill down and jump to other sources of monitoring data for more effective troubleshooting. For example, if you notice a spike in the error rate, you can investigate the root cause of the issue by clicking on the graph, and navigating to logs that were collected from the Tomcat server(s) around the same time frame.
Monitor Tomcat logs
Tomcat logs can help you identify critical errors related to your JVM. They also give you more fine-grained insights into the status and processing time of requests hitting your server. Now that we’ve configured the Agent to collect these logs, we will show you how Datadog automatically parses them with its built-in integration pipeline, and how you can customize this pipeline to extract data from custom log formats. We’ll also show you how to use log analytics to explore and dig deeper into all the data you’re collecting from your Tomcat logs.
Tomcat integration log pipeline
The Tomcat log pipeline uses processors to extract information from logs into a more structured format.

Processing Tomcat access logs
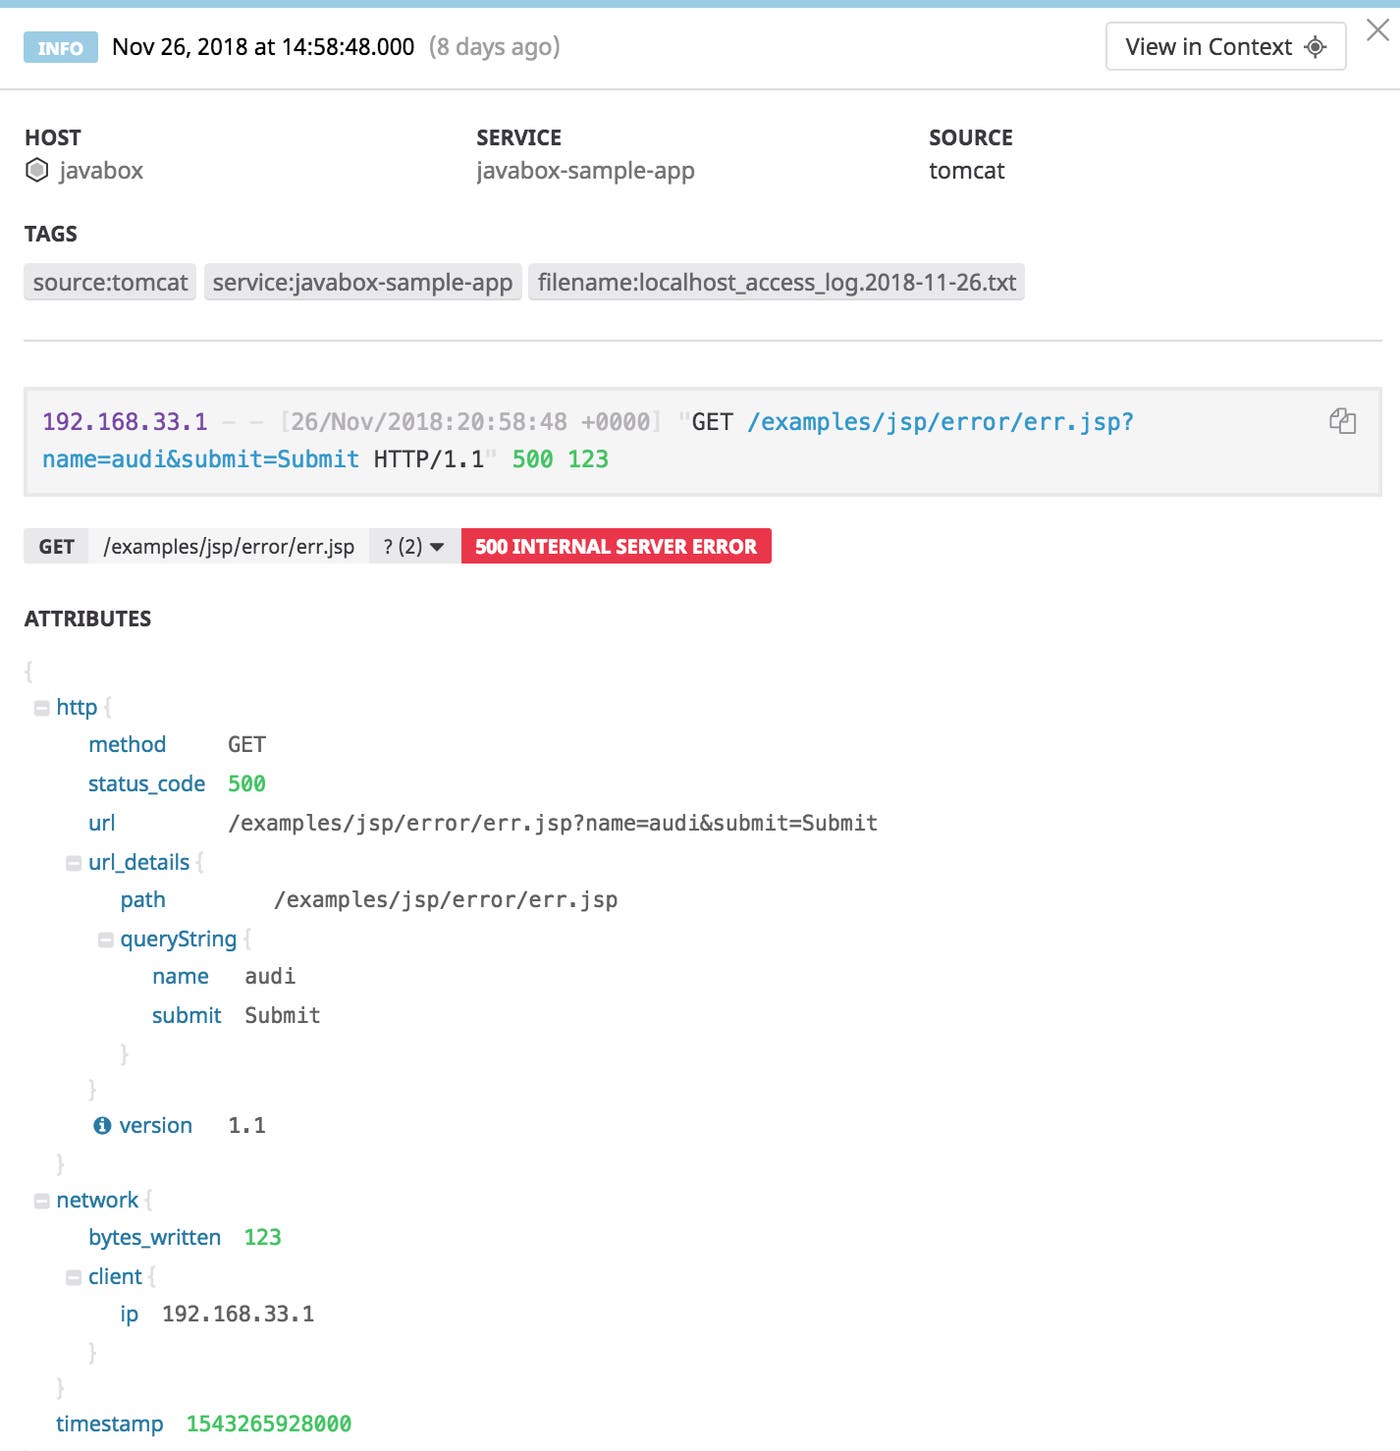
The Tomcat logging integration pipeline automatically processes Tomcat access logs that use the standard %h %l %u %t "%r" %s %b valve pattern, and maps them to pre-defined log attributes:
| Valve pattern | Description | Log attribute |
|---|---|---|
%h | the IP address of the client sending the request | client.ip |
%l | the username from the identd service | http.ident |
%u | the user id of the authenticated user requesting the page (if HTTP authentication is used) | http.useragent |
%t | the request timestamp | timestamp |
%r | the request method and URL path | http.method, http.url, http.url_details |
%s | the HTTP status code | http.status_code |
%b | the number of bytes returned to the client | network.bytes_written |
This means that access logs using that valve pattern will get processed into the following log, accessible in the Log Explorer:
Customize your Tomcat logs with pipelines
Integration log pipelines are read-only, but you can clone them to create your own pipelines in order to process data from other types of log formats, or to further customize how your logs are structured in the Log Explorer.
If you’ve added the request processing time pattern code (%D) to your access log valve pattern (as discussed in Part 2), you can adjust your pipeline to begin processing this data from your access logs. Navigate to the custom Tomcat pipeline you created earlier, and click on the “Grok Parser: Parsing Tomcat logs” processor to start editing it. This processor contains a list of parsing rules and helper rules (under “Advanced Settings”).
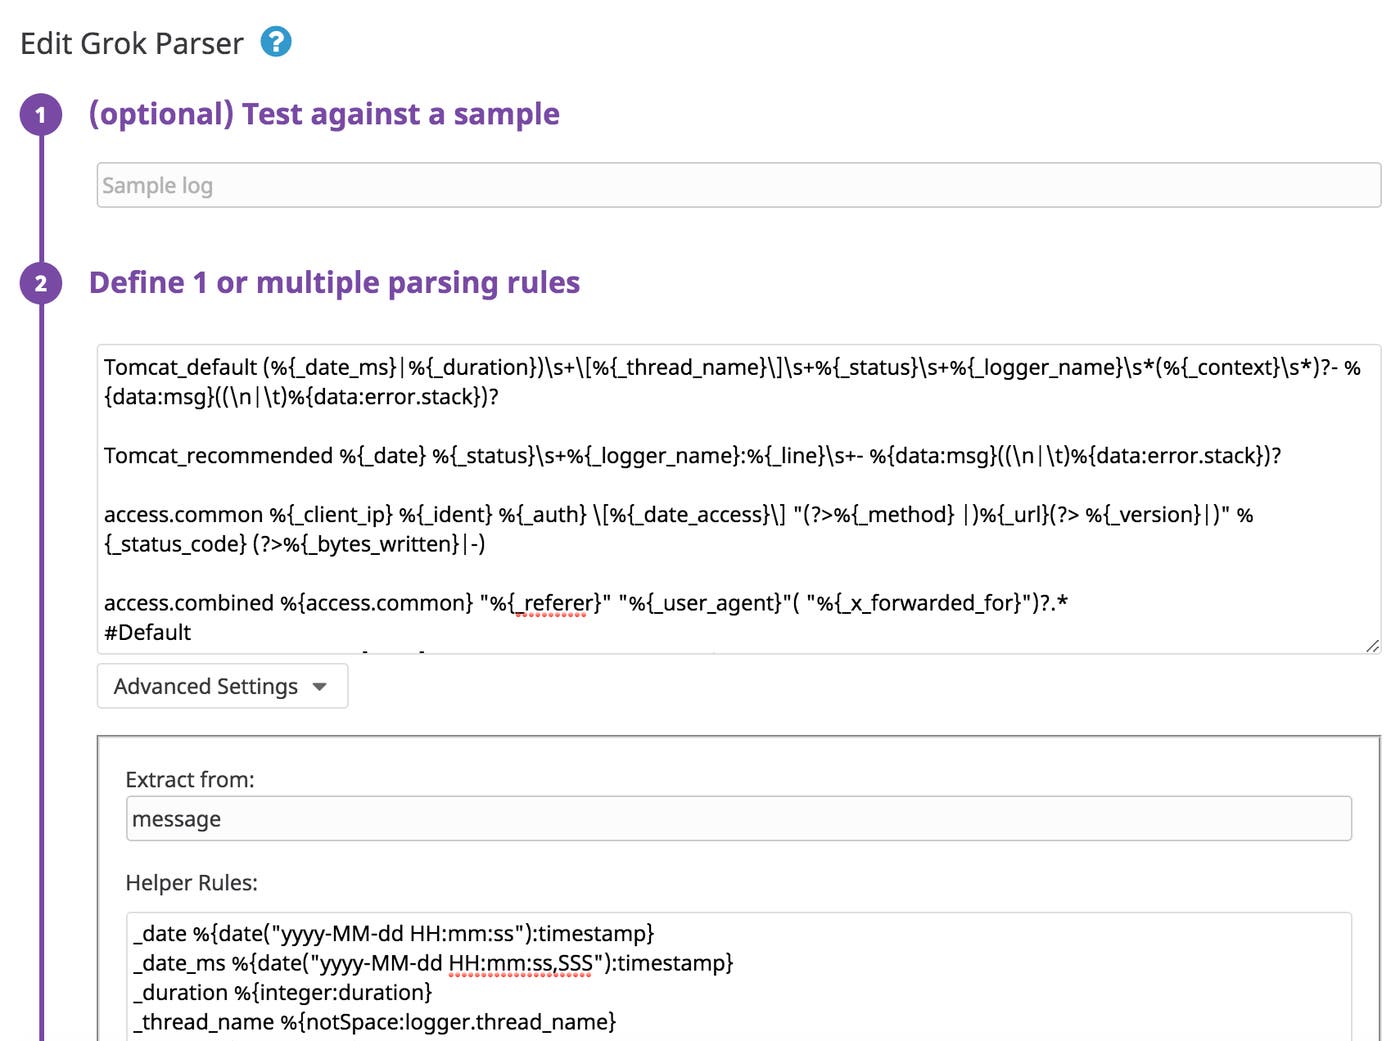
In order to include the new pattern code, you need to add %{_duration} to end of the access.common parsing rule:
access.common %{_client_ip} %{_ident} %{_auth} \[%{_date_access}\] "(?>%{_method} |)%{_url}(?> %{_version}|)" %{_status_code} (?>%{_bytes_written}|-) %{_duration}This will allow the processor to automatically parse each access log for the value of the request processing time. Datadog reserves this attribute for use with APM, which measures duration in nanoseconds. If you’re using APM, you can easily update your processor to convert the request processing time from milliseconds to nanoseconds by revising the duration helper rule in the “Advanced Settings” section of the processor:
_duration %{integer:duration:scale(1000000)}Once you save those changes, Datadog will immediately begin processing new access logs, and include a new duration attribute that shows the request processing time in nanoseconds.
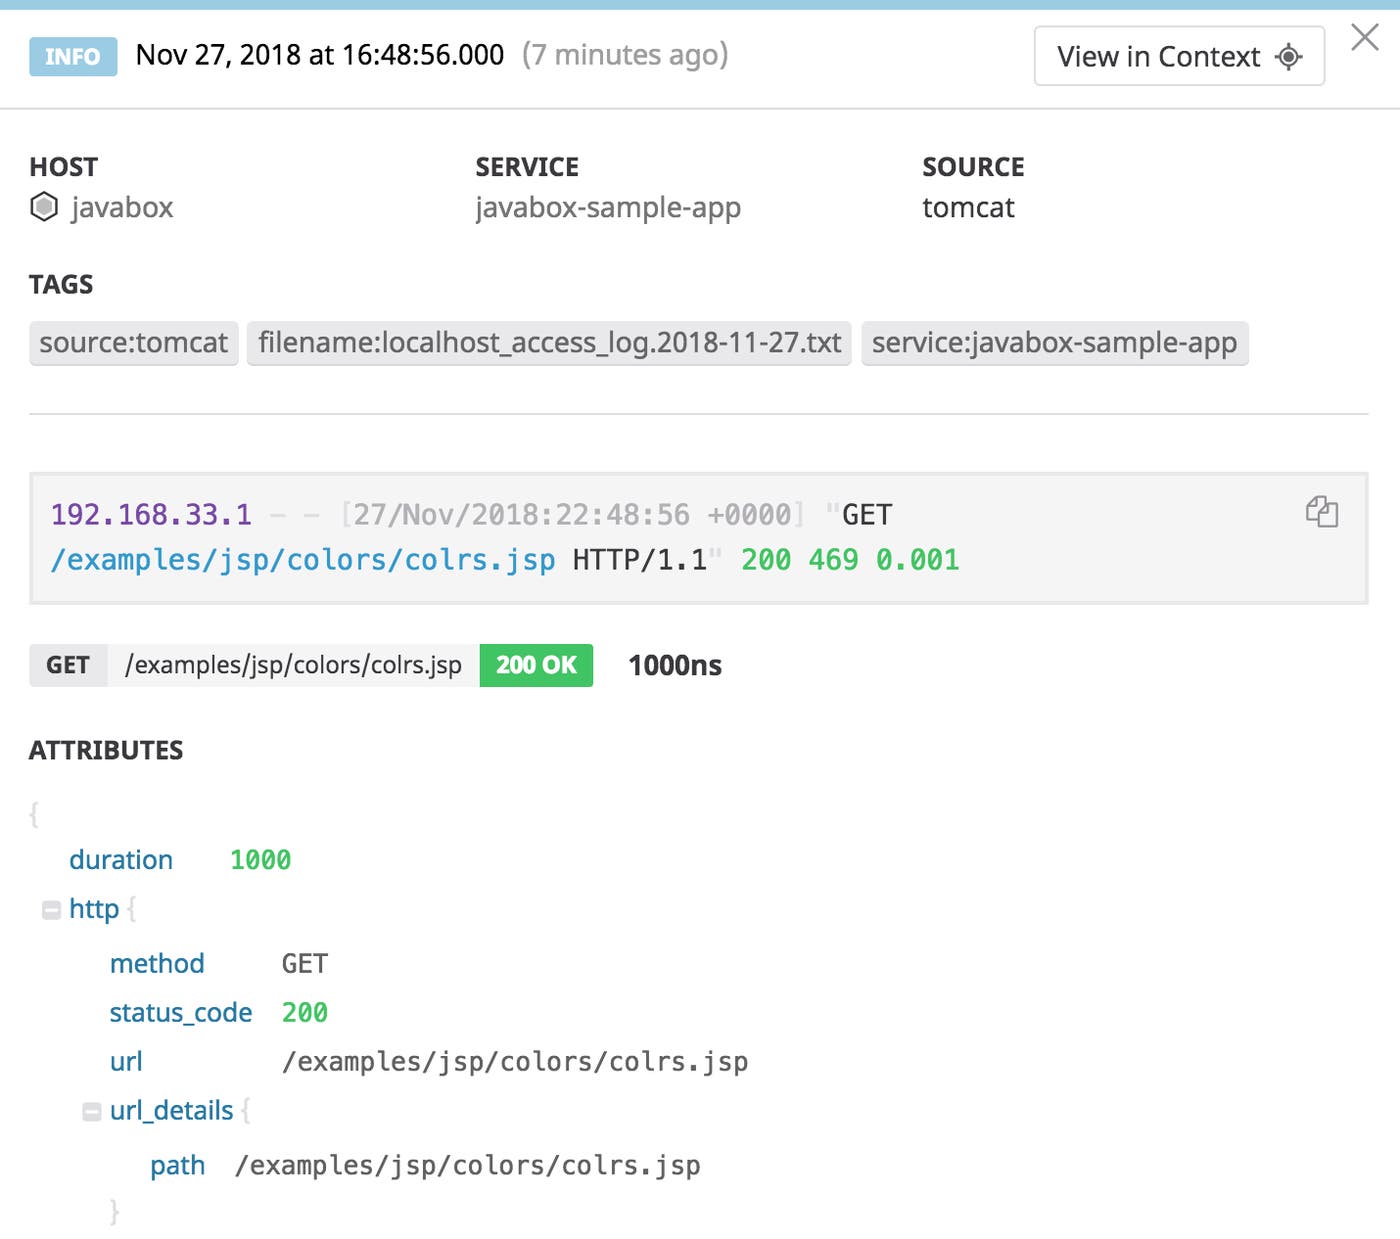
Exploring and analyzing your Tomcat logs
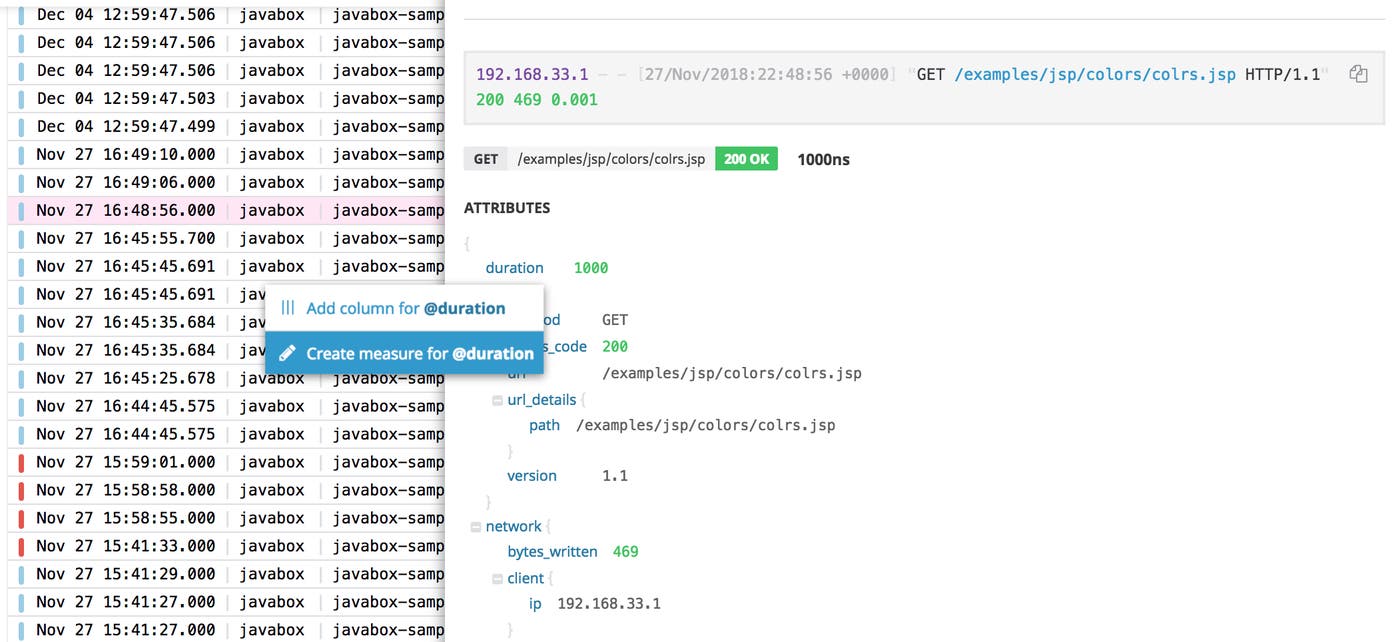
With structured attributes, you can easily search all logs collected by the Agent in the Log Explorer, and quickly view the ones that are most important to you. You can create a measure from any numerical attribute (like duration) if you’d like to visualize it with log analytics by clicking on the attribute then the “Create measure for” button.
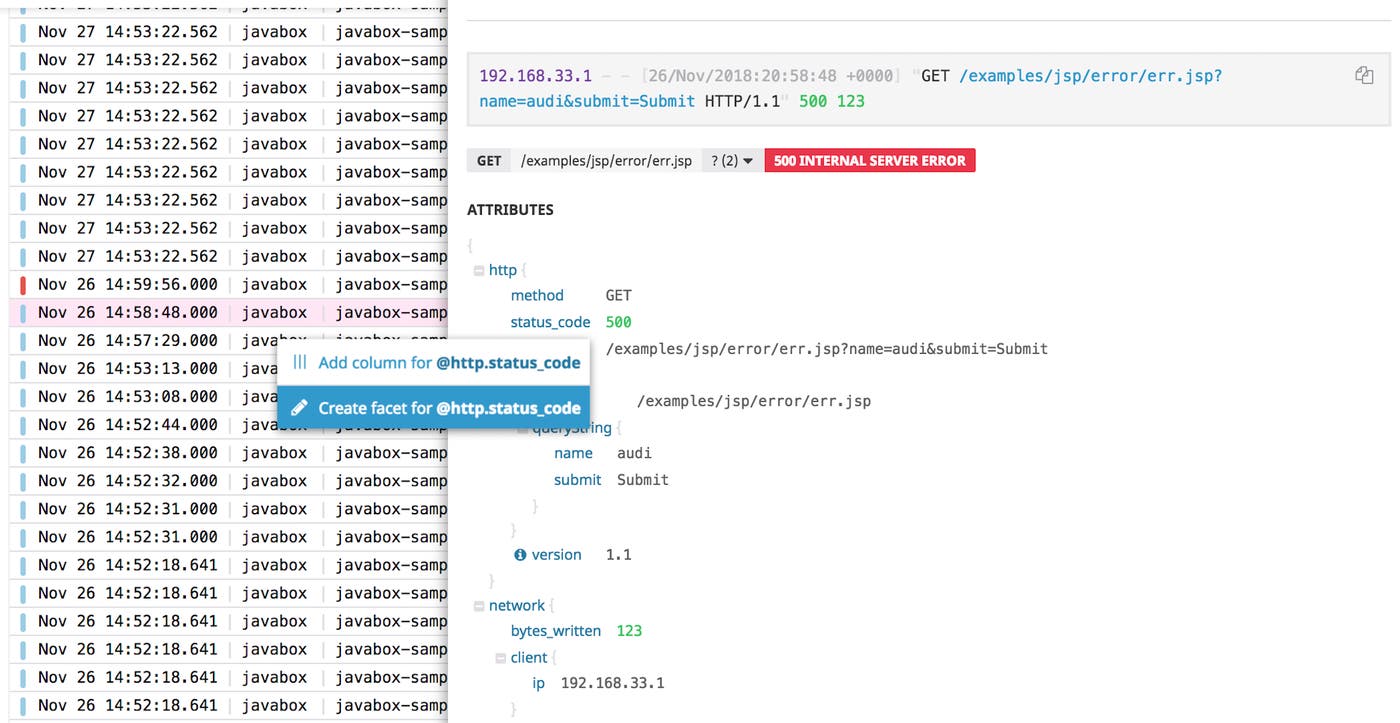
You can use facets to make attributes searchable, enabling you to easily filter, search, and analyze logs by a specific client IP, an application service, or an HTTP response code. For example, you can create a new facet for the http.status_code attribute by inspecting a Tomcat log entry in the Log Explorer, and clicking on the http.status_code attribute.
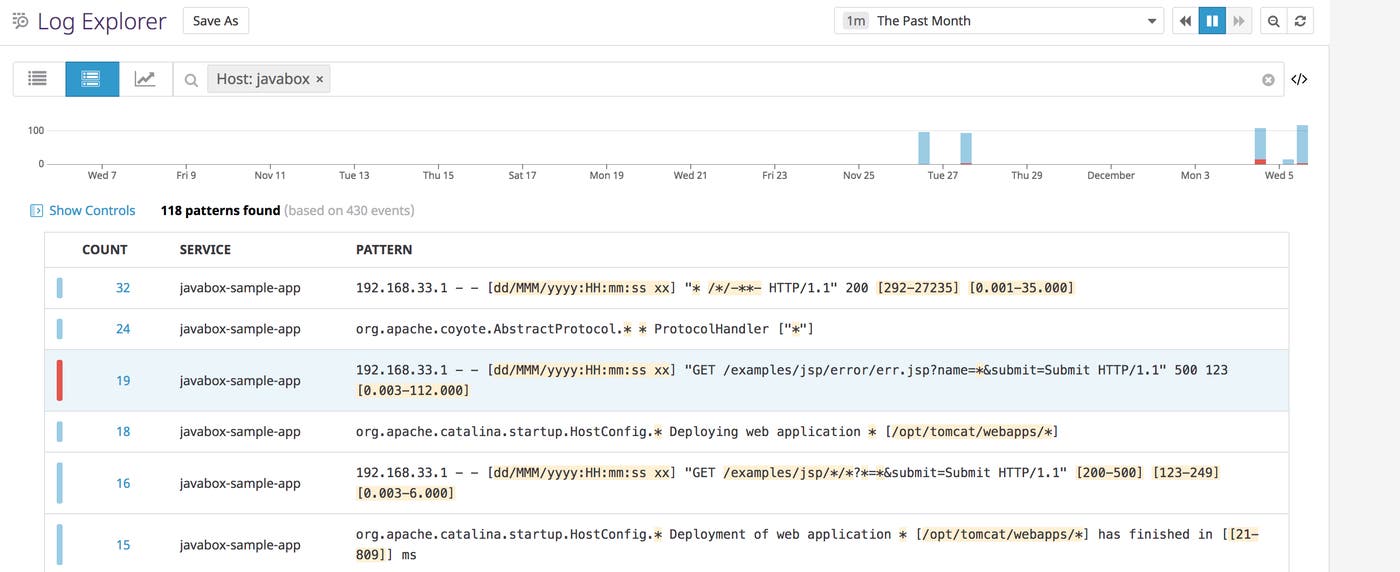
If you need to quickly sift through a large volume of logs, you can click on the Log Patterns icon in the upper-left corner of the Log Explorer. As your server generates logs, Datadog will group them by common patterns and highlight the differences within each pattern (such as IP addresses or request URL paths), so you can pinpoint the cause of the errors.
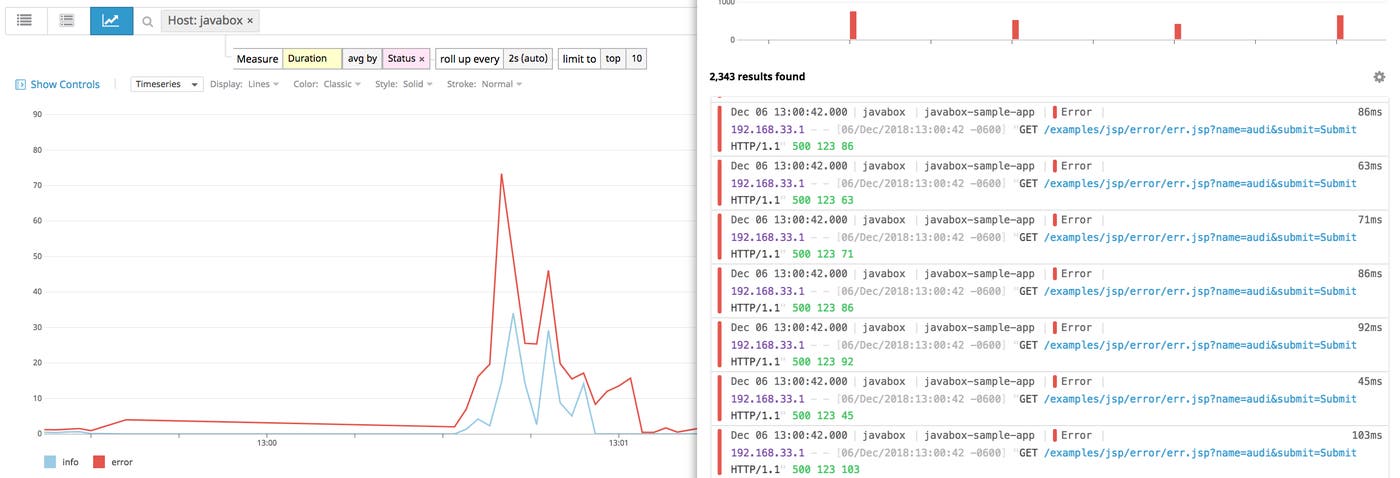
And you can use measures and facets in Log Analytics to sift through your logs. For example, you can view the requests that are taking the longest amount of time to process (measure), broken down by their status (facet).
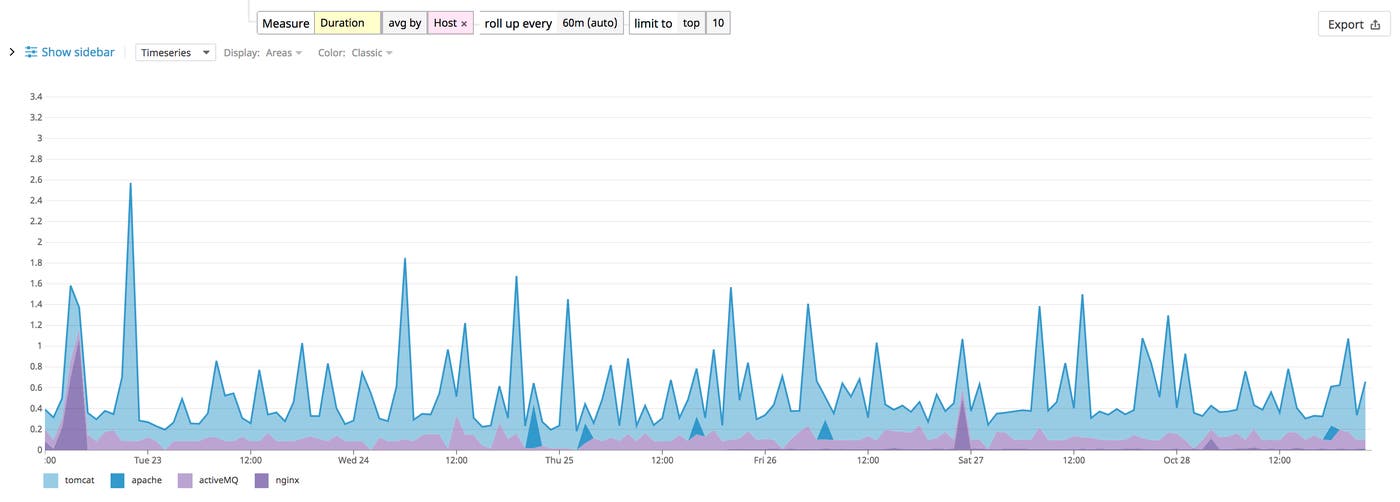
Or you can view average processing time across other web servers in your infrastructure, in addition to Tomcat. If you want to save the resulting graph, you can export it to a new or existing dashboard by clicking on the “Export” button in the top-right corner.
We’ve seen how Datadog’s Tomcat integration pipeline automatically processes and extracts key data from your Tomcat logs. Once you’re collecting and processing all your Tomcat logs, you can analyze them to determine if, for example, requests to a particular URL path are generating a high rate of server errors. In the next section, we will show you how to create alerts to immediately notify you of potential issues.
Alerting on Tomcat metrics and logs
An important aspect of monitoring is knowing when critical changes occur with your server as they happen. If Tomcat goes down or starts generating a large number of errors, you will want to know about it as soon as possible. You can proactively monitor Tomcat by setting up alerts to notify you of activity such as anomalies in request processing time or spikes in the number of errors your application or server generates. In this section, we’ll show you how to use Datadog alerts to track potential issues with your Tomcat server.
Alerting on Tomcat server status
Datadog’s Tomcat integration includes a built-in status check that can automatically alert you when the Agent is unable to connect to your Tomcat server.
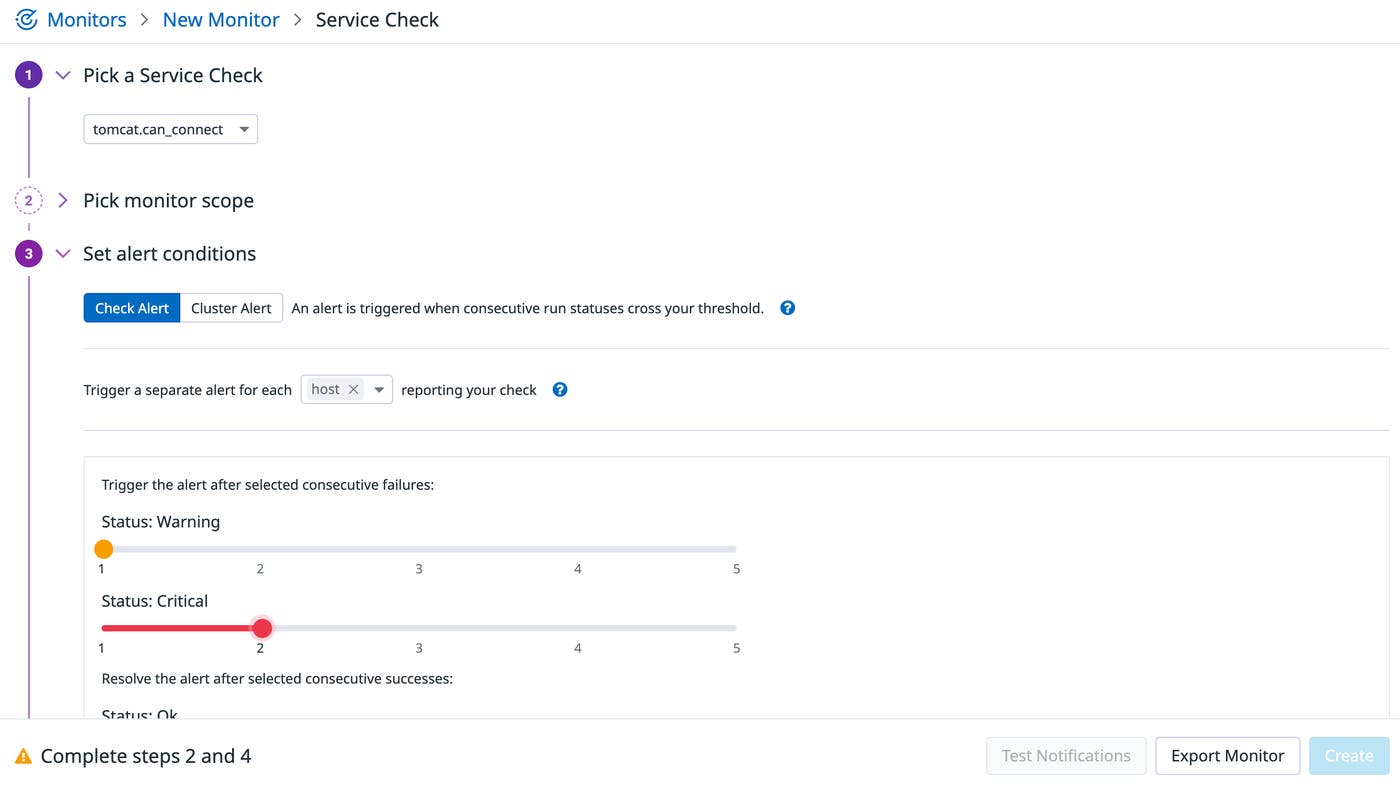
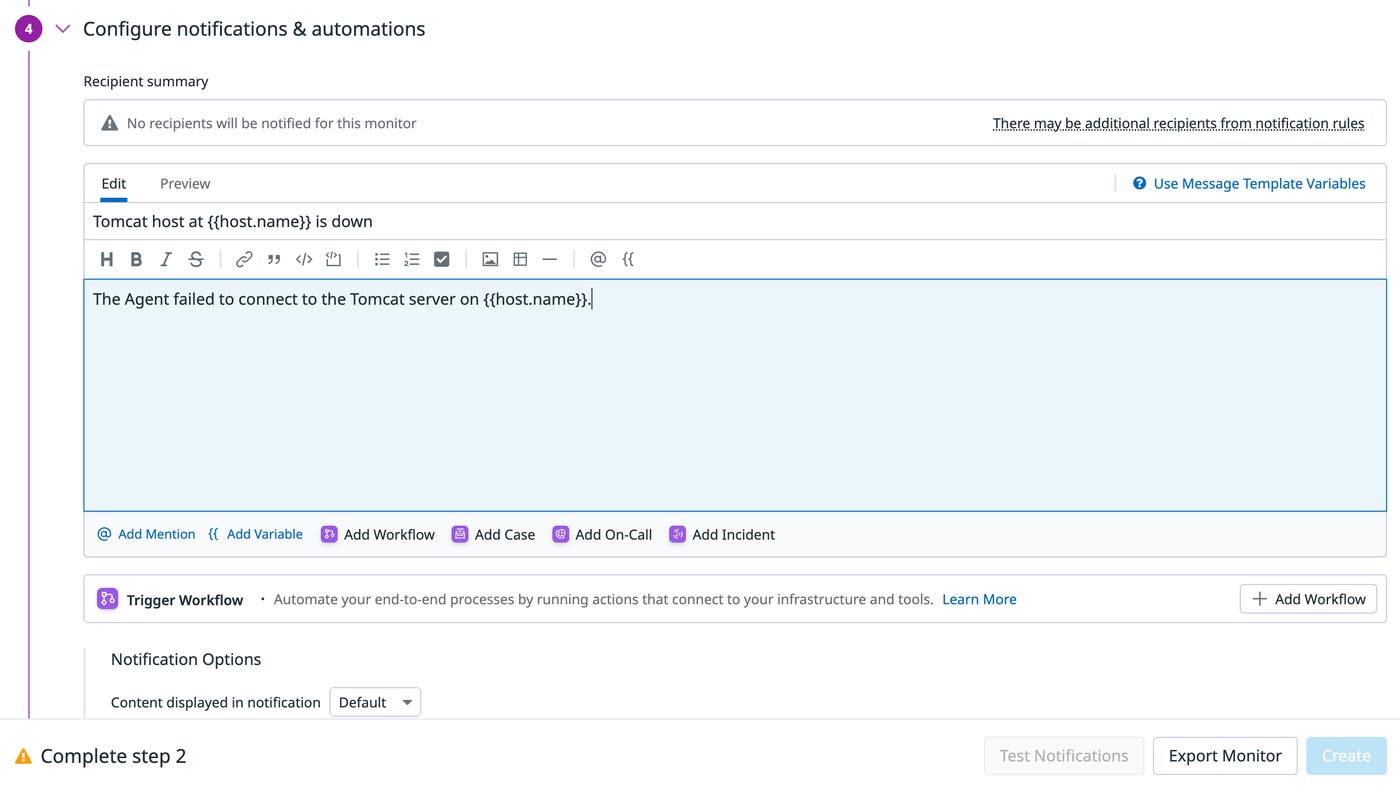
To create this alert, navigate to Monitors > New Monitors > Service Check in the Datadog app and select the tomcat.can_connect option in the “Pick a Service Check” dropdown. In the example below, we’ve configured Datadog to alert us if the Agent fails to connect to any Tomcat host after two consecutive tries. The alert will automatically resolve if the Agent successfully connects to Tomcat again.
You can configure each alert to notify specific users or teams with information about what triggered the alert and how to further diagnose the issue. Each alert message is customizable, so you can use template variables to monitor multiple hosts with the same alert.
Alerting on JVM heap memory usage
It’s important to monitor memory usage to ensure that the JVM does not run out of resources needed to support the Tomcat server. With Datadog, you can create an alert to automatically notify you when your Tomcat host is using a high percentage of the maximum available heap. In the example below, we’ve calculated a usage percentage based on the jvm.heap_memory (the total amount of memory used) and jvm.heap_memory_max (the maximum amount of memory available) metrics. The warning and critical thresholds are set to 50 and 80 percent, respectively. If heap memory usage exceeds 80 percent, then the alert will notify the appropriate team members to address the issue.
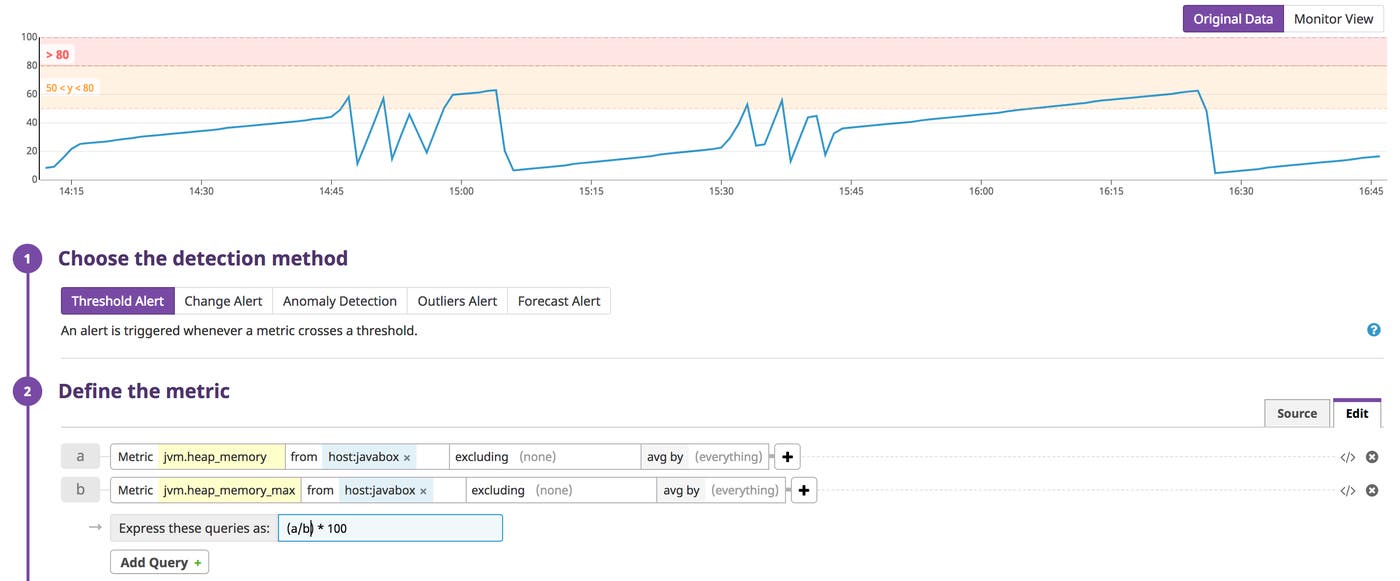
If you want the alert to resolve automatically, then you can set a recovery threshold. In this example, the alert will resolve itself if it detects that the average memory usage has dropped below 40 percent over the past five minutes.

Alerting on Tomcat logs
We’ve already shown you how to analyze your logs to gain a better understanding of how Tomcat is handling individual requests. Once you’re collecting and processing your logs with Datadog, you can also alert on this log data in real time. In this section, we’ll show you how to set up a log alert to track critical server-side errors (5xx HTTP status codes).
To create a log alert, navigate to Monitors > New Monitors > Logs. You can narrow down the search results by searching for the facets discussed earlier such as http.status_code and host.
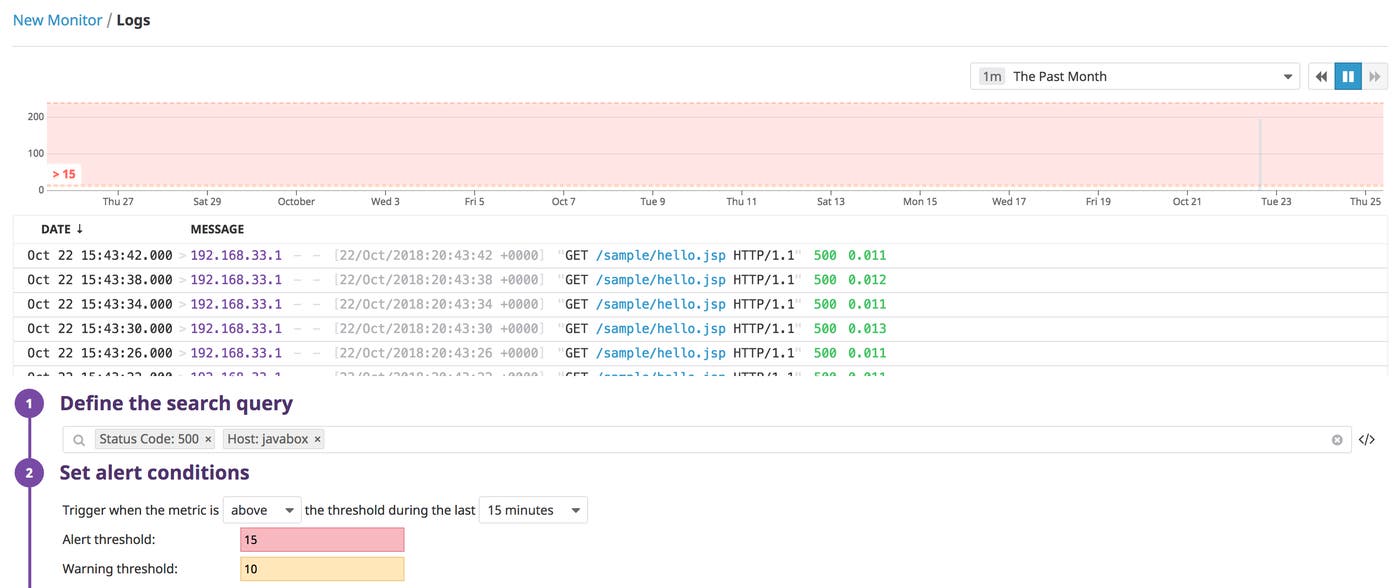
As with the metric alert, you can set a threshold for triggering an alert and a warning. In this example, the monitor will alert or warn you if Tomcat logs 15 or 10 server errors (respectively) over a span of 15 minutes.
Log alerts are useful for sifting through a large volume of logs for you, and automatically notifying you of critical issues as they happen. You can even include samples of the logs that triggered the alert in your notification message, so your team can quickly diagnose the issue. Check out the docs for more information on the available alert types and managing each one.
Monitor Tomcat with Datadog
Comprehensive monitoring for Tomcat involves identifying key metrics for both the Tomcat server and JVM, collecting and extracting log data, and connecting everything in a meaningful way. In this post, we’ve shown you how to monitor Tomcat logs and metrics in one place with Datadog dashboards and alerts. And with more than 1,000 integrations, you can easily start monitoring Tomcat alongside metrics, logs, and distributed request traces from all of the other technologies in your infrastructure. Get deeper visibility into Tomcat today with a free Datadog trial.
Source Markdown for this post is available on GitHub. Questions, corrections, additions, etc.? Please let us know.


