

Whether you run an ecommerce site, a digital publication, or any other customer-facing service, delivering optimum user experiences is key to the success of your business. Customers can grow frustrated and abandon your site when they run into hurdles such as JavaScript errors or confusing page designs, and that frustration negatively impacts your company’s bottom line. Removing these moments of user frustration is vital to the success of your business; however, detecting those moments in the first place is a huge challenge.
Blind spots around user frustration may develop for a number of reasons. For starters, customers may exit your site because of a UX issue they haven’t reported, leaving you unaware of the problem. Secondly, some aspect of your site’s design or functionality may exasperate customers and cause them to express frustration in ways that are hard to spot, such as by clicking on an element many times in a row. Without any way to read these signals of dissatisfaction, you could be under the false impression that your site is operating smoothly even as users grow frustrated with it.
To help you identify these easy-to-miss user experience pain points, Datadog now provides Frustration Signals as part of Real User Monitoring. With Frustration Signals, you can detect customer annoyance either revealed through behaviors such as repeated clicking or caused by clicks that generate errors—or that generate no action at all.
In this post, we will explore the different types of frustration signals that Datadog captures. We will also describe how you can use these frustration signals to focus your troubleshooting efforts as you fine-tune your application and further optimize your users’ experience.
Detecting and visualizing frustration signals
With the release of this feature, Datadog RUM can now detect specific activity patterns associated with user frustration and inform you about when and where these signals have appeared. When frustration signals are detected, they will automatically populate in an out-of-the-box (OOTB) Datadog dashboard. The dashboard provides you with a centralized view of data about these frustration signals, enabling you to spot issues quickly.
You can begin using this new dashboard by reviewing its “Overview” section, which includes a table that lists the users generating the most frustration signals. This information can help you determine which specific users to focus your investigations on in RUM as you work to uncover any underlying UI issues that are causing user frustration. For example, as you investigate, you can click on a user and navigate to Datadog’s RUM Explorer, where you can dive deeper into user actions and session replays. Another important benefit of knowing which users are generating the most frustration signals is that this information can help you proactively resolve issues before customers churn. For instance, a customer success manager can reach out to users you know are frustrated to understand the cause of frustration and provide users with guidance through points of confusion.
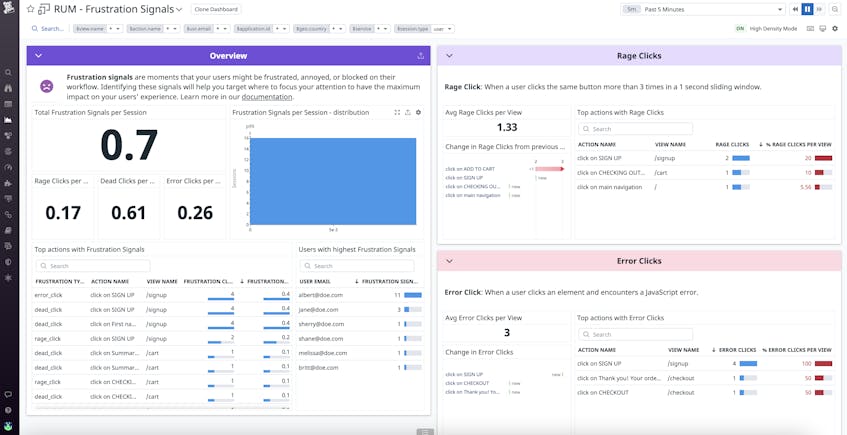
Datadog’s new Frustration Signals dashboard breaks these signals down into three categories:
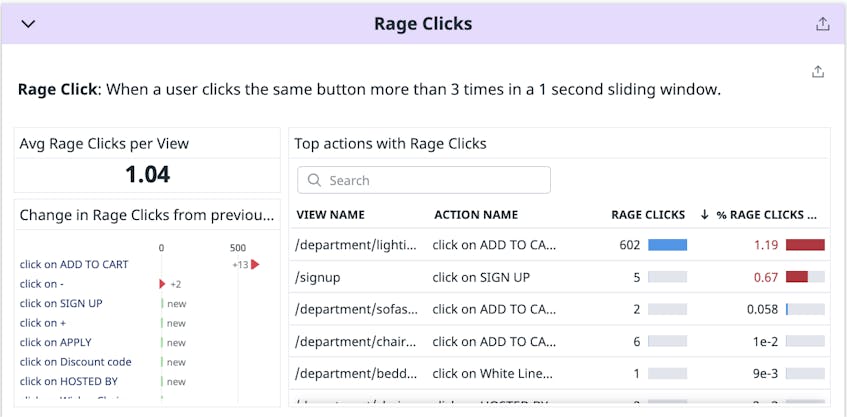
Rage clicks
Rage clicks occur when a user feels exasperated and clicks on an element in your application or website three or more times in less than a second. For example, if a reader clicks on a broken link that doesn’t load a new page, that reader is liable to click the link over and over again in frustration. Detecting these types of rage clicks is crucial to identifying important points of friction that are potentially causing users to abandon your site. Learning when and where these rage clicks occur is also the first step toward uncovering and addressing their root causes. For example, UI elements might inadvertently be misleading users about functionality, suggesting that those elements may need to be redesigned. Or if instead a bug is found to be behind the rage clicks, then you know a code fix is required.
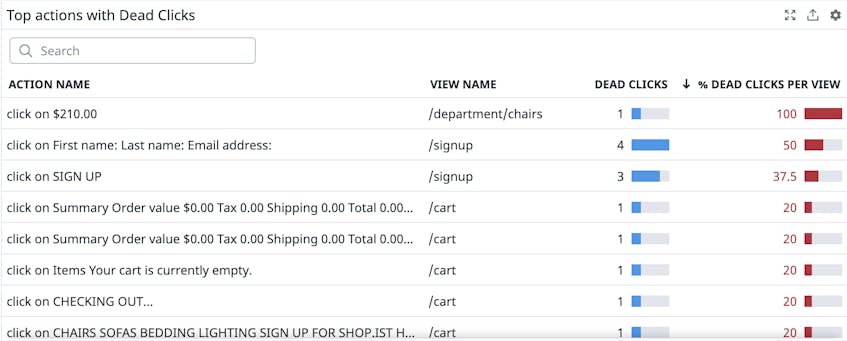
Dead clicks
Dead clicks are user clicks that produce no action on the page, typically against user expectations. Dead clicks are often the result of misleading UX elements. For instance, a page may include text formatting that makes some words appear to be a link, leading a user to mistakenly click on them. Or, a user might click on an item that looks like a button, but no action occurs afterwards.
It’s important to be aware of dead clicks because, if users encounter elements that don’t behave as expected, they are more likely to churn. Dead clicks, however, are not always cause for alarm. To help developers spot pages that need troubleshooting, Datadog provides a top list of actions with the most dead clicks associated with them in the Frustration Signals dashboard.
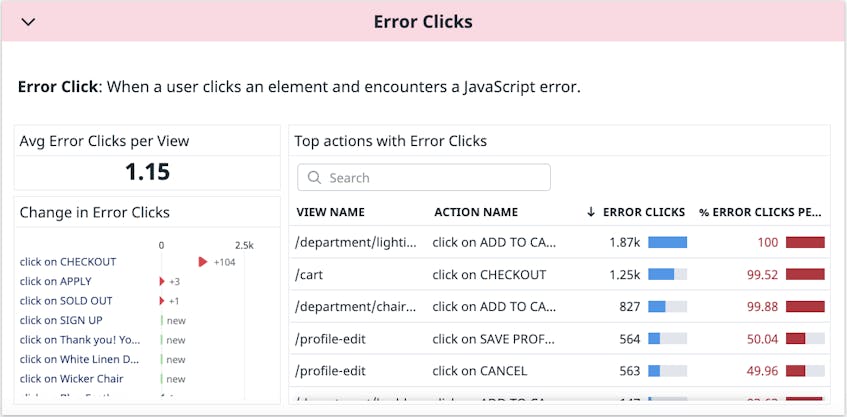
Error clicks
Error clicks are clicks that return JavaScript errors. These types of frustration signals, which can be viewed in the OOTB dashboard alongside rage clicks and dead clicks, point you toward where UX bugs may be occurring so that you can quickly start troubleshooting the errors in question. The OOTB dashboard also includes an average count of error clicks per view, enabling you to quickly determine if error clicks are occurring in alarming numbers. To make it even easier to spot a high volume of error clicks, you can add formatting rules so that the “Error clicks per view” widget turns red if error clicks pass a specific threshold. You can then view the dashboard’s “Top actions with error clicks” list to help you determine where to focus your troubleshooting.
Analyzing frustration signals with Datadog RUM
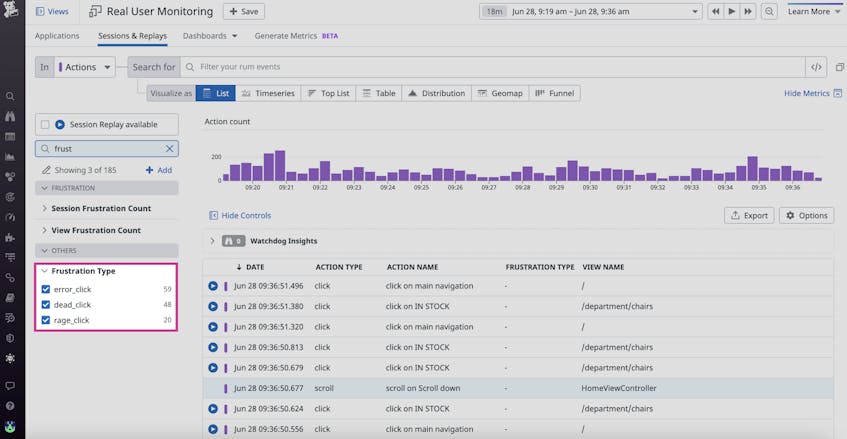
In addition to the OOTB dashboard, frustration signal data is also available in Datadog’s RUM Explorer, which provides a centralized view of real user activity data. The RUM Explorer now includes a “Frustration Type” facet, enabling you to quickly filter your view to user sessions that include specific frustration signal types.
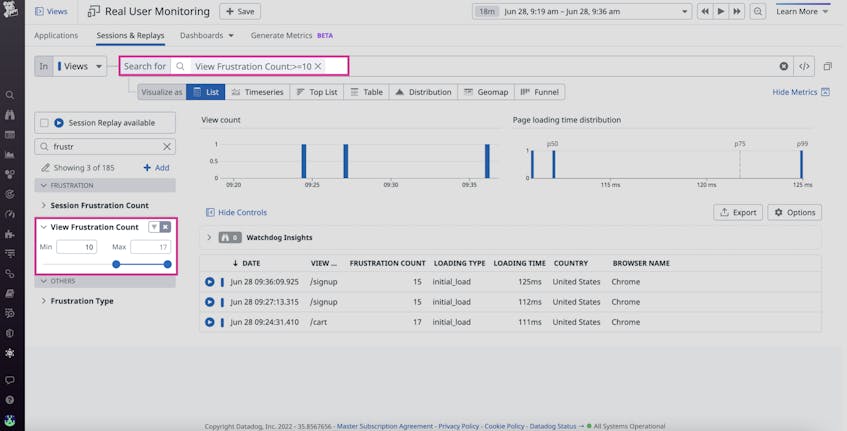
But knowing that users are experiencing frustration is only half the battle; it’s also important to know where in your application that frustration has occurred, and how often. To learn these details, you can use the RUM Explorer’s “View Frustration Count” facet to reveal which pages in your application have had more than 10 frustration signals in the last five minutes. This information is particularly helpful, as it sheds light on which pages in your application most need your attention. You can then prioritize which of those pages to troubleshoot first by focusing on pages that include business-critical actions, such as item checkouts and user signups.
You can also use the RUM Explorer to filter your view to include only user actions with frustration signals. Then you can click on an action to view the associated user session and see where frustration occurred. If at least two frustration signals are detected on an action, the session side panel will include a “What Happened” section summarizing the frustration. The screenshot below, for example, shows that a rage click, a dead click, and an error click were all detected on the ADD TO CART button on the /department/lighting/product/? page.
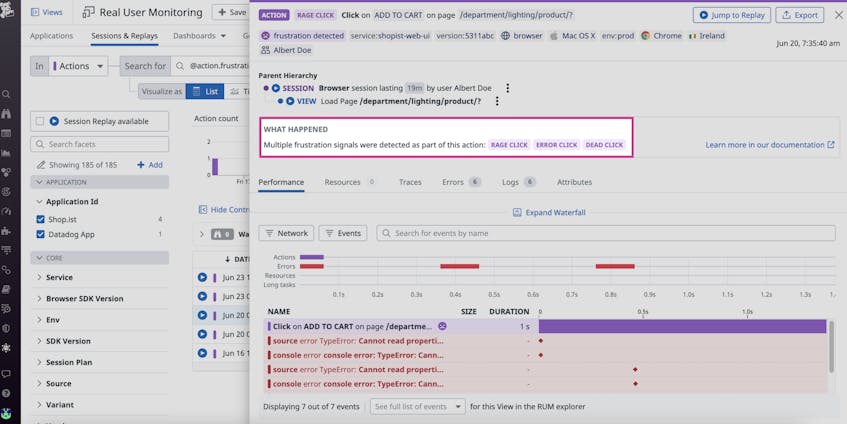
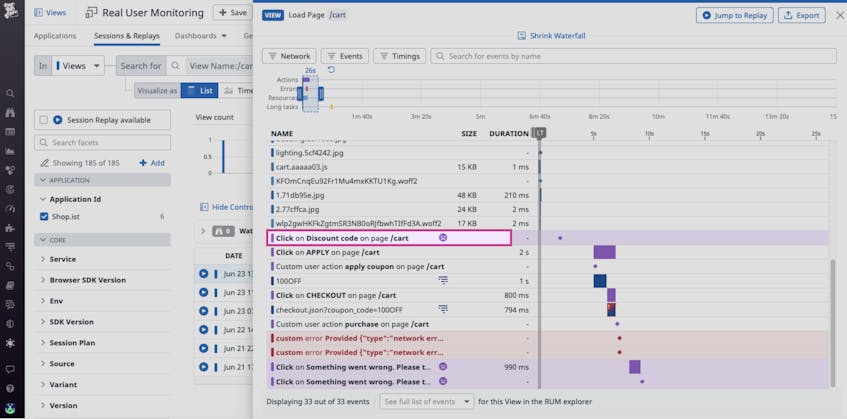
Below the “What Happened” section is an action waterfall that walks you through each step of a particular user session. This waterfall view allows you to quickly spot interruptions in user flow and see when and where frustration has occurred.
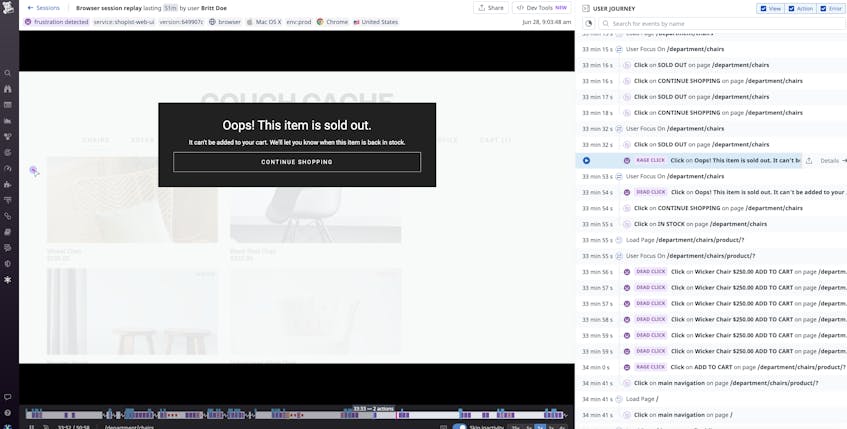
After you filter your view down to user actions that include frustration signals, you can view associated session replays which reproduce entire user journeys so you can watch a reproduction of the frustrated behavior. Viewing session replays helps speed up your troubleshooting by enabling you to see exactly how users behave on your websites and applications.
Start monitoring frustration signals today
The new Frustration Signals feature in RUM introduces valuable insights that help you quickly detect and remove points of friction in your customers’ user experience. To learn more about Datadog RUM and frustration signals, please check out our documentation.
If you aren’t already using Datadog, get started today with a 14-day free trial.
