Evan Mouzakitis
Amazon Data Firehose is a scalable, fully managed service that enables users to stream and capture data into a number of Amazon storage services, including Data Analytics, S3, Redshift, and Amazon Elasticsearch Service. It can be considered a drop-in replacement for systems like Apache Kafka or RabbitMQ.
As a fully managed service, Firehose auto-scales as the size of your data grows. With Firehose you do not need to provision more brokers as your data grows, which can significantly simplify administration and maintenance. You can also use Firehose in conjunction with Data Streams to provide durable storage for otherwise ephemeral data. One key difference between the two very similar technologies is that Firehose makes it easy to store your data without writing a custom consumer—simply point your stream to a supported storage backend and let the data flow. Your consumers need only to be able to read from Amazon services to get their data.
Ensuring the availability and performance of message buses like Firehose is critical to maintaining healthy applications—when data stops flowing to services that need it, problems can spread quickly. With Datadog, you can monitor and alert on Firehose performance metrics alongside metrics from your storage backends and the rest of your infrastructure, all in one place.
Real-time metrics for real-time data
Datadog’s Firehose integration enables you to easily correlate producer performance with metrics from the consumers that are pulling data from Amazon storage. To start pulling in performance metrics from Firehose right away, all you need to do is create or add the required permissions to a role in IAM. This document provides a good starting point, complete with a reference IAM policy document you can customize to suit your needs.

Get a grip on your data pipeline
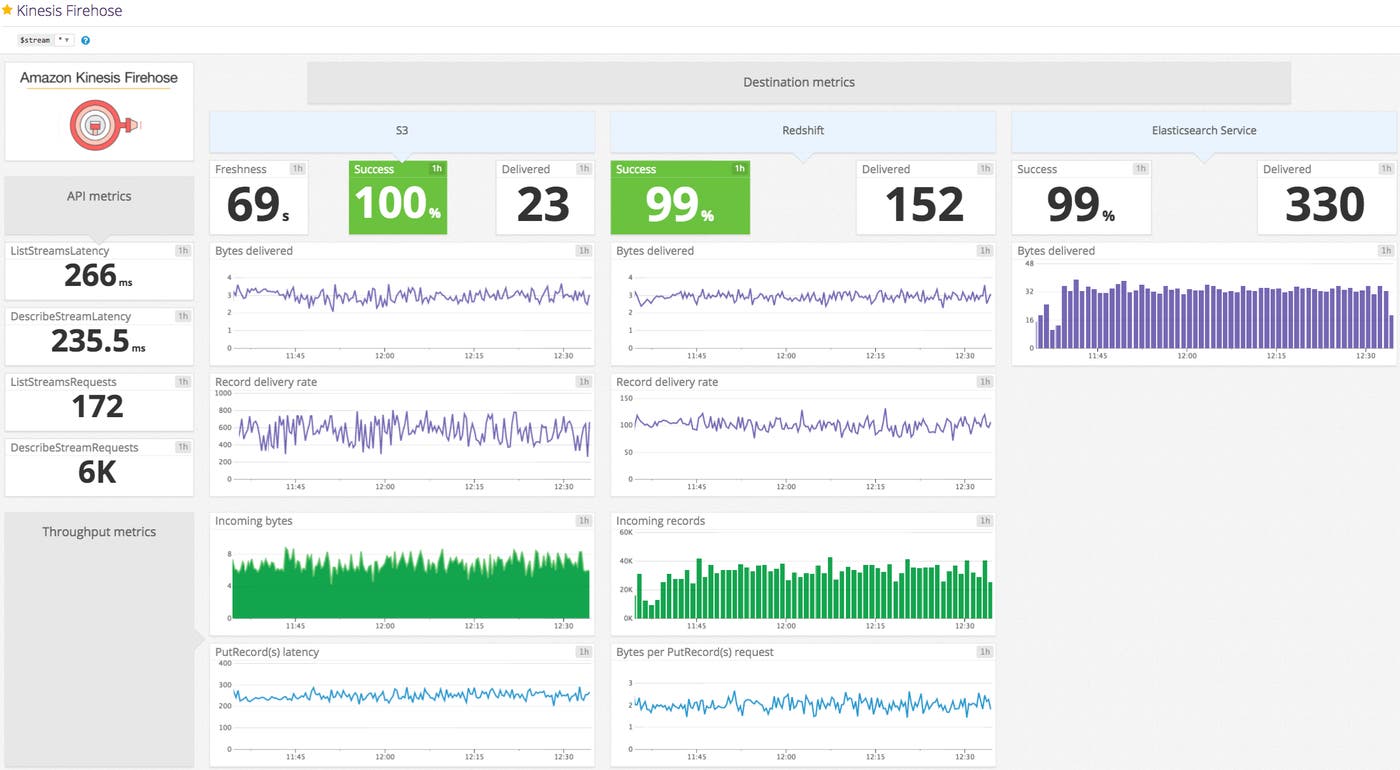
Once you enable the AWS integration, you’ll have an out-of-the-box dashboard like the one above, providing a high-level view of the health and performance of your data pipeline.
The Firehose dashboard goes beyond basic throughput metrics like incoming bytes and records and surfaces producer-level API metrics like PutRecord/PutRecordBatch call frequency and latency, infrastructure-altering calls like UpdateDeliveryStream, and more.
The integration also collects backend-specific metrics, like bytes and records delivered to S3, Elasticsearch Service, or Redshift. Of course, you can also enable the Datadog integrations for S3, Redshift, and Elasticsearch Service for more fine-grained service-level metrics to complement your Data Firehose metrics.
Automatic alerting

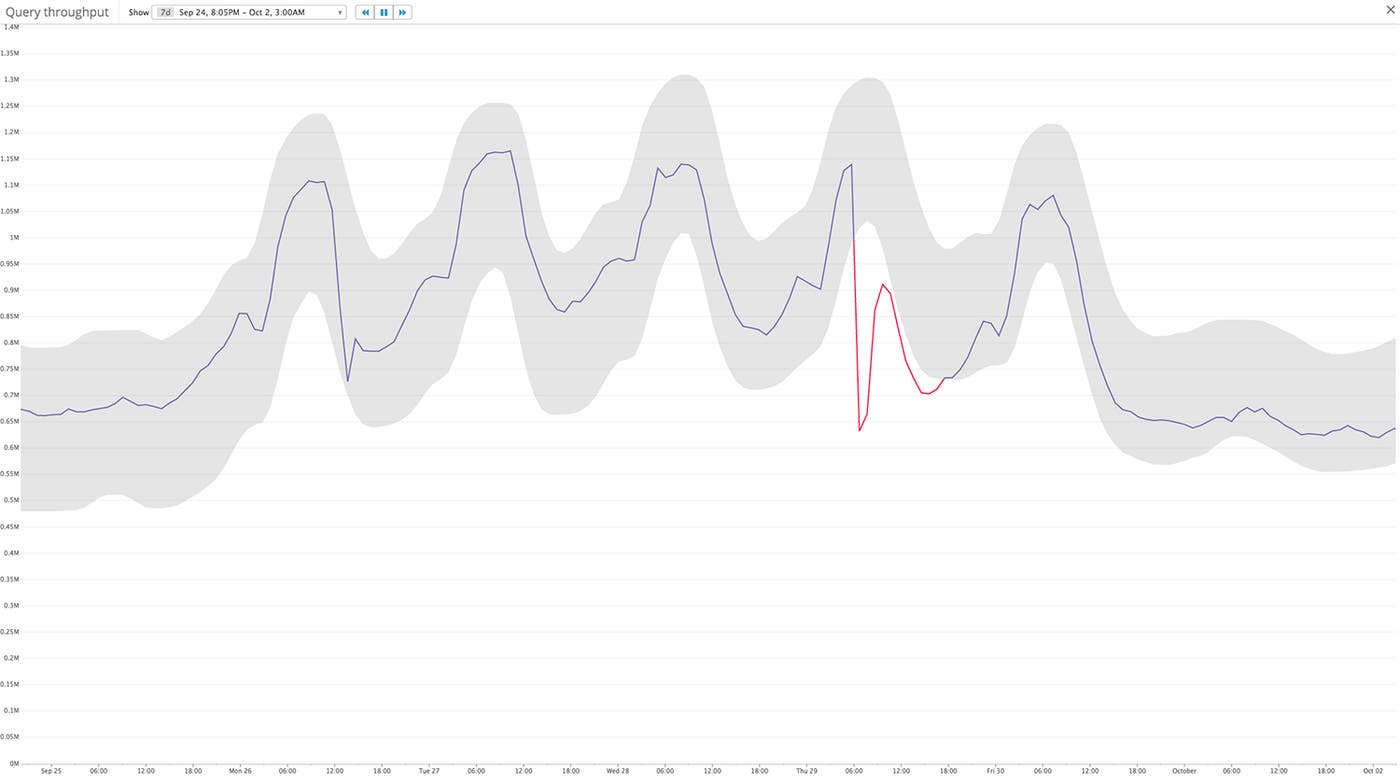
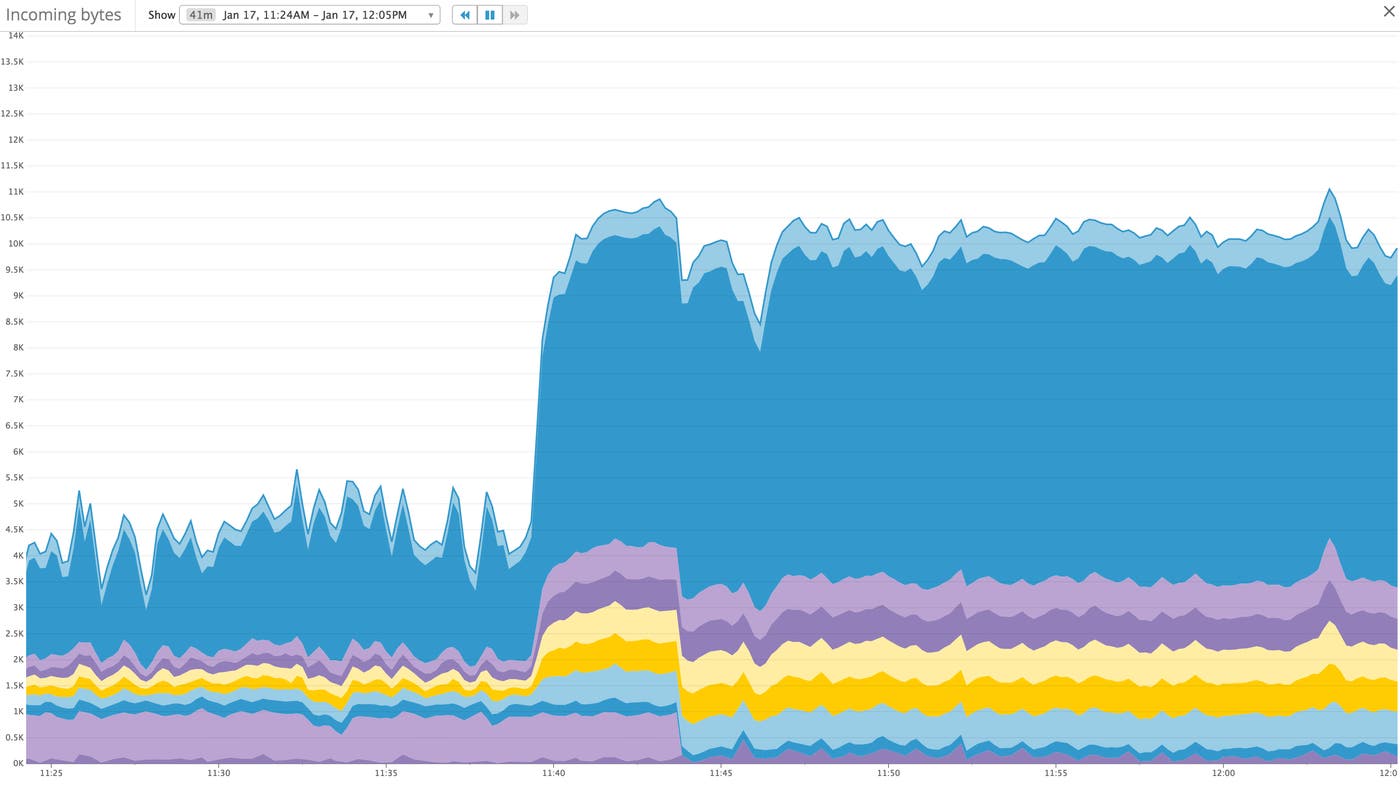
Unexpected drops in throughput are a good indicator of producer issues. With Datadog’s advanced alerting features, like outlier detection, you can quickly identify streams with unusually low traffic (as compared to the rest of the cohort). And with anomaly detection, you can be automatically alerted to unexpected changes in seasonal behavior, with baselines that shift in lockstep with your usage patterns.
Don’t cross the streams!

The Data Firehose integration automatically imports your tags from AWS, so every metric collected is tagged with the name of the stream it describes and the region in which the stream is located. Tagging allows you to intuitively drill into your pipeline to arbitrary depths, and correlate data at the region or stream level, making it easy to identify and address overloaded or underutilized pipelines.
Let the data flow
Datadog simplifies metric aggregation and correlation for Data Firehose streams (and the rest of Amazon Web Services), across regions and accounts. If you’re already a Datadog customer, you can start monitoring your Data Firehose metrics immediately by enabling the AWS integration in Datadog. Otherwise, you can sign up for a free trial and get started today.


