Aaditya Talwai
The Datadog Agent is deployed on a lot of machines, so its performance is very important. As you would imagine, we carefully profile the Agent’s code for efficiency and speed before each release.
Because the Agent is open source, it benefits from contributions made by developers all over the world, which is great. What’s not as great is that until now there was no easy and consistent way for the community to profile their Agent code before submitting a pull request. This led to unnecessarily long GitHub conversations with contributors while we pinned down and resolved inefficiencies. That’s why, as of the most recent release (version 5.4), the Agent ships with profiling tools baked in. We call the new functionality “developer mode.”
Who is this for?
Anyone actively working on or contributing to the Datadog Agent code will find the new developer mode to be an essential tool. Whether modifying the core Agent or creating a custom Agent Check, you will be able to see the impact your code changes have on performance.
Which metrics are supported?
A wide variety of metrics are available, but here are a few of the most important ones:
- CPU usage
- Memory consumption
- Threads in use
- Network connections open
- Total time to run configured checks
Profile individual Agent Checks
Let’s say you just wrote your own Check. Before submitting the pull request, you can (and should) run:
python agent.py check <check_name> --profileThis command will run the specified Agent Check just one time, and then print collected metrics and profiling information (run time, memory use, etc.) to stdout. Once your Check looks good, you may then want to turn on full developer mode and profile everything.
Profile everything with developer mode
To enable developer mode for the Agent itself as well as all Agent Checks, open your datadog.conf and add the following line:
developer_mode: yesAfter saving the changes to datadog.conf, be sure to restart the Agent.
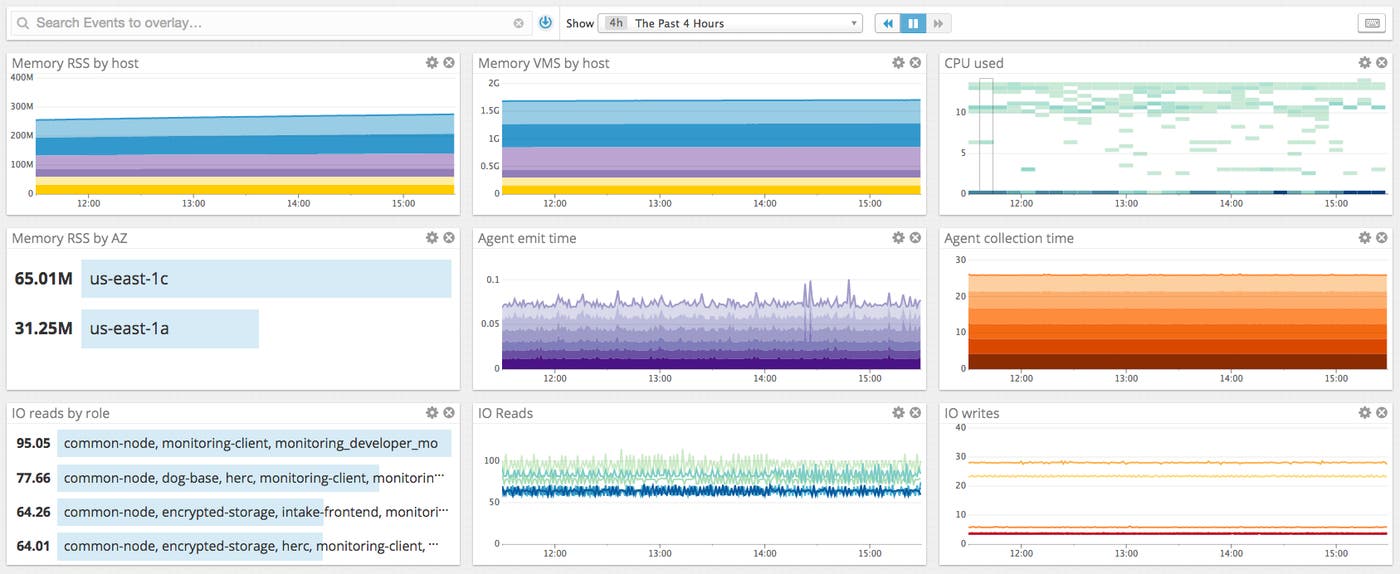
Once enabled, developer mode will begin collecting all Agent statistics.
You can also enable developer mode with the addition of the --profile command line flag:
python agent.py start --profileWithout any additional configuration, the profiling metrics collected in developer mode are available in Datadog under the datadog.agent.* namespace.

Locally, the additional information can be found in the collector.log file located at /var/log/datadog/collector.log on Linux or C:\ProgramData\Datadog\logs\collector.log on Windows. Output can also be piped to stdout or another process.
Contribute!
After your new Agent code or Check is profiled and ready for contribution, please send us a pull request; instructions here.
Getting the most out of developer mode
By default, developer mode will report memory usage before and after running the Agent (to help spot leaks), various statistics including total run time, memory use, disk I/O if available, and the top 20 calls returned by pstats.
Additionally, since developer mode is built on top of the popular Python profiling library psutil (version 2.1.1), any psutil method supported by your environment is available. You can also report these additional metrics by editing the agen_etrics.yaml file, located in the conf.d directory. Please refer to the documentation on the Datadog Agent Project Wiki for more information on configuring agen_etrics.
Digging into collector.log
Because data collected while developer mode is enabled is sent directly to Datadog, you may never need to open the collector.log. Nonetheless, some example excerpts from collector.log are included below.
Memory leak checks
This block shows memory usage before and after a disk check.
2015-06-22 16:25:05 Eastern Daylight Time | INFO | checks(__init__.pyc:692) | disk Memory Before (RSS): 18685952 Memory After (RSS): 18722816 Difference (RSS): 36864 Memory Before (VMS): 2533859328 Memory After (VMS): 2534907904 Difference (VMS): 1048576Collected stats
Agent stats include memory use, I/O, and so on.
2015-06-22 16:25:05 Eastern Daylight Time | INFO | checks.collector( collector.pyc:507) | AGENT STATS: [ ( 'datadog.agent.collector.memory_info.rss', 1435004705, 28442624, { 'hostname': 'vagelitab', 'type': 'gauge'}), ( 'datadog.agent.collector.io_counters.write_bytes', 1435004705, 608.1111111111111, { 'hostname': 'vagelitab', 'type': 'gauge'}) … ]Top function calls
The log captures the top 20 function calls, as ranked by cumulative time.
2015-06-22 16:25:05 Eastern Daylight Time | DEBUG | collector(profile.pyc:37) | 2236475 function calls (2220860 primitive calls) in 383.244 seconds Ordered by: cumulative time List reduced from 930 to 20 due to restriction <20> Ncalls tottime percall cumtime percall filename:lineno(function) 20 299.986 14.999 299.986 14.999 {time.sleep} 21 0.051 0.002 83.260 3.965 checks\collector.pyc:249(run) 147 0.004 0.000 68.352 0.465 wmi.pyc:801(query) 147 0.154 0.001 68.348 0.465 wmi.pyc:1005(query) …Where can I learn more?
Documentation on using developer mode is available at the Datadog Agent Project Wiki. A full list of process-level methods supported by psutil can be found at pypi.org.


