Logs provide valuable information for troubleshooting application performance issues. But as your application scales and generates more logs, sifting through them becomes more difficult. Your logs may not provide enough context or human-readable data for understanding and resolving an issue, or you may need more information to help you interpret the IDs or error codes that application services log by default.
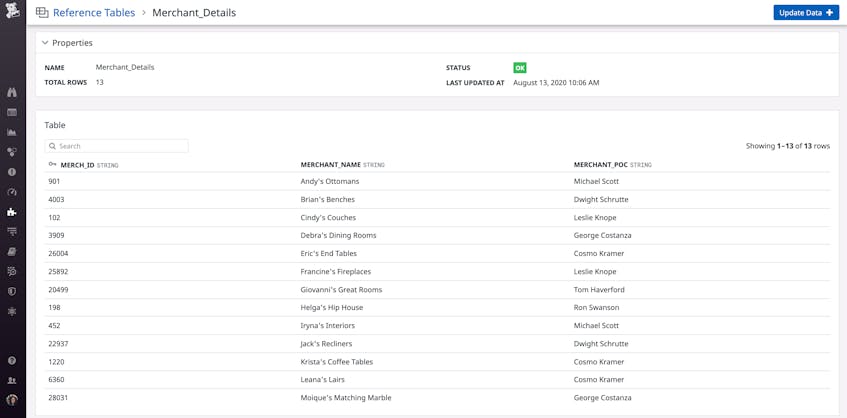
Datadog’s Reference Tables enable you to enrich logs with your own business-critical data, automatically providing more contextual information for quickly resolving application issues. Each table includes a primary key—an ID or code that appears as a field in your logs, such as an organization ID or a status code—and additional business data associated with that key. For example, the Reference Table below uses the merchant ID found in application logs as the primary key and maps each ID to a specific merchant name and point of contact.
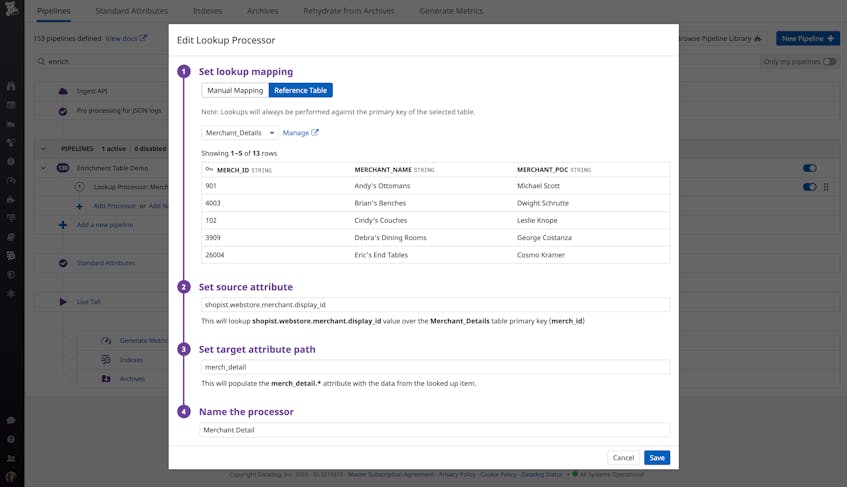
To create a new table in Datadog, you can upload a comma-separated value file (CSV) and select which column you want to use as the primary key. You can then use the table with a Lookup Processor to enrich your logs, as seen in the example processor below.
The Lookup Processor uses the Merchant_Details Reference Table to map each Merchant ID (i.e., the primary key) found in the shopist.webstore.merchant.display_id log attribute to a new merch_detail attribute. With this configuration, Datadog will automatically add merchant names and points of contact to incoming logs as new attributes, which you can use as facets to search and analyze your logs as well as build dashboards to get a better picture of log activity.
In this guide, we’ll show you how you can use Reference Tables to:
- conduct security investigations on historical logs
- organize logs by logical units (e.g., team, organization division, cost center, merchant)
- map error codes to descriptive error messages
Conduct security investigations on historical logs with fresh context
Building secure, compliant applications requires deep visibility into network and service activity, and your logs are invaluable for monitoring this. But logs often don’t contain all the relevant context needed to investigate threats. This means that security analysts need the ability to filter their logs with threat intelligence that is regularly updated with indicators of compromise (IOCs) to gather accurate evidence.
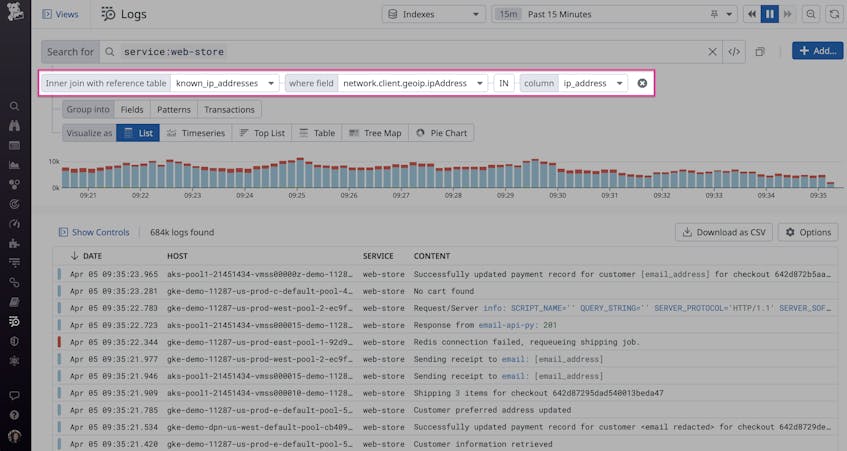
The Log Explorer now enables you to filter logs at query time based on your Reference Tables (in public beta). This capability ensures that you have the up-to-date context you need for security investigations and critical audits. For example, Reference Tables containing information about service owners can help you search logs for the appropriate teams to contact during an incident, ensuring you stay compliant. This kind of information is constantly in flux due to scenarios like expanding company operations, adding new hires, and restructuring teams, so you need to be able to filter logs with relevant information on demand.
During security investigations, you can use a Reference Table containing approved IPs and login locations to search for suspicious logins from unauthorized locations. You can also use updated malware lists to investigate when employees download and execute malicious applications. The following example illustrates how you can easily search for all recent logs that include a malicious IP address from a threat intel reference table:
The findings from these simple but powerful queries can also guide you when building detection rules in Cloud SIEM. For example, you can create a rule that automatically bans any suspicious IP addresses that you identified in your Log Explorer query.
Connect application service logs to specific units
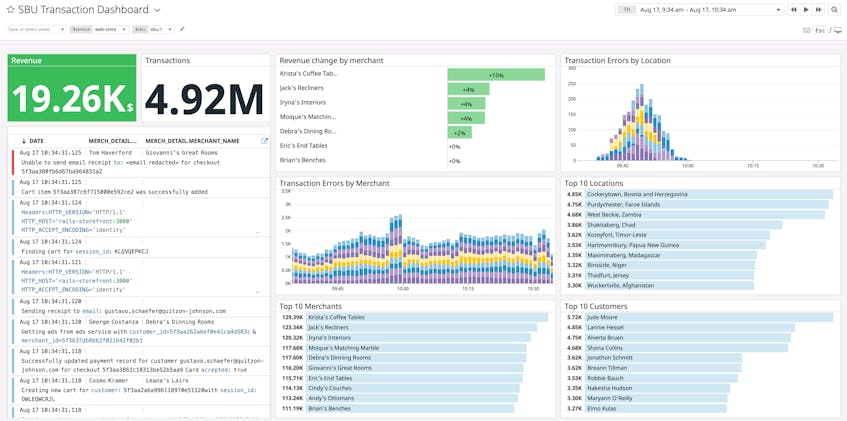
Many organizations group their application services by hierarchy (e.g., team, department, cost center). This allows stakeholders to focus on monitoring and managing specific parts of the application. You can use Reference Tables to automatically map service logs to specific groups within your organization and use that data to build dashboards for better visibility into critical, revenue-generating applications. For example, you can use a dashboard to monitor transactions broken down by application service or strategic business unit (SBU).
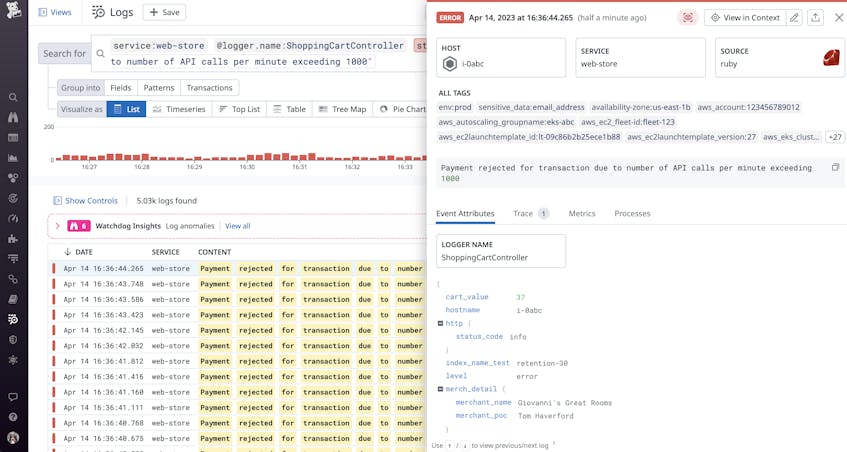
You can also create a table to automatically connect business data with IDs in your service logs, such as merchant IDs, providing more context for faster troubleshooting. For example, you can quickly isolate transaction issues to a specific merchant portal or customer account. The example error log below provides contact information for a merchant portal that rejected payments due to rate limiting.
Troubleshoot more efficiently with error code mapping
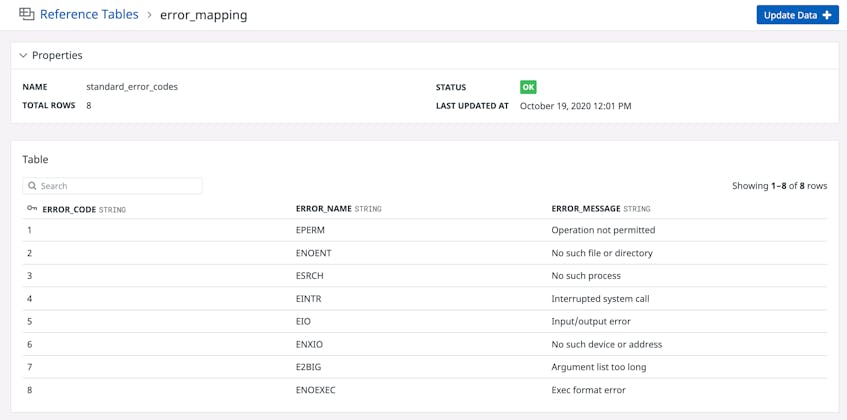
When an application generates an error, it logs a code to reflect the severity or type of error. But each application service may generate its own custom error codes, making it more difficult to pinpoint the issues that generated the errors. Teams need the ability to quickly assess an error without memorizing hundreds of codes. You can use Reference Tables to map error codes to descriptive error messages, making them more actionable for your team and key stakeholders who need better visibility into the state of their services. The example table below automatically maps standard Linux error codes to the appropriate error name and message.
You can also add custom codes and error messages for your application services. Once you connect the table with a log pipeline, Datadog will automatically add the error name and message to all incoming logs that match the pipeline’s filter. Once your logs are enriched with descriptive error messages, you can spend more time investigating an issue with an application service, instead of researching error codes.
Keep your tables up to date
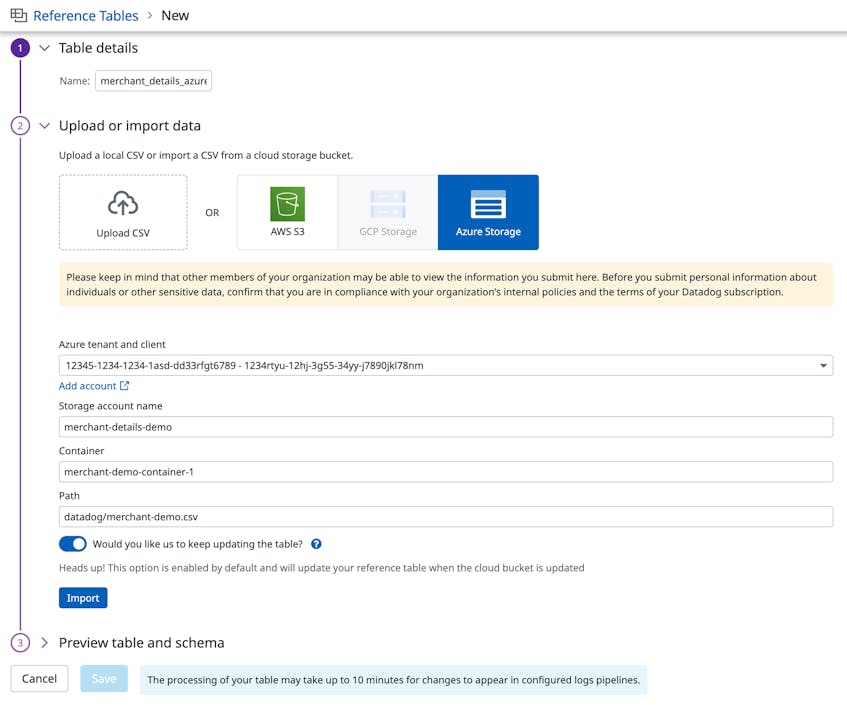
With Reference Tables, you can bring operational and transactional data together to streamline workflows. To manage larger datasets, or reference data that changes over time, you can link your tables to cloud buckets such as Amazon S3 and Azure Storage to automatically keep them up to date—support for Google Cloud Storage is coming soon. This method supports tables of up to 200MB and ensures that they always have the latest data any time the underlying CSV file is modified.
Check out our documentation to learn more about Reference Tables and using them to filter your logs. If you don’t already have a Datadog account, you can sign up for a free trial today.


