

Last year, we published a study of Docker usage across our broad customer base. The data, which we then updated in June 2016, shows that the excitement around Docker is not just hype. Docker is being used at a large and ever-increasing number of organizations, and the companies that try Docker tend to stick with it.
As this young technology finds increasing use in production environments, we decided to take a deeper look at how organizations are managing their containerized application infrastructure. At Datadog, we have seen a tremendous amount of interest in container orchestration tools such as Kubernetes and Amazon ECS, but we wanted to see if our anecdotal observations were backed up by actual usage data.
Because we have thousands of customers running Docker, we can see usage and adoption trends emerging in real-time. In this article we’ll examine how organizations are using ECS specifically, although we plan to study container orchestration more broadly in the future. We’ve chosen to focus on ECS initially because Datadog’s integration with ECS has been generally available for well over a year, giving our customers plenty of time to start using it.
Background: How ECS works
Amazon’s EC2 Container Service (ECS) is a hosted service for managing and orchestrating Docker containers in the AWS cloud. As the name suggests, ECS allows you to run Docker containers on a cluster of EC2 instances. ECS handles the scheduling and placement of containers across your cluster, balances load across containerized services, and can be configured to automatically scale your container infrastructure based on demand. And of course ECS integrates neatly with other AWS services, such as CloudWatch, ELB (Elastic Load Balancing) and Auto Scaling.
Trend 1: ECS is quietly, steadily gaining steam
ECS does not have the buzz or community that buoys the open source competitor Kubernetes, but our data shows that ECS is getting plenty of real-world use. In the year-plus since Datadog’s ECS integration was first released, ECS adoption has climbed steadily from zero to 15 percent of Docker organizations using Datadog. (And more than 10 percent of all Datadog customers are now using Docker.)
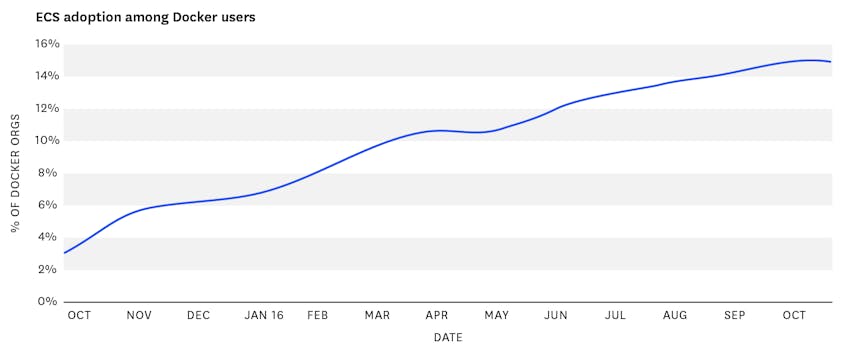
ECS is steadily gaining steam for Docker orchestration.
The graph of ECS adoption as a share of Docker users shows a slight flattening in recent months, but it’s important to note that this analysis may underestimate the share of Docker users in Datadog’s customer base who run ECS.1
Trend 2: More containers, more problems
As you might expect, orchestration is more prevalent in organizations with more Docker. After all, manually shepherding your containers is fine for small projects, but can become untenable as the number of hosts and containers grows.
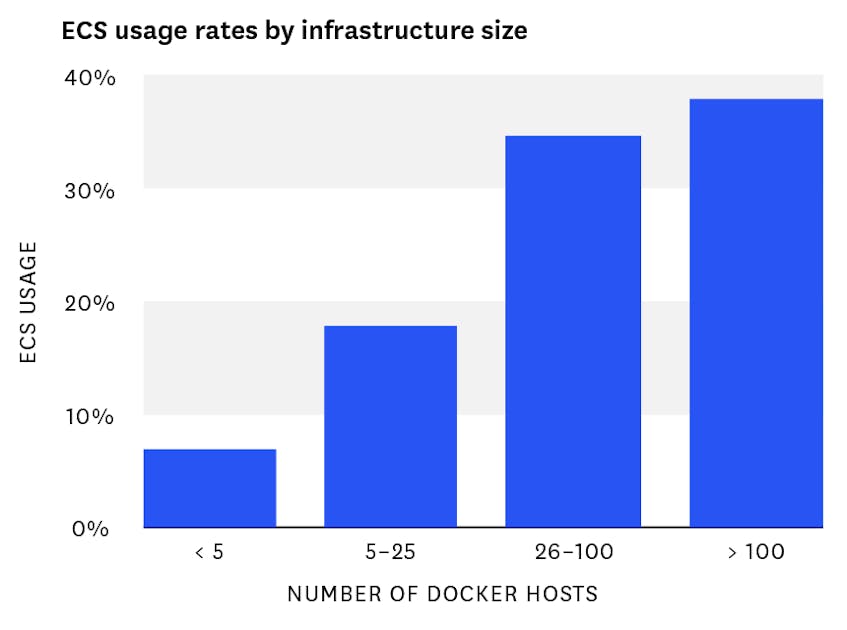
Among Datadog users, we see very limited usage of ECS in organizations where fewer than five unique hosts report Docker metrics over the course of a month.2 But as the Docker infrastructure grows, so does the likelihood that a given organization will orchestrate its containers using ECS. Nearly 40 percent of organizations monitoring large Docker installations of more than 100 hosts are also monitoring ECS.
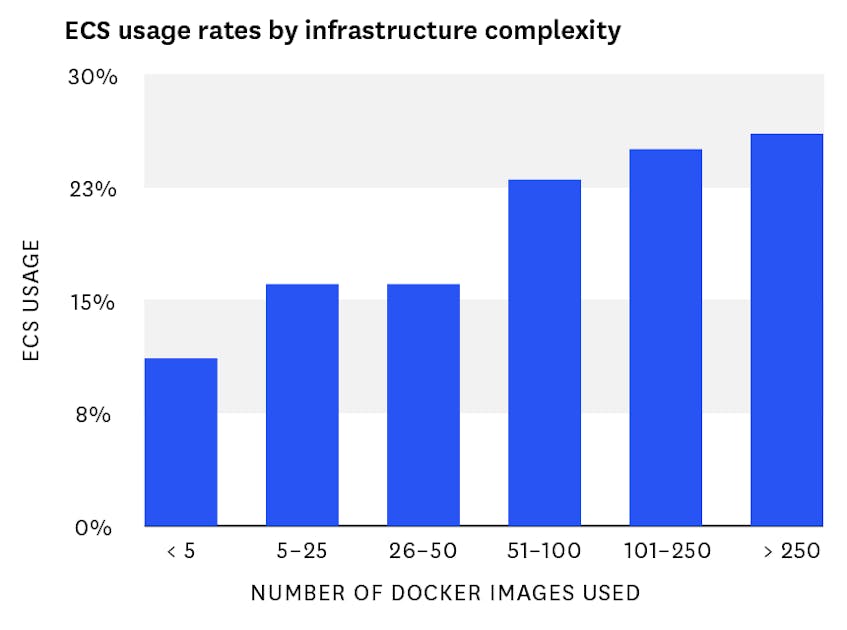
ECS usage correlates with larger, more complex Docker infrastructure.
Bucketing organizations by the number of unique Docker images in use, rather than unique hosts, reveals a similar pattern: The more images an organization uses, the higher the rate of ECS use.
Trend 3: Orchestration accompanies growth
Whether increasingly complex infrastructure demands orchestration, or orchestration opens the door to more complex container infrastructure, one thing is clear: the typical organization’s container infrastructure grows significantly right around the time that they start using ECS.
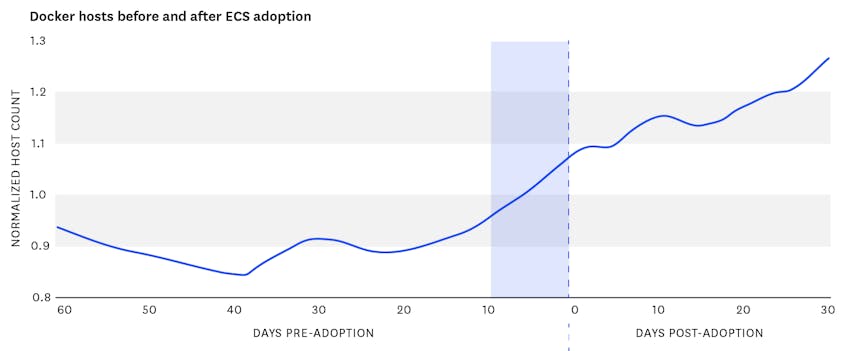
The graphs below track the increase in running containers and Docker hosts associated with a typical organization’s adoption of ECS (as inferred from the first arrival of ECS metrics). The counts are normalized per organization so that a value of 1.0 represents the organization’s average value across the time window.
We include a 60-day “before” window to show that the baseline prior is fairly steady, then starts to increase around 10 days before ECS adoption. This early ramp-up could be explained by organizations making changes to their infrastructure in preparation for a cutover, or by a lag between the actual adoption of ECS and the start of monitoring ECS with Datadog.
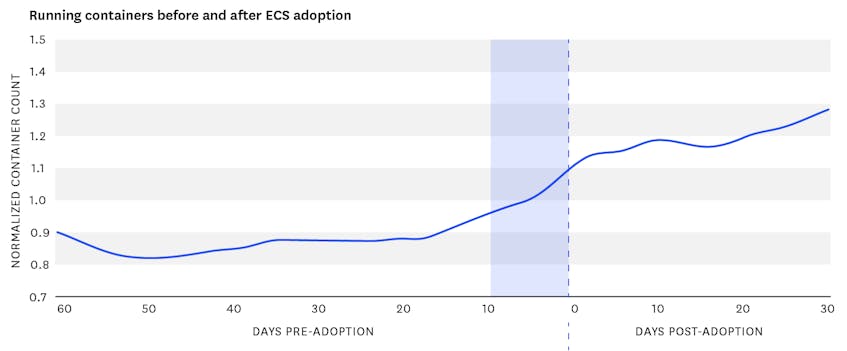
Companies start using more containers and Docker hosts when they adopt ECS.
In the 30 days after an organization starts reporting ECS metrics, we see a 35 percent increase in the number of running containers as compared to the 60-day baseline that came before. Using the same parameters, we see a 27 percent increase in the number of running Docker hosts.
Tuning up the orchestra
Docker is still a young technology, and the tooling around it is younger still. But all indications from our ECS analysis and our larger Docker adoption study are that plenty of organizations are already getting serious about containerization.
As container orchestration marches closer to the mainstream, we will continue to keep an eye on emerging trends. Look out for new and updated analyses on Docker adoption, ECS usage, and other infrastructure trends in the coming months.
Footnotes
The percentages in this graph are calculated by selecting all the organizations that enabled the Docker integration in Datadog, and determining which of those organizations also have ECS enabled in their account. But some organizations may run ECS without native Docker instrumentation, so they are excluded from the calculation. ↩︎
These percentages are calculated from host and image counts during the month of October 2016. ↩︎
