

What happened?
Between September 24, 2020, 14:27 UTC and September 25 00:40 UTC, the US region of Datadog (reachable via https://app.datadoghq.com) experienced a degradation of service that affected:
- The web tier and its API endpoints (fully recovered at 20:18 UTC)
- Logs (fully recovered at 20:22 UTC)
- Network performance monitoring (fully recovered at 21:40 UTC)
- Alerts (fully recovered at 01:00 UTC)
- Infrastructure monitoring (fully recovered at 01:25 UTC)
- APM (fully recovered at 03:00 UTC)
Affected services were at times disabled, degraded, or only intermittently available. Incoming data was still ingested and processed during the incident.
The intermittent and repeated failures of the web tier also made it difficult for our users to access the unaffected products on our platform. Knowing how much they rely on us to provide visibility into their own stacks, we are deeply sorry for the disruption it has caused to our customers and have started to implement a series of changes to eliminate a similar issue in the future.
Lastly, we have established that this incident was not security related.
Why did it happen?
In all regions, the Datadog platform is deployed across multiple availability zones and is routinely tested for resilience against the random loss of nodes in all availability zones. This incident was the result of a kind of failure that we had not experienced before.
The failure of a core system
The incident was caused by the failure of an internal service discovery and dynamic configuration system that the vast majority of Datadog software components rely on. Service discovery is a central directory of all services running at a given time and provides an easy way for services to find where their dependencies are. Dynamic configuration lets us reconfigure services at run-time and is one of the first dependencies that our services query, as they start up.
This system is backed by a highly available, distributed cluster spanning multiple availability zones. It is designed to withstand the loss of one or two of its nodes at any given time without an impact on its ability to:
- Register and deregister services (“service foo is now available at this IP”)
- Answer service discovery queries over DNS (“where is service foo?”)
- Answer configuration queries (“should this option be turned on for this customer’s requests?”)
Because service discovery is a core system throughout our entire infrastructure, its failure unfortunately had global effects, made our recovery efforts difficult, and extended the duration of the incident.
Setting the stage
We traced the origin of the failure to a routine operation by an authorized engineer early that day, on a small-sized cluster, that is itself a dependency of a much larger data intake cluster. The function of this smaller cluster is to measure latency once data has been received by the intake cluster. When a payload is received, the intake cluster asynchronously instructs the latency-measuring one to start and track latency as the payload traverses our processing pipelines.
We designed this interaction to not be in the critical path of incoming data. If the latency-measuring service is down or missing, we get internal notifications to investigate, but the sole customer-facing effect of that failure is to suppress alert notifications downstream. Or so it was until roughly a month before the incident.
Late August, as part of a migration of that large intake cluster, we applied a set of changes to its configuration, including a faulty one: instead of using a local file for DNS resolution (slow to update reliably but very resilient to failure), the intake cluster started to depend on the local DNS resolver, which itself is a caching proxy to the service discovery system. Once the faulty change was live, there was no visible difference:
- The local DNS resolver did answer more queries but it did not change any intake service level indicator that otherwise would have had us trigger an immediate investigation.
- The local DNS resolver properly cached DNS queries so very few additional DNS queries were received upstream by the service discovery cluster.
However, there was one crucial exception which we never see during normal operations: NXDOMAIN answers are not cached by the resolver to quickly propagate service deregistration throughout the infrastructure. In other words, a missing entry for the latency-measuring cluster in the service discovery cluster causes the requesting client to keep asking at a rapid clip where to find that service, even if it does not actually need that to ingest data successfully.
With this change in place and its impact missed during the change review, the conditions were set for an unforeseen failure starting with a routine operation a month later.
A thundering herd
Back to our fateful day. When the smaller, latency-measuring cluster was recycled (scaled down and back up again), its nodes were unreachable for enough time for the larger cluster to issue a large volume of DNS requests back to the service discovery system. The volume of DNS requests was multiplied by 10 in 10 short seconds, as shown below:
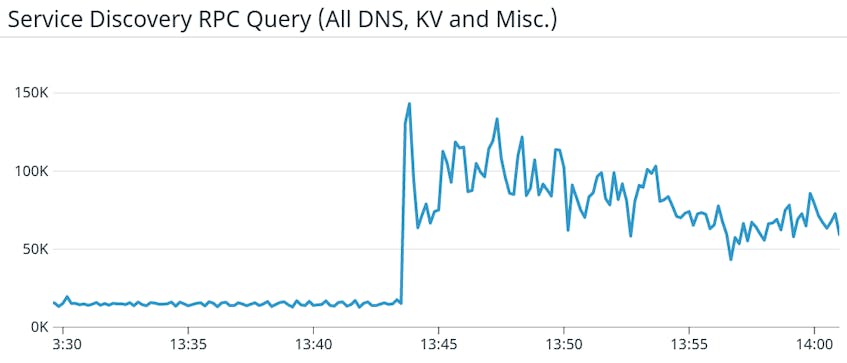
This sudden onslaught caused the service discovery cluster to lose its quorum and fail to reliably register and deregister services, and fail to quickly answer DNS requests coming from other parts of our infrastructure. After local DNS caches expired on all nodes, we faced a “thundering herd” on the service discovery cluster, amplifying the issue until its breaking point. The net result was that most of our services could neither reliably find their dependencies nor load their runtime configuration at startup time, thus causing repeated errors until:
- Their dependencies were statically available via a local file,
- Their runtime configuration parameters were statically available via a local file, or
- They could reliably depend on the service discovery cluster again.
The impact on the web tier
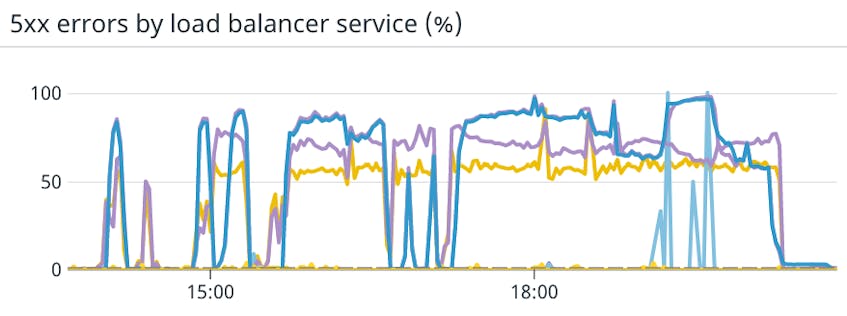
The web tier, which terminates all interactive requests from our users, was visibly affected by the incident. It was intermittently available, with error rates in the 60-90% range throughout, as shown below. In practice pages often errored out, or dashboards successfully refreshed only 10% to 40% of the time.
The web tier by its very nature sits at the top of a dependency tree: it only has downstream service dependencies and to provide a satisfactory experience, it must be able to find them. And when it’s able to find them, enough requests have to be successful for it to be able to send useful answers back to the user, be it a new page or call to populate a widget on a page.
By its position in the dependency tree, the web tier only returned to normal when enough services came back online. The web tier is built to handle transient errors downstream; there will always be a fraction of a percent of requests that fail during normal operations. These transient errors can be made invisible by automatically retrying the call, or made visible with an error message back to the browser if it’s informative. But with the majority of the downstream requests failing it did not materially improve until service discovery was stabilized. At that point it went back to normal as quickly as it degraded, as shown in the slopes of the graphs above, suddenly going from 60-80% error rate down to almost 0.
Internal response and recovery
A few minutes after the intake cluster started to show intermittent failures and roughly 20 minutes before we publicly declared an incident, teams triggered an internal one. It brought together on-call engineers for each of the affected services into a virtual war room and an incident commander to coordinate the overall response.
With service discovery and dynamic configuration down, a lot of the tools we have to mitigate failures became unavailable. We could no longer quickly alter the configuration, nor shed load to another part of the infrastructure. Bringing more capacity online across the board had virtually no effect until service discovery was fixed. Adding more capacity to the service discovery cluster proved ineffective, as distributed consensus-based systems require a quorum of nodes to agree on the state of the world. In this case each node of the service discovery cluster was already too loaded to properly admit extra ones and spread the load.
While the service discovery team was working to stabilize the cluster by cutting it off from all its clients and controlling re-admission, all other teams temporarily eliminated the dependency on service discovery and dynamic configuration. This turned out to be an iterative process for which we did not have ready-made, break-the-glass automation. The web tier was affected for a number of hours for the reasons mentioned above. Other backend services were restored before that point because they are by design isolated from the web tier.
External response
Our external response followed our usual playbook: update the status page when the issue is systemic and post updates every 30 minutes until resolution. In hindsight we were not as effective as we should have been to communicate clearly and unequivocally the impact of the incident and the steps we were taking.
In prior incidents we were able to get a sense of an ETA relatively quickly because we could make quantitative predictions on how fast a patch would be deployed or how soon a backlog of incoming data could be absorbed. In the best cases we were able to mitigate the internal incident before it could become customer-facing.
In this case, with so many services impacted, we scaled our internal response accordingly but did not do the same with our external response and our communication. We focused too much on the public status page and did not have a dedicated role in incident response to make sure our customers received timely updates if they were not watching our status page.
How do we avoid it in the future?
Post-incident, all engineering teams have been involved in forensic investigations in order to understand in depth what happened and summarize all the findings in a copious collection of internal postmortems. Here is the gist of what we are prioritizing now to avoid this type of failure in the future, with work already underway and continuing into Q4 ’20 and beyond.
Further decouple the control plane and the data plane
The unfortunate irony of this incident is that there would have been little to no impact if the service discovery and configuration system had been frozen so as to always return the same answers when queried. Instead, by favoring fast, convenient configuration updates and flexible service discovery we inadvertently coupled systems together in subtle ways.
We had already started to remove that coupling in the following ways, and we will double-down:
- We have split service discovery and dynamic configuration into separate services.
- We are building additional layers of cache to make DNS queries for the purpose of service discovery resilient to a prolonged loss of the core service discovery system.
- We are hardening all components to make them resilient to a prolonged loss of service discovery and dynamic configuration. When they are unavailable, services that process incoming data or answer interactive queries should fail “closed” and continue to work without degradation.
- We will regularly test the types of failures we experienced.
Improve the resilience of service discovery
The need to register and deregister services won’t go away but we must support it with a system that is not a single point of failure (be it distributed or not).
Improve the resilience of the web tier
Because the web tier sits in the middle of all queries made by our customers, it must be among the last systems to fail. This means reducing the number of hard dependencies to the absolute minimum with regular tests to make sure pages still load if soft dependencies fail downstream.
Improve our external response
It starts with having a dedicated role with clear processes to disseminate updates about high visibility incidents throughout. It also includes having clearer communication on the impact of an incident as it develops.
Provide a clear playbook in case of regional failure
Regardless of how much resilience we build into a Datadog instance running in a single region, there will remain a risk that the region becomes unavailable for one reason or another. We are committed to providing options for our customers to choose for contingency.
In closing
This incident has been a frustrating experience for our customers and a humbling moment for all Datadog teams. We are keenly aware of our responsibility as your partner. You trust us and our platform to be your eyes and ears and we are sorry for not living up to it on that day. We are committed to learning from this experience, and to delivering meaningful improvements to our service and our communication.
