Monitoring Insurance Data Lakes on AWS using Datadog
4月 24, 2025
Introduction
An insurance data lake provides organizations with a scalable, secure, and efficient way to aggregate large amounts of data from core policy administration systems, claims processing systems, and third-party providers. Using the “Collect, Cleanse, Curate, and Consume” method, organizations can ingest data, perform data quality management, apply actionable analytics, and meet regulatory compliance. This enables insurance providers to extract meaningful insights, achieve operational efficiency and enhance their risk management.
This post will serve as an architectural overview of how Datadog’s observability platform can be integrated with an insurance data lake on AWS to achieve comprehensive observability.
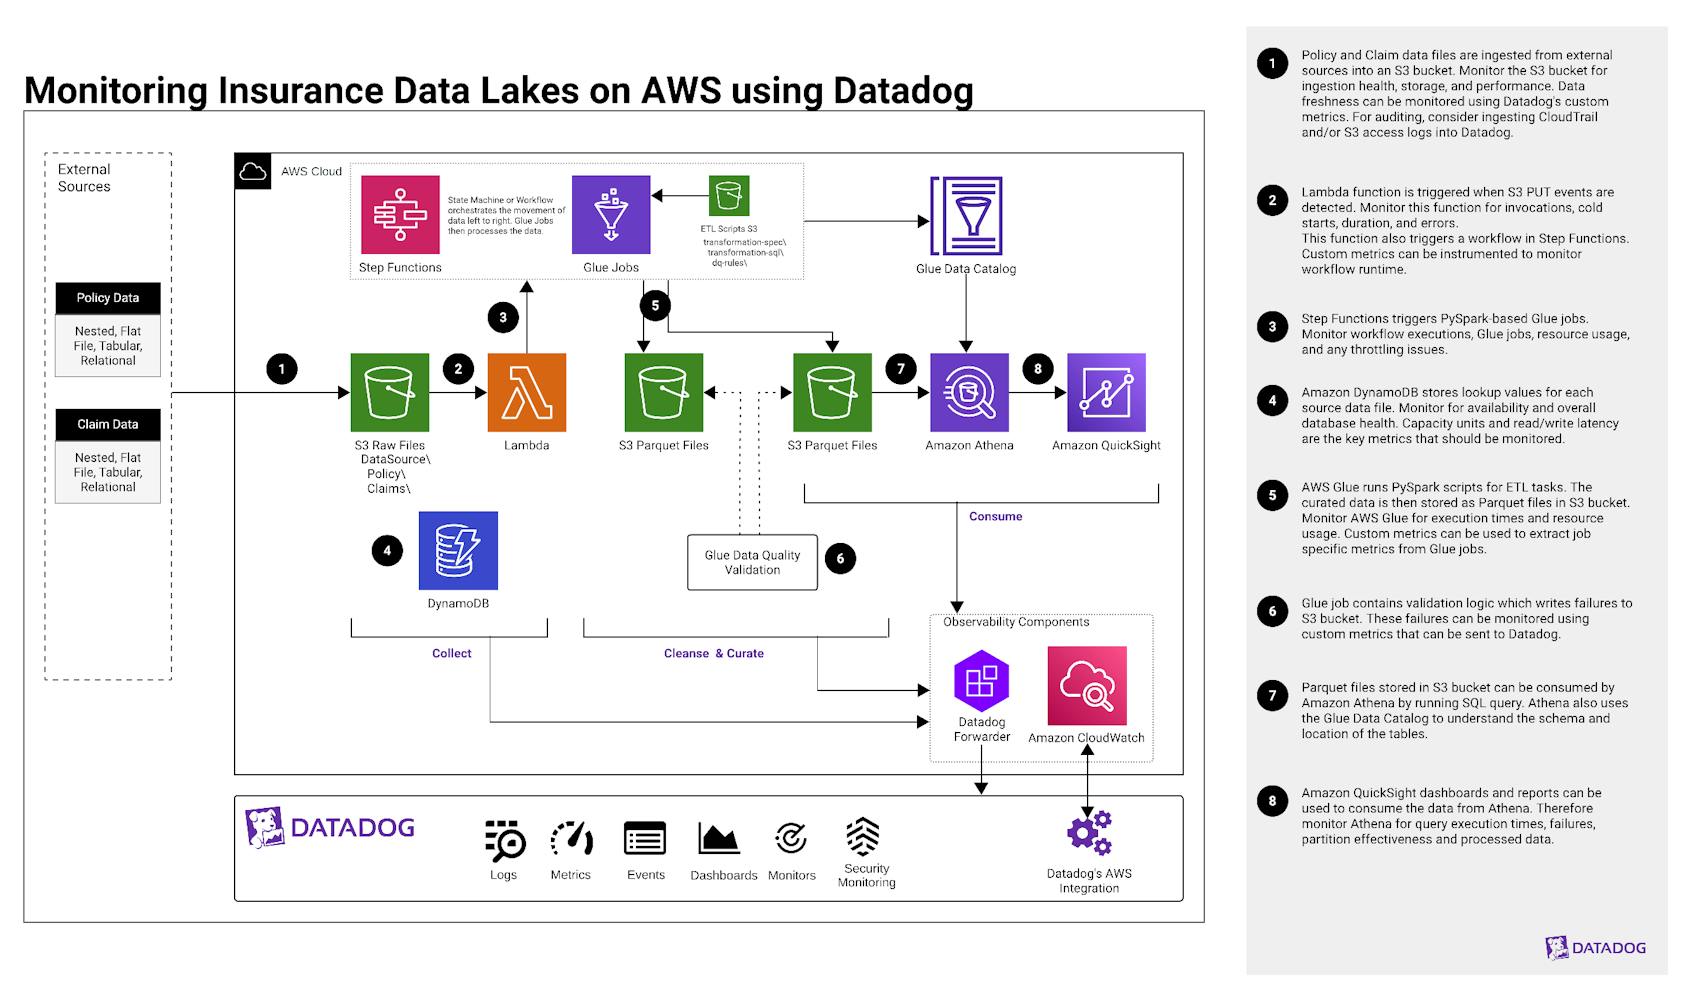
Explanation of the architecture
Phases explained
- Collect: involves gathering data from various sources of policy and claim systems.
- Cleanse and Curate: focuses on identifying data inconsistencies, correcting errors, validation, and transforming the collected data.
- Consume: use the transformed and processed data for analytics and reporting for decision-making purposes.
- 1. Policy and claim data files are ingested into the “Collect” S3 bucket from several sources:
- a. Amazon S3: Monitor for ingestion health, bucket storage usage, and performance. Using the Datadog AWS integration, you can monitor S3 PUT requests and request latency, as well as track storage usage and trends over time. Additionally, you can ensure access controls by monitoring S3 access denied errors.
- b. Custom metrics: Monitor for data freshness by creating custom Datadog metrics from Lambda functions triggered by S3 events such as file uploads.
- c. CloudTrail: Ingest CloudTrail and/or S3 access logs into Datadog for deeper security analysis and auditing to identify specific access patterns and errors, or to troubleshoot unexpected data ingestion behavior.
- 2. Using a Lambda trigger that invokes a function when PUT events are detected from incoming source data, logs all actions, and handles errors. This also starts the Step Functions workflow outlined in Step 3.
- a. Lambda: Monitor function invocation rate, errors, duration, and cold starts. Resource usage such as memory, CPU utilization, timeouts, and throttling can also be monitored.
- b. Instrument the Lambda function to ensure Lambda-triggered workflows are running correctly using custom metrics. Send custom metrics directly to Datadog for further monitoring.
- 3. AWS Step Functions triggers PySpark-based AWS Glue jobs, which maps the data according to your predefined data dictionary. This will then execute transformations and data quality checks for the “Cleanse” and “Consume” phases.
- a. AWS Step Functions: Monitor Step Functions workflow executions such as number of executions started, number of executions that completed successfully, executions that failed, timeouts, and the execution time. This will ensure workflows execute properly and successfully trigger Glue jobs.
- b. AWS Glue: Glue jobs perform critical ETL tasks, transformations, and data quality checks. Monitor job success, failure, execution time, resource usage, concurrency, and throttling.
- c. Log Forwarding: While the above metrics provide visibility into your services through alerts and monitors within Datadog, logs provide detailed context. Forward service logs from CloudWatch to Datadog using the Datadog Forwarder.
- 4. Amazon DynamoDB stores lookup values required by the lookup and multilookup transformations for each source data file. Additionally, any ETL metadata—job audit logs, data lineage output logs, and data quality results—is also recorded in DynamoDB.
- a. Amazon DynamoDB: Monitor for continuous availability and health using the
aws.dynamodb.system_errorsandaws.dynamodb.user_errors. To ensure provisioned or on-demand capacity and avoid throttling issues, monitor consumed and provisioned capacity units. Throttling impacts data transformation and latency. Therefore, monitor read/write throttle events and read/write latency. [1] Sudden change in data volume may indicate anomalies or ingestion issues. Item Count and Table size should also be monitored, which may reflect problems with metadata ingestion and/or cleanup jobs. - b. Log Forwarding: Forward DynamoDB logs from CloudWatch logs to Datadog to help trace errors, validate data lineage, and audit logs.
- a. Amazon DynamoDB: Monitor for continuous availability and health using the
- 5. After the source data is cleaned and curated using the PySpark scripts, it is stored in Apache Parquet format. These files are compressed (to reduce storage space) and organized into partitions (for efficient querying). PySpark scripts also help maintain accuracy and metadata by orchestrating AWS Glue Data Catalog, ensuring that they reflect the structure and definitions provided in the data dictionary.
- a. AWS Glue: Monitor execution times and resource usage to detect performance degradation or slowdowns, and optimize performance and cost efficiency.
- b. For job specific metrics, consider creating a custom metric to forward events generated by Glue in Eventbridge, such as
SUCCEEDED,FAILED,TIMEOUT, andSTOPPED.[2]
- 6. Source data validation failures are sent to an S3 bucket and Glue Data Catalog table. Analytics can be built against this for human review and appropriate action.
- a. Custom metrics: If the validation logic writes failure events to S3, you can monitor them by using custom metrics to track how many failures occurred.
- b. Monitor the S3 bucket for PUT requests to keep track of failure counts and spikes in object count.
- 7. Apache Parquet files stored in an S3 bucket can be consumed by Amazon Athena by running SQL queries. Athena also uses the neighboring Glue Data Catalog to understand the schema and location of tables.
- 8. Amazon QuickSight dashboards and reports can access data from the data lake either on a real-time or scheduled interval.
- a. Amazon Athena: Monitor for query execution times, failures, partition effectiveness, and processed data. These metrics will help detect slow queries or inefficient joins in tables, optimize storage scan efficiency, and prevent analytics disruption when using services such as Amazon QuickSight.
Authors
Lowell Abraham, Sr. Product Solutions Architect
References
Inspiration and reference documents or existing solutions: