Datadog Digital Experience Monitoring | Datadog

Optimize Key User Flows with Funnel Analysis

Visualize patterns across key user journeys with funnel analysis in Datadog RUM. Gain deeper visibility into user interactions and improve conversion rates.

/blog/reduce-customer-friction-funnel-analysis/funnel-analysis-dashboard

Why Datadog?

Custom Attributes & Actions

Automatically collect and monitor any interesting event with all the relevant context attached


Error Tracking Automatically

Group application errors into issues to get the context you need for root cause analysis and reduce MTTR


Frontend To Backend Correlation

See key frontend performance metrics in context with APM traces from backend services in your applications


Out-Of-The-Box Dashboards

Access nearly instant time to value for both set up and investigation


Product Benefits

Improve Conversion Rate with In-Depth User Insights

  • Track how conversion rates change over time as new features are built, and accurately address bottlenecks in end-to-end user journeys
  • Easily define and create funnel views with drag-and-drop functionality; effortlessly reorder or add steps to measure conversions based on changes
  • Add funnels to your dashboards, alongside other key performance indicators for your site or app's health, and share business data across teams in your organization
/blog/reduce-customer-friction-funnel-analysis/funnel-sidepanel-graphs-1.png

Correlate Performance Metrics and User Trends

  • Analyze frontend performance metrics correlated with user behavior data, and view success rates at every step of the workflow
  • Leverage Datadog Error Tracking to surface ongoing error patterns contributing to drop-off rates and reduce abandonment
  • Pivot to Datadog RUM and Session Replay to drill deeper into customer sessions and investigate the root causes of user friction
/blog/reduce-customer-friction-funnel-analysis/funnel-sidepanel-users.png

Make Data-Driven UX Optimizations

  • Gain key insights into how your apps perform across geographies, browsers, or any custom dimension
  • View page load times with First Contentful Paint, DOM Content Loaded, Time to Interactive, and other frontend performance metrics
  • Pinpoint the root cause of slow load times, whether it's an issue with the code, the network, or the infrastructure
/newoptimizeperformanceimage.png

Troubleshoot Frontend Performance Issues Faster

  • Understand user experience across web applications with critical performance data including Core Web Vitals
  • Identify which segments of your customers are experiencing errors in real time with tags for device, OS, and country
  • Resolve frontend Javascript errors in context with client-side logs and correlate error logs with individual user sessions with one click
/products/rum/newrumperformanceimage.png

Simplify Complexity with End-to-End Visibility

  • Detect, diagnose, and resolve incidents rapidly with Real User Monitoring, Error Tracking, Synthetics, APM, Logs, and Infrastructure monitoring in one unified platform
  • Reduce MTTD, MTTR with 1-click pivots from a user session to the line of code causing the error, to traces, logs and infrastructure metrics
  • Easily determine if user-facing incidents are due to frontend, backend, or third-party issues

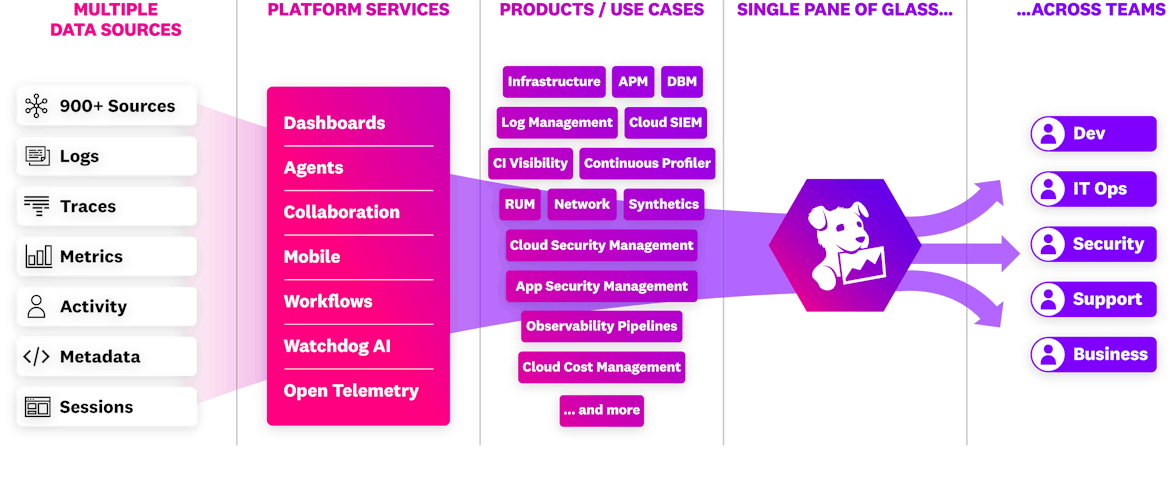
The Essential Monitoring and Security Platform for the Cloud Age

Datadog brings together end-to-end traces, metrics, and logs to make your applications, infrastructure, and third-party services entirely observable.

Platform Diagram

Loved & Trusted by Thousands

Washington Post logo 21st Century Fox Home Entertainment logo Peloton logo Samsung logo Comcast logo Nginx logo