Datadog Traefik Monitoring | Datadog

Monitor and Optimize Traefik

Collect, visualize, and alert on key Traefik metrics, including cache hits, misses, memory, CPU utilization, and network traffic.

850+ Turn-Key Integrations, Including

Product Benefits

Rapidly Identify Traefik Inefficiencies

  • Ensure you're caching the right data with real-time visibility into your cache hit rate; proactively receive alerts based on changes
  • Collect, visualize, and alert on key Traefik metrics such as request traffic, fetch times, load times, and a breakdown of HTTP status codes
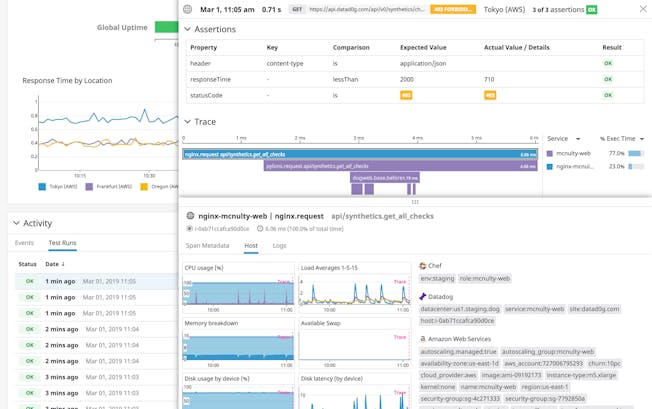
  • Ensure your services are delivering content properly; easily identify misconfigurations with end user experience monitoring and application performance monitoring
syntheticsfullstackvisib2x.jpg

Optimize Traefik Performance and Hit Rate

  • Achieve faster average performance and fewer misses with App Analytics and code profiling, which analyze distributed traces for systematic problems in how requests are servered
  • Diagnose the root causes of issues faster with infrastructure metrics, traces, logs, synthetic monitors, and real user data all within one platform
  • Test hypotheses in seconds by overlaying application events onto time-synchronized graphs
  • Utilize Webhooks to trigger automatic rollbacks of canary deployments

Improve Front-End and Back-End Performance

  • Explore rich data on both the front-end and back-end with full-stack monitoring; easily isolate regional or service specific performance problems in an intuitive interface without the need to use a query language
  • Gain key insights into how your apps perform across geographies and network connections with Cloud Network Monitoring, Real User Monitoring, and Synthetic Monitoring
  • Dive into specific user journeys to resolve incidents using any combination of attributes (such as browser and location) regardless of cardinality

Ensure High Availability and Site Reliability

  • Easily verify that your services maintain high availability through self-maintaining browser tests, API tests, and SLO tracking
  • Improve application performance with ability to quickly identify bottlenecks, inefficient code, heavy traffic issues, errors, and more with end-to-end application tracing, latency breakdowns, stack traces, and profiling
  • Rapidly pinpoint issues degrading end user experiences with high-granularity metrics on error rates, site reliability, response times, and web speed

Simplify Complexity with End-to-End Visibility

  • See inside any stack, any app, anywhere at any scale with vendor-backed integrations including AWS, Azure, GCP, and Kubernetes
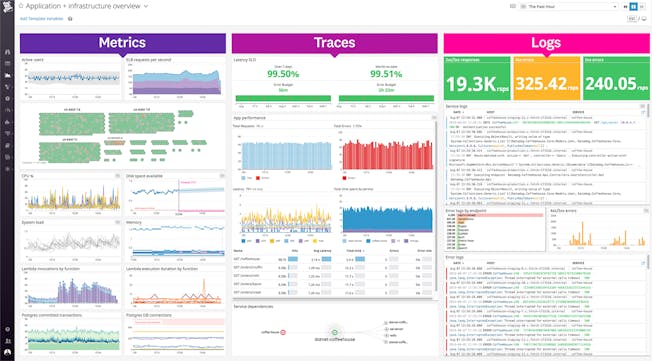
  • Discover in-depth insights into your entire software architecture with customizable, drag-and-drop dashboards available out-of-the-box for Datadog’s 850+ integrations
  • Monitor the health of all your on-premise servers, cloud services, containers, databases, applications, and more
ProductVideoDashboard_HD.jpg

Receive Alerts Only for the Issues that Matter and Eliminate False-Positives

  • Set up recommended alerts with 1 click for anomalies and outliers that account for daily, weekly, and seasonal fluctuations
  • Proactively prevent outages and errors in the future by alerting on metric forecasts
  • Combine alerts into composite alerts for greater granularity and stronger signal to reduce the noise
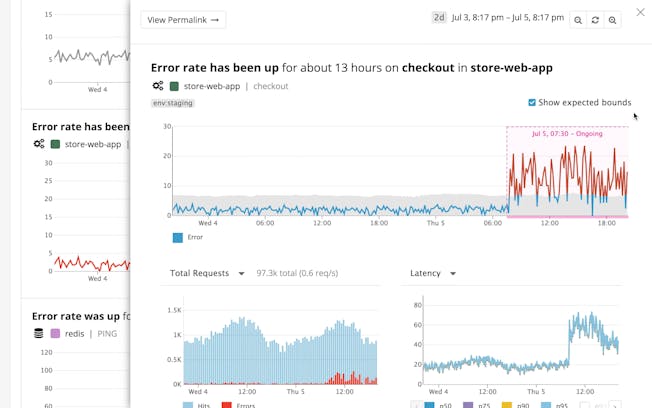
  • Automatically detect unanticipated outliers, anomalies, and errors with Watchdog
products/alerts/watchdog-machine-learning-alerts.jpeg

The Essential Monitoring and Security Platform for the Cloud Age

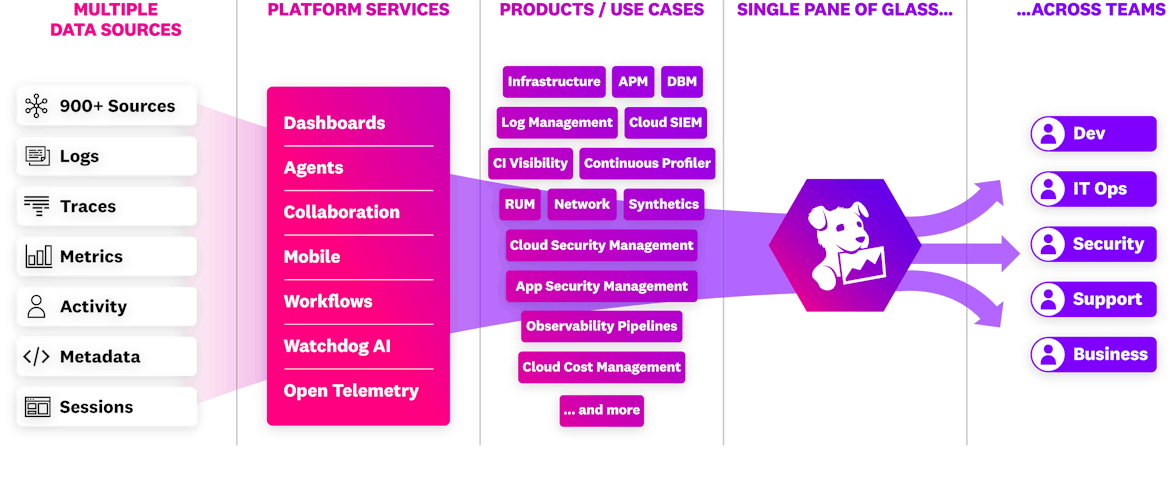
Datadog brings together end-to-end traces, metrics, and logs to make your applications, infrastructure, and third-party services entirely observable.

Platform Diagram

Loved & Trusted by Thousands

Washington Post logo 21st Century Fox Home Entertainment logo Peloton logo Samsung logo Comcast logo Nginx logo