Datadog Monitoring | Datadog

Create Custom MongoDB Graphs

Visualize performance in real time for MongoDB and 900+ other technologies.

dashboard-body-MongoDBv2

Why Datadog?

Unified Database Monitoring

Monitor your database fleets in one place to save time and effectively triage


Read-only Database Access

Grant more members of your teams access to database monitoring without sacrificing security


Applications in Context

Accelerate root cause analysis by correlating distributed traces with query metrics and explain plans in one view


Troubleshoot and Optimize Inefficient Queries

Easily understand database load, pinpoint long-running and blocking queries, drill into precise execution details, and optimize query performance


900+ Turn-Key Integrations, Including

Product Benefits

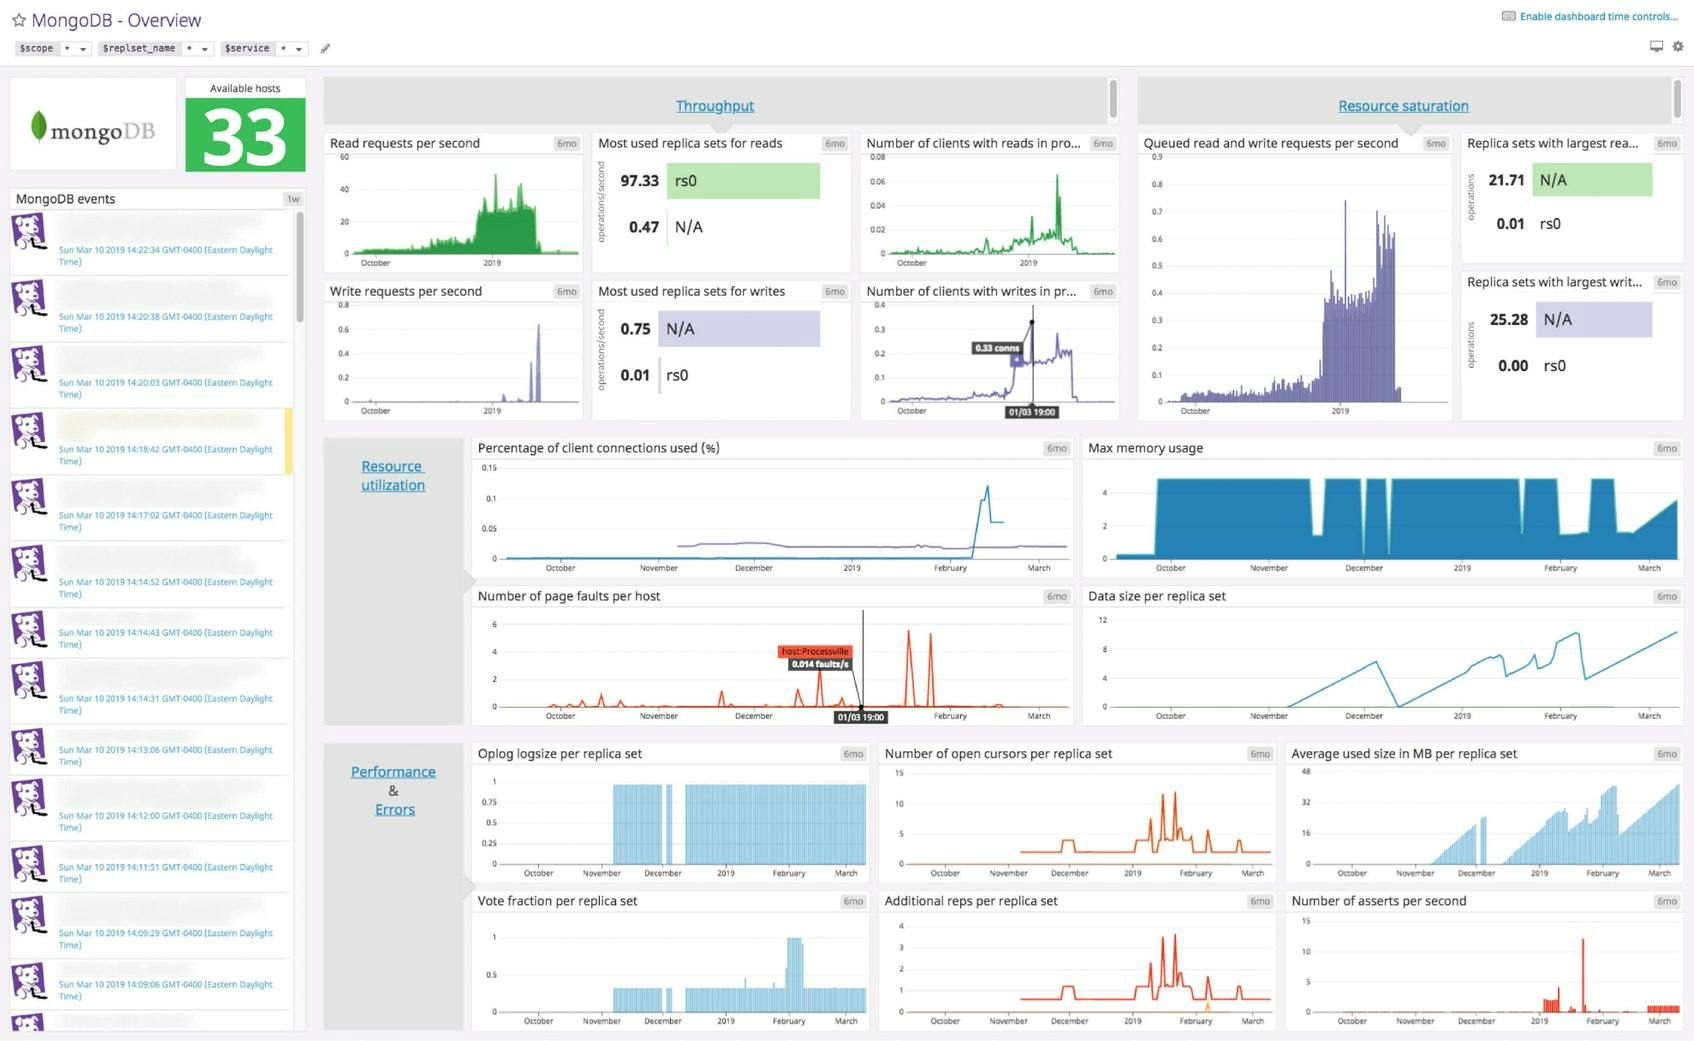
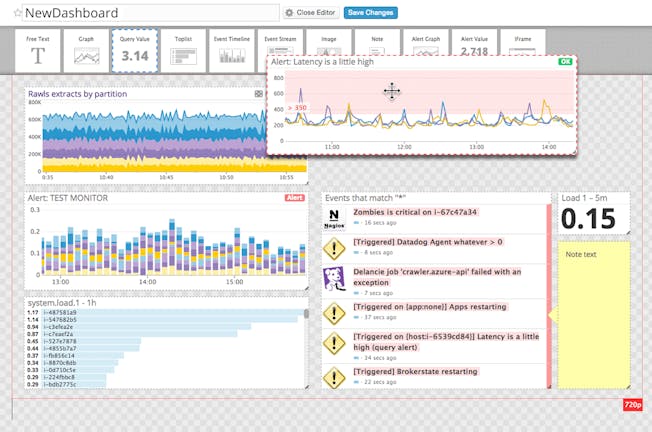
Create Custom, Drag-And-Drop MongoDB Dashboards Within Seconds

  • Get started monitoring quickly with out-of-the-box, templated dashboards for all of Datadog’s 900+ vendor-backed integrations, including MongoDB and AWS
  • View performance in real time and easily pull in custom metrics, such as order quantities and revenue totals, via API or a StatsD handler
homepage-screencaps-dashboards-v3.png

See Inside Any Stack, Any App, At Any Scale, Anywhere

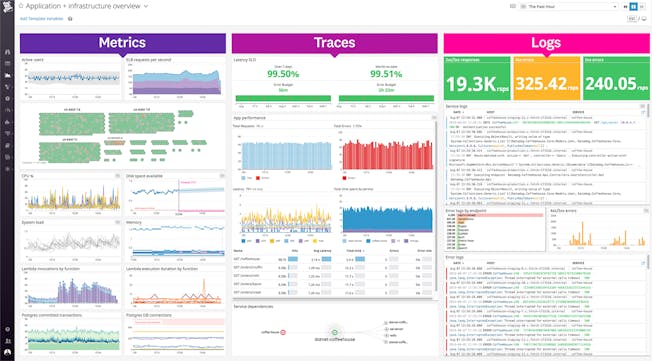
  • View infrastructure metrics, application traces, and logs all within a single pane of glass
  • Visualize performance via heatmaps, stacked graphs, toplists, and more
  • Utilize customizable dashboards for all your cloud services, containerized environments, applications, on-premise databases, and more
  • Explore historical metrics at 15-second granularity or better for over a year to better prepare for seasonal events
ProductVideoDashboard_HD.jpg

Automatically Surface Issues within Your Infrastructure

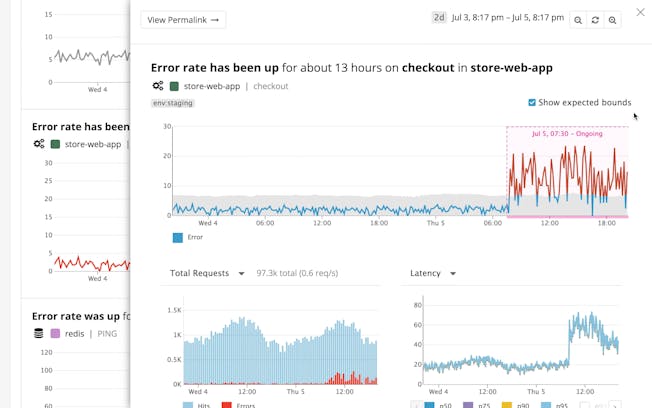
  • Detect anomalies in your IT infrastructure within seconds using Watchdog
  • View all your cloud and on-prem servers from a bird’s eye view; drill into individual hosts with 1 click
  • Monitor your containers as quickly as they are created and destroyed
  • Visualize highly-granular data and custom metrics in real time

Enhance App Reliability & Collaboration Across Teams

  • Diagnose root causes faster and see anomalous behavior across all your systems by correlating query metrics with database and infrastructure metrics
  • Expand your team’s access to query metrics without providing explicit database access to every user
  • Keep sensitive data secure with automatic obfuscation of PII in explain plans and query metrics
  • Scale DBM usage with your needs and manage a large number of databases securely

Receive Alerts Only for the Issues that Matter and Eliminate False-Positives

  • Set up recommended alerts with 1 click for anomalies and outliers that account for daily, weekly, and seasonal fluctuations
  • Proactively prevent outages and errors in the future by alerting on metric forecasts
  • Combine alerts into composite alerts for greater granularity and stronger signal to reduce the noise
  • Automatically detect unanticipated outliers, anomalies, and errors with Watchdog
products/alerts/watchdog-machine-learning-alerts.jpeg

Monitoring That's Simple to Deploy and Effortless to Manage

  • Track tens of thousands of infrastructure metrics and hundreds of drilled down query metrics out-of-the-box
  • Deploy and start monitoring without any need for professional services or extensive training
  • Promote adoption across your organization with our intuitive user interface that requires no query language and can be used by anyone

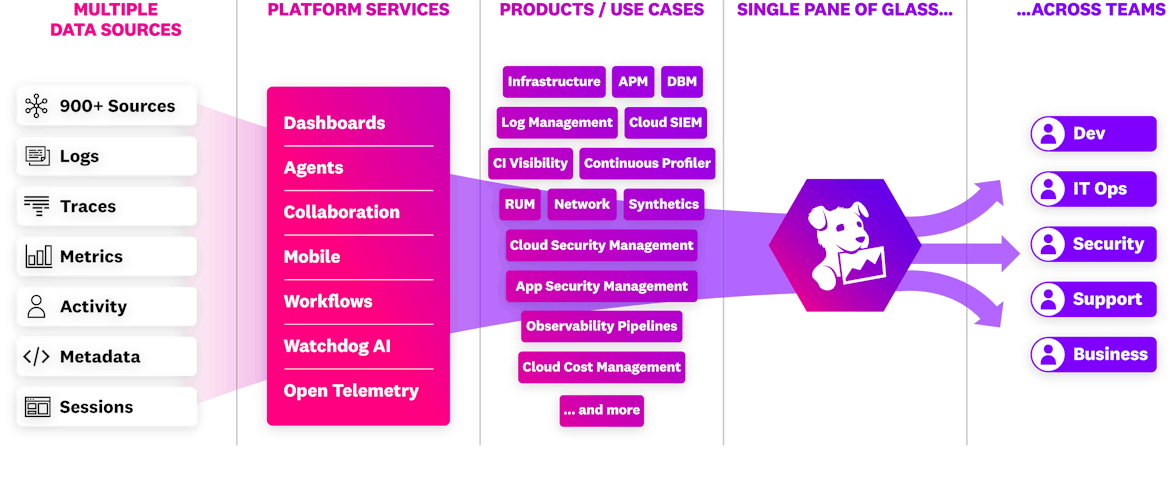
The Essential Monitoring and Security Platform for the Cloud Age

Datadog brings together end-to-end traces, metrics, and logs to make your applications, infrastructure, and third-party services entirely observable.

Platform Diagram

Loved & Trusted by Thousands

Washington Post logo 21st Century Fox Home Entertainment logo Peloton logo Samsung logo Comcast logo Nginx logo